www.atmos-chem-phys.net/14/9695/2014/ doi:10.5194/acp-14-9695-2014
© Author(s) 2014. CC Attribution 3.0 License.
Aqueous-phase photooxidation of levoglucosan – a mechanistic
study using aerosol time-of-flight chemical ionization mass
spectrometry (Aerosol ToF-CIMS)
R. Zhao, E. L. Mungall, A. K. Y. Lee, D. Aljawhary, and J. P. D. Abbatt
Department of Chemistry, University of Toronto, 80 St. George Street, Toronto, ON, Canada
Correspondence to:J. P. D. Abbatt (jabbatt@chem.utoronto.ca)
Received: 19 March 2014 – Published in Atmos. Chem. Phys. Discuss.: 2 April 2014 Revised: 7 July 2014 – Accepted: 28 July 2014 – Published: 16 September 2014
Abstract. Levoglucosan (LG) is a widely employed tracer for biomass burning (BB). Recent studies have shown that LG can react rapidly with hydroxyl (OH) radicals in the aqueous phase despite many mass balance receptor mod-els assuming it to be inert during atmospheric transport. In the current study, aqueous-phase photooxidation of LG by OH radicals was performed in the laboratory. The reaction kinetics and products were monitored by aerosol time-of-flight chemical ionization mass spectrometry (Aerosol ToF-CIMS). Approximately 50 reaction products were detected by the Aerosol ToF-CIMS during the photooxidation experi-ments, representing one of the most detailed product studies yet performed. By following the evolution of mass defects of product peaks, unique trends of adding oxygen (+O) and removing hydrogen (−2H) were observed among the prod-ucts detected, providing useful information for determining potential reaction mechanisms and sequences. Additionally, bond-scission reactions take place, leading to reaction inter-mediates with lower carbon numbers. We introduce a data analysis framework where the average oxidation state (OSc)
is plotted against a novel molecular property: double-bond-equivalence-to-carbon ratio (DBE/#C). The trajectory of LG photooxidation on this plot suggests formation of polybonyl intermediates and their subsequent conversion to car-boxylic acids as a general reaction trend. We also determined the rate constant of LG with OH radicals at room tempera-ture to be 1.08±0.16×10⁹M−1s−1. By coupling an aerosol
mass spectrometer (AMS) to the system, we observed a rapid decay of the mass fraction of organic signals at mass-to-charge ratio 60 (f60), corresponding closely to the LG de-cay monitored by the Aerosol ToF-CIMS. The trajectory of LG photooxidation on af44–f60 correlation plot matched
closely to literature field measurement data. This implies that aqueous-phase photooxidation might be partially contribut-ing to agcontribut-ing of BB particles in the ambient atmosphere.
1 Introduction
Biomass burning (BB) is a major source of atmospheric particles and volatile organic compounds (VOCs). Directly emitted VOCs and primary organic aerosol (POA) are subject to subsequent atmospheric processing, leading to formation of secondary organic aerosol (SOA) (Jimenez et al., 2009). Reliable and quantitative apportionment is required to un-derstand the effects of BB on air quality and climate. Ap-portionment of BB is commonly done using chemical trac-ers (Simoneit, 2002). Levoglucosan (LG) is a widely used particle-phase molecular tracer of BB (Simoneit et al., 1999), due to its source-specificity and abundance in BB aerosol.
demonstrated that the decay of BB organic aerosol signature both in the field and laboratory experiments is accompanied by a decrease inm/z60 and an increase inm/z44 (Grieshop et al., 2009; Hennigan et al., 2010; Cubison et al., 2011; Or-tega et al., 2013).
The decay of LG can be explained by several pathways. Heterogeneous oxidation of LG by gas-phase oxidants has been studied in the laboratory (Kessler et al., 2010; Hennigan et al., 2010; Knopf et al., 2011), where it has been demon-strated that particle-phase LG can be oxidized by hydroxyl (OH) radicals efficiently, leading to LG lifetimes on the or-der of days. More recently, gas-phase oxidation has also been proposed to contribute to LG loss (May et al., 2012). A small fraction of particle-phase LG can volatilize into the gas phase where it is oxidized efficiently. A third explanation for the observed LG decay is reactive loss in the aqueous phase, such as cloud water or aqueous aerosol particles. Studies from the past decade have revealed the atmospheric aque-ous phase as an important reaction medium where organic compounds can be processed, leading to formation and ag-ing of SOA (Blando and Turpin, 2000; Ervens et al., 2011). BB particles can be hygroscopic, depending on their size and inorganic composition (Petters and Kreidenweis, 2007; Pet-ters et al., 2009); therefore, a highly functionalized and wa-ter soluble organic species, such as LG, can be subject to aqueous-phase processing. Two laboratory studies have in-vestigated the kinetics of aqueous-phase OH oxidation of LG (Hoffmann et al., 2010; Teraji and Arakaki, 2010), finding that OH is the main sink for LG in the tropospheric aque-ous phase with lifetimes on the order of hours. By contrast, little is known of the aqueous-phase reaction mechanism of LG. The only studies are those of Holmes and Petrucci who investigated acid-catalyzed and OH-induced oligomerization (Holmes and Petrucci, 2006, 2007) and a recent theoretical study of possible reaction pathways (Bai et al., 2013).
The primary objective of this work is to provide a de-tailed mechanistic understanding of this oxidation chemistry, which is needed to incorporate LG photooxidation into cloud water models and to obtain more insight into the atmospheric processing of BB particles. Additionally, we revisit the reac-tion kinetics with OH radicals under condireac-tions relevant to cloud water processing. aerosol time-of-flight chemical ion-ization mass spectrometry (Aerosol ToF-CIMS) is employed to directly monitor LG and its reaction products in real time, after aerosolization of the reaction solution. The high mass resolution of the Aerosol ToF-CIMS enables unambiguous determination of product elemental composition, and sheds light on fundamental aspects of aqueous-phase photooxida-tion. We also demonstrate a novel analysis method, utilizing oxidation state (OSc) and double bond equivalence (DBE), to
obtain functional group information. To relate our results to previous field studies of BB aerosol, an AMS is employed to connect the chemistry to changes in the AMS signals atm/z
60 and 44.
HR-ToF-CIMS
Photo Reactor equipped with UVB lamps
Atomizer
AMS
Diffusion Drier
Pump
Reaction Solution Heated Line
3 LPM 1.5 LPM
Dilution Flow
To Exhaust
2 LPM
0.5 LPM
To Exhaust Reagent Ion Flow
210Po Cell 2 LPM
80 SCCM
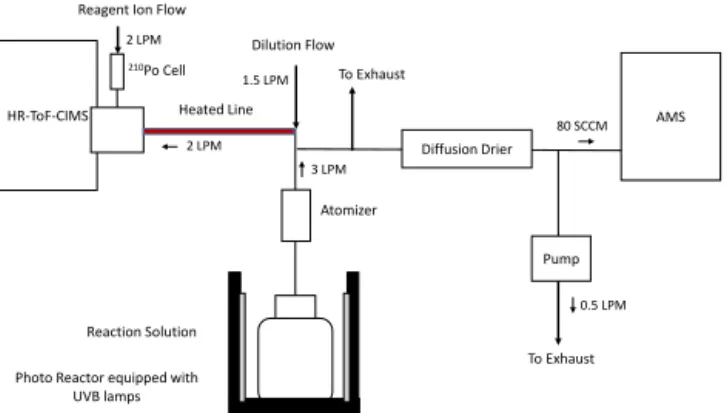
Figure 1.The experimental apparatus.
2 Experimental methods
2.1 Solution preparation and photooxidation
A solution of LG (1 mM) was prepared weekly by dissolving a commercial source (Sigma Aldrich, 99 %) in Milli-Q wa-ter (18 M-cm; total organic carbon (TOC)≤2 ppb; ELGA-PURELAB Flex). The reaction solution was prepared prior to each experiment by further diluting the stock solution in a Pyrex bottle to a volume of either 1 L (for the mechanistic study) or 100 mL (for the kinetic study) with a LG concen-tration of 10 µM for the mechanistic experiments or 30 µM for the kinetic experiments. H2O2 (Sigma Aldrich,≥30%,
TraceSELECT) was added to the solution as the precursor of hydroxyl (OH) radicals upon irradiation. The concentra-tion of H2O2was typically 1 mM, unless mentioned
other-wise. The reaction solution was placed in a cylindrical photo-reactor (Radionex, RMR-200) which supplies UVB radiation from all sides, but not from the top or bottom. The solution was constantly stirred by a magnetic stir bar, with a fan em-ployed to minimize solution heating. The solution tempera-ture during photooxidation was approximately 301 K. A se-ries of control experiments was performed to confirm that LG was not directly photolyzed under UVB light. A small amount of LG reacted upon H2O2addition in the dark which
did not affect the results. 2.2 Aerosol ToF-CIMS
coworkers (Hearn and Smith, 2004) coupled a heated line to a CIMS instrument and for the first time referred this sys-tem as an Aerosol CIMS. Since then, Aerosol CIMS has been employed to investigate aqueous-phase organic chem-istry (Sareen et al., 2010; Zhao et al., 2012; Aljawhary et al., 2013). The strength of Aerosol CIMS lies in the fast time re-sponse, enabling in situ monitoring of aqueous-phase chem-istry. In the current study, high mass resolution (3000 to 4000 Th Th−1 in the relevantm/zrange in V-mode) and ex-cellent detection sensitivity were achieved by employing an Aerodyne high-resolution time-of-flight chemical ionization mass spectrometer (Bertram et al., 2011). This technique is hereafter referred to as Aerosol ToF-CIMS. For all the ex-periments, the ToF-CIMS was operated in V-mode, and the data were analyzed using Tofwerk v. 2.2 on IGOR platform. To examine the accuracy of elemental assignment, we com-pared the oxygen-to-carbon (O / C) and hydrogen-to-carbon (H / C) ratios measured from the LG solution to the theoreti-cal O / C and H / C of LG, and agreement was observed to be within 10 %. More details on the data analysis are described elsewhere (Aljawhary et al. (2013) and references herein).
Our previous study has shown that Aerosol ToF-CIMS can be used to target different analyte types through the choice of reagent ion. Three reagent ions were employed in the current study: protonated water clusters ((H2O)nH+),
io-dide water clusters (I(H2O)−n), and acetate (CH3C(O)O−).
These reagent ions were generated by introducing water va-por, gas-phase CH3I, and gas-phase acetic anhydride,
re-spectively, through a Po210radioactive cell (NRD, P-2021). The detailed setup, ionization mechanisms, and sensitivity of each of these reagent ions for atmospherically relevant or-ganic compounds have been summarized in Aljawhary et al. (2013), and are mentioned only briefly here.(H2O)nH+can
detect organic compounds that have higher proton affinity (i.e., higher gas-phase basicity) than that of water clusters ((H2O)n).(H2O)nH+ is employed in the kinetic study
be-cause it detects both LG and dimethylsulfoxide (DMSO), the kinetics reference compound (see next section). I(H2O)−n
is employed as the primary reagent ion for studying reac-tion mechanisms because it is sensitive to a wide spectrum of oxygenated compounds that can form clusters with I−, including LG and its reaction products (Lee et al., 2014; Aljawhary et al., 2013). CH3C(O)O− is also employed to
study the mechanism and to confirm the results from the I(H2O)−n experiments. CH3C(O)O−abstracts a proton from
compounds that exhibit higher gas-phase acidity than acetic acid and can selectively detect a variety of organic and in-organic acids. Occasionally, non-acid species (e.g., LG) can also form clusters with CH3C(O)O−.
2.3 Mechanistic and kinetic studies
Investigation of the reaction mechanism focused on the iden-tification of multiple generations of reaction products arising during photooxidation using the I(H2O)−n and CH3C(O)O−
reagent ions. The rate constant of LG reacting with OH rad-icals was determined using the relative rate method, where the decay of LG is related to that of DMSO, a reference compound with well-known OH reactivity (see Sect. 3.2). A fixed concentration (5 µM) of DMSO (Caledon Labora-tory Chemicals,>99 %) was added to the reaction solution prior to the initiation of photooxidation. The signals of LG and DMSO were monitored concurrently using Aerosol ToF-CIMS with(H2O)nH+as the reagent ion. The following
re-lationship holds for the decay of LG and DMSO:
ln
[
LG]0 [LG]t
= k
II LG
kDMSOII ×ln
[
DMSO]0
[DMSO]t
, (1)
where [X]t represents the signal of compound X mea-sured at time t, and kIIx represents the second-order rate constant of X reacting with OH radicals. The relationship in Eq. 1 indicates that plotting ln([LG]0/[LG]t) against ln([DMSO]0/[DMSO]t) should result in a linear plot, with the slope representing the ratio of the two rate constants.
The LG concentration used (10 to 30 µM) is expected to be similar to cloud water concentrations, assuming typ-ical organic aerosol loading, LG mass fraction in organic aerosol, and complete scavenging by a typical cloud wa-ter liquid content. Although the H2O2concentration used in
the experiment is much higher than the ambient level, the steady-state concentration of OH was estimated to be ap-proximately 2×10⁻¹³M from the first-order decay rate of LG. This steady-state concentration of OH radicals is in the range relevant to cloud water (Jacob, 1986). We believe that the reaction mechanism investigated in the current study is representative for cloud processing given that similar reac-tant concentrations are used as those in cloud water.
3 Results and discussion
3.1 Reaction products and mechanism
Using the I(H2O)−n reagent ion, roughly 50 reaction
prod-ucts were detected as clusters with iodide, as described in the Supplement Table S1. The m/z of the products ranged between 173 Th and 351 Th (in the form of I− clusters). While Holmes and Petrucci (2006, 2007) observed signif-icant degree of oligomerization with product m/z up to 1000 Th, oligomers of LG were not observed. The absence of oligomeric products might be due to (1) the initial concentra-tion of LG being lower in the current study (higher concen-trations can facilitate oligomerization, Lim et al., 2010) or (2) the Aerosol ToF-CIMS setup is not sensitive to oligomers. In our previous study (Aljawhary et al., 2013), dimers of
α-pinene SOA components were detected from aqueous ab-stract using the same instrument hence oligomers are likely below the detection limit of the current study. That being said, we cannot rule out the possibility that oligomers and other low-volatility compounds have been lost to the wall of the volatilization line, if there are cold spots. Although the volatilization line is carefully wrapped by a heating tape thoroughly and evenly to minimize cold spots, the inner wall of the CIMS’s ion-molecular region can potentially be a cold spot because its temperature is lower. The current study focuses on the discussion of monomeric reaction products which are detected by the Aerosol ToF-CIMS with better sen-sitivity.
Overall, the observed products imply that two categories of reaction mechanisms occur in the reaction system simulta-neously: functionalization and bond scission. Functionaliza-tion reacFunctionaliza-tions modify the funcFunctionaliza-tional groups on the molecules but do not lead to cleavage of carbon–carbon bonds, while bond-scission reactions result in carbon–carbon bond break-age.
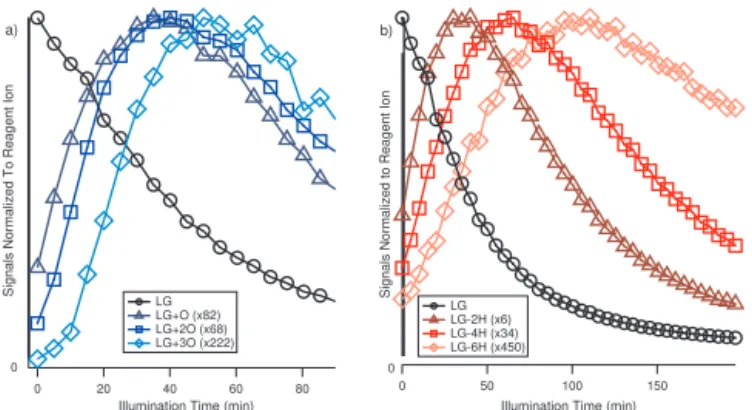
3.1.1 Functionalization – unique trends of+O and−2H LG is detected at m/z 289 as a cluster with iodide (CH10O5I−). As the LG signal decays, peaks that are a
mul-tiple of 16 Th apart from LG (i.e., atm/z305, 321 and 337) formed rapidly one after another (Fig. 2a).
Their elemental compositions are different from each other by one oxygen particle, and this trend is herein referred to as the “+O” trend. Peaks that are a multiple of 2 Th apart from LG (i.e.,m/z287, 285, and 283) are also observed one after another (Fig. 2b). The elemental composition of these compounds is different by two hydrogen atoms from each other, and this trend is referred to as the “−2H” trend here-after. Interestingly, the+O and the−2H trends proceed si-multaneously, forming a series of unique product patterns.
A mass defect plot (Hughey et al., 2001) of the major prod-ucts detected with the I(H2O)−n reagent ion clearly illustrates
the two trends occurring in the system (Fig. 3a). Mass
de-Signals Normalized to Reagent Ion
150 100 50 0
Illumination Time (min)
Signals Normalized To Reagent Ion
80 60 40 20 0
Illumination Time (min) LG LG+O (x82) LG+2O (x68) LG+3O (x222)
b)
0 0
a) b)
LG LG-2H (x6) LG-4H (x34) LG-6H (x450)
Figure 2.The evolution of the “+O”(a)and the “−2H”(b)series from levoglucosan (LG). The signal of each compound normalized by the reagent ion intensity atm/z145 (I(H2O)−) is shown as a
function of the irradiation time. The signals are multiplied by the bracketed number to be on scale.
fect diagrams plot mass defect (exact mass−nominal mass) against the exact mass of each compound. Since H atoms and O atoms have their own mass defects (+0.007825 for H and
−0.005085 for O), compounds that are apart from each other by 2H line up on a slope of 7.77×10⁻³while compounds that are apart by an O line up on a slope of−3.18×10⁻⁴, as indicated by the dotted lines in Fig. 3a. The time at which each peak reached its maximum level is used to track the or-der of formation, and is presented by the color code. It can be clearly seen that multiple+O and−2H trends develop in the reaction system during photooxidation (Fig. 3a). The max-imum signal intensity reached by each peak is used as an indicator of the amount of formation and is represented by the area of the data points (in log scale). We note that differ-ent compounds exhibit differdiffer-ent detection sensitivity to the reagent ion of choice. Aljawhary et al. (2013) have demon-strated that the I(H2O)−n reagent ion can detect oxygenated
compounds with carbon numbers of three or more with a rel-atively constant detection sensitivity. We consider the signal intensity as a semi-quantitative presentation of the amount of each product.
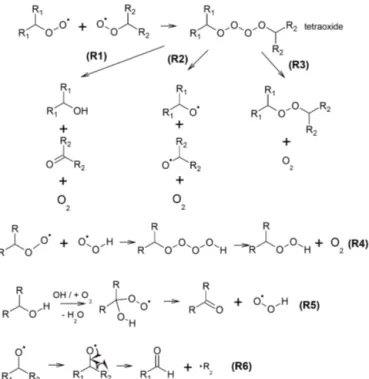
The+O trend must arise from formation of hydroxyl or hydroperoxyl functional groups because these are the only possible mechanisms leading to addition of oxygen without losing any hydrogen. Formation of these functional groups in the aqueous phase has been well studied (von Sonntag et al., 1997). The reaction is initiated by H-abstraction and forma-tion of an alkylperoxy radical (RO2). RO2can react with
an-other RO2or a hydroperoxy radical (HO2) to form a tetroxide
intermediate which gives rise to a variety of products (Fig. 4, R1 to R3).
Among these reaction pathways, R1 gives rise to a hy-droxyl functional group. When a tetroxide is formed between RO2and HO2radicals (R4), a hydroperoxyl functional group
O O OH
OH OH
O O
OH O OH
O O
OH O O
O O
O O O
O O
OH OH OH O H
O O
OH OH OH O H
O H
O O
OH OH OH O H
O H
OH
O O
OH O OH O H
O O
OH O O O H
O O
O O O O H
O O
OH O OH O H
O H
O O OH
O
OH
O H
O H
OH
O O OH
O O O H
O H
OH
a)
b)
Figure 3.The mass defect diagram of the major products detected using the iodide water cluster (I(H2O)−n) reagent ion(a). The color
code indicates the time at which each compound reached its maxi-mum signal intensity and the area of the circles represents the max-imum signal intensity reached (in log scale). Compounds that did not reach their maxima during the first 300 min of illumination are shown in black. The+O and the−2H series fall on the slope in-dicated by the dotted lines. The region relevant to products arising from+O and−2H trends is presented in(b). The proposed struc-tures of each product are shown beside the data points.
Petrucci (2007), likely arising from conversion of hydroxyl functional groups into carbonyl groups (Fig. 4, R5). When the initial H abstraction occurs from a carbon atom with an existing hydroxyl functional group, the subsequently formed peroxy radical leads to formation of a carbonyl group and releases a HO2molecule. This study demonstrates that this
conversion can occur multiple times, eventually converting a polyol into a polycarbonyl compound. To confirm this re-action mechanism, we performed an experiment of aqueous-phase photooxidation of another polyol, erythritol, using the same experimental conditions. The same−2H trend was ob-served, consistent with the proposed reaction mechanism. We note that carbonyls can be also formed via the same mech-anism leading to the formation of the hydroxyl functional group (i.e., R1 in Fig. 4). However, formation via this
path-Figure 4.Sample reaction mechanisms that give rise to the+O and
−2H trends. The tetroxide intermediate forming from two alkylper-oxy radicals can result in a variety of products as shown in (R1) to (R3), among which (R1) can lead to formation of the hydroxyl func-tional group. A hydroperoxy funcfunc-tional group can be formed from
RO2+HO2(R4). The hydroxyl-to-carbonyl conversion shown in
(R5) is likely responsible for the−2H trend. Alkoxy radicals trig-ger bond-scission reactions and give rise to an aldehydic compound (R6).
way would not lead to the observed−2H trend and is likely a minor formation pathway of carbonyls compared to R5.
O O O H
OH OH
O OH
O OH
OH OH O O
O O
O OH OH O
O O OH O
O H
O OH O
O OH
O OH O
i) C3H2O3 ii) C3H4O3 iii) C4H6O4 iv) C4H4O5
v) C5H6O5 vi) C5H8O5
vii) C6H10O7
O O
O
H OH
O
OH
formic acid glyoxylic acid glycolic acid glyoxal monohydrate
oxalic acid
O OH
H OH
O
H O
OH
O O
H OH
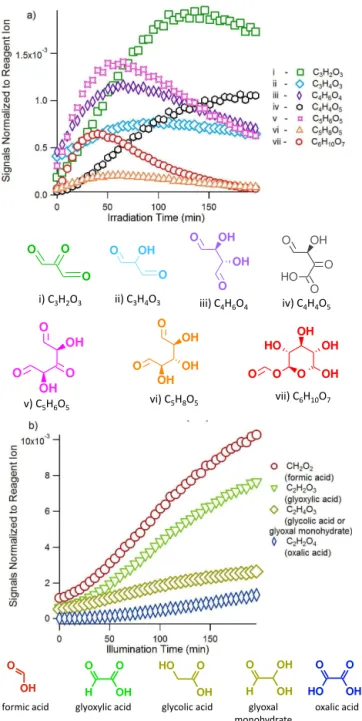
Figure 5. Evolution of bond-scission products measured by the I(H2O)−n reagent ion. Selected major products with three to six
carbons are shown in(a), with their proposed structures. The pro-posed reaction mechanisms leading to their formation are attached in Supplement Fig. S1. Formation of small organic acids with one or two carbons are shown in(b). All the signals have been normalized against the reagent ion (I(H2O)−) atm/z145.
3.1.2 Bond-scission reactions
Scission of C–C bonds is likely triggered by formation of alkoxy radicals via R2 (Fig. 4) from the tetroxide intermedi-ate. Cleavage of one C–C bond gives rise to an aldehyde and an alkyl radical (R6, Fig. 4). Time series of selected major
bond-scission products are shown in Fig. 5a, along with their elemental composition and proposed structures. As a gen-eral trend, products with five or six carbons (i.e., products v, vi, vii) form first, followed by those with smaller carbon numbers as photooxidation proceeds. Using the current mass spectrometric method, it is difficult to unambiguously deter-mine the structure of these detected species. It is also not possible to completely rule out the possibility of the frag-mentation of large ions in the mass spectrometer, contribut-ing to peaks with smallerm/z. However, the distinct time profiles observed for most of the products imply that they are independent compounds. The proposed structures have been estimated from a series of reaction mechanisms shown in the Supplement Fig. S1. The proposed mechanisms have been constructed based on widely accepted reaction mechanisms, and the sequence of product formation is consistent with the observed time series. The LG photooxidation reaction sys-tem is highly complicated, as demonstrated by the proposed mechanisms. Multiple reaction pathways can likely lead to the same product, and one chemical formula may constitute multiple compounds with varying structures. For this reason, the current work is not intended to determine the complete reaction mechanism but rather to elucidate the general trend of reactions by monitoring major products detected.
We propose that bond scission may not immediately lead to compounds with fewer carbon numbers in the case of LG photooxidation. This is because LG contains ring structures, and bond scission can likely lead to ring cleavage before molecule fragmentation. Formation of product vii (Fig. 5a) presents one such example. This bond-scission product has a larger molecular weight compared to LG. However, prod-uct vii overlaps with one of the proposed prodprod-ucts in the+O and−2H series (see previous sections), making it difficult to elucidate its magnitude of formation. In a study of heteroge-neous oxidation of LG and erythritol, Kessler et al. (2010) observed that the mass loss during LG photooxidation was slower than that from erythritol and also proposed that ring cleavage in the LG system delayed molecule fragmentation. We suspect that this delay might be due to formation of com-pounds such as product vii.
Formation of small organic acids with carbon numbers equal to or less than two are also observed as later genera-tion products (Fig. 5b), confirmed by both the I(H2O)−n and
theCH3C(O)O− reagent ion experiments. It is difficult to
2.30 2.25 2.20 2.15 2.10 2.05 2.00
Double Bond Equivalence (DBE)
400 300
200 100
0
Illumination Time (min)
0.8
0.7
0.6
0.5
DBE to C ratio (DBE/#C)
1.6
1.4
1.2
1.0
0.8
0.6
0.4
OS
c
Intensity-weighted Average of DBE
DBE to C ratio OSc
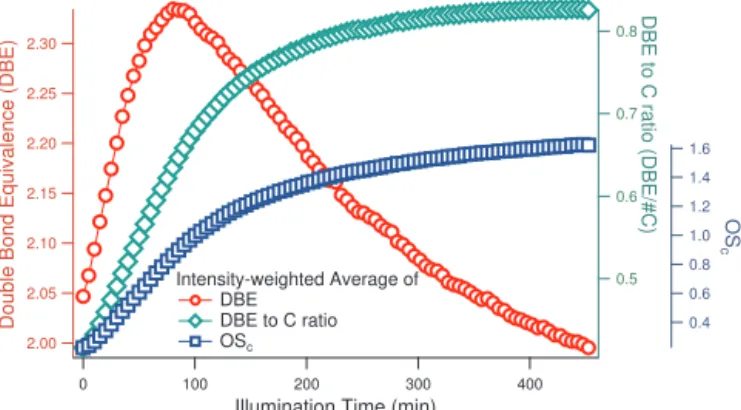
Figure 6.Intensity-weighted average of double bond equivalence (DBE), DBE-to-carbon ratio (DBE/#C), and oxidation state (OSc)
as a function of irradiation time.
the aqueous phase. We consider the small organic acids as the final carbon reservoir before they either volatilize from the aqueous phase or are eventually oxidized to CO2.
3.1.3 Obtaining functional group information from the Aerosol ToF-CIMS
As a general trend within the LG system, we hypothesize that a series of compounds containing multiple carbonyl functional groups may form as reaction intermediates and then are subsequently oxidized to carboxylic acids. Carbonyl functional groups have likely arisen from (1) the hydroxyl-to-carbonyl conversion mechanism mentioned in the previ-ous section and (2) bond scission of an alkoxy radical yield-ing an aldehyde functional group (R6, Fig. 4). Rapid forma-tion of carboxylic acids from aldehydes in the aqueous phase has been well documented (Schuchmann and von Sonntag, 1988; Lim et al., 2010; Zhao et al., 2012). This is a mecha-nism unique to the aqueous phase because it is initiated by hydration of an aldehyde or an acyl radical (Scheme 4, Sup-plement Fig. S1).
Although the Aerosol ToF-CIMS is a powerful tool to elu-cidate elemental composition, its ability to reveal functional group information is limited. Here, we present an analy-sis framework employing two molecular properties, double bond equivalence (DBE) (Bateman et al., 2011) and oxida-tion state (OSc) (Kroll et al., 2011), which are calculated by
Eqs. (2 and 3): DBE=#C−#H
2 +1, (2)
OSc=2×O/C−H/C, (3)
where #C and #H represent the numbers of carbon and hy-drogen atoms contained in each product molecule while O / C and H / C represent the oxygen-to-carbon and hydrogen-to-carbon ratios of each product, respectively. These parame-ters are readily available from the high mass resolution anal-ysis of the Aerosol ToF-CIMS. The intensity-weighted
av-erage of DBE and OSc from the 50 products monitored by
the I(H2O)−n reagent ion (Table S1) are displayed in Fig. 6.
While OScexhibited continuous increase throughout the
en-tire photooxidation experiment, DBE exhibited an increase at the beginning but a decrease in the later half of the exper-iment. An increase in DBE can be attributed to formation of (1) carbon–carbon double/triple bonds, (2) ring structures, or (3) carbon–oxygen double bonds (i.e., C=O in carbonyl or carboxylic acid). Under an oxidative environment, formation of (1) and (2) is unlikely. Therefore, we conclude that the ini-tial increase of DBE is due to formation of C=O functional groups in the solution. The later decrease of DBE is due to molecule fragmentation, making compounds with smaller #C dominate in the later stages of the photooxidation. To compensate this fragmentation effect, we introduce a novel molecular property, DBE-to-carbon ratio (DBE/#C), which represents the average number of DBE associated with each carbon. The intensity-weighted average DBE/#C exhibited continuous increase (Fig. 6), approaching 1 by the end of the photooxidation experiment. Note that the theoretical maxi-mum value of DBE/#C is 1. This observation indicates that a C=O double bond is associated with almost every carbon by the end of photooxidation.
Although DBE/#C alone cannot distinguish between C=O bonds in carbonyl and carboxylic acid functional groups, plotting OSc against DBE/#C provides another dimension
to the data analysis. This approach takes advantage of the fact that conversion of a carbonyl (i.e., aldehyde) to a car-boxylic acid involves increase in the molecular OSc, but the
DBE/#C remains the same. OScis chosen instead of O / C
here because O / C is affected by non-oxidative processes, such as hydration of aldehydes, while OSc is not (Kroll et
al. 2011). The trajectory of intensity-weighted average OSc
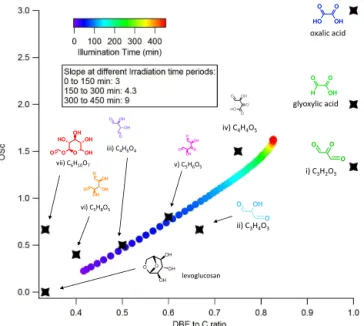
vs. DBE/#C is shown in Fig. 7, color coded by the illumi-nation time. During the first 150 min of illumiillumi-nation, both OScand DBE/#C increase rapidly, leading to a dramatic and
linear movement on the plot with a slope of 3. From 150 to 300 min of irradiation, the increases of OScand DBE/#C are
both slower, but with OScincreasing faster, leading to a slope
of 4.3. During the last 150 min of irradiation, DBE/#C stays almost constant at 0.82, close to its theoretical maximum, while OScstill exhibited slow but continuous increase. The
slope during this time period is 9.
This observation is interpreted as observational evidence of polycarbonyl intermediates rapidly forming in the solu-tion during the early stages of photooxidasolu-tion, giving rise to rapid increase in both DBE/#C and OSc. As the illumination
reaches 4 h, the average DBE/#C reaches 0.8, indicating the abundance of C=O functional group at this moment. At the final stages of photooxidation, aldehyde-to-carboxylic acid conversion becomes dominant, leading to a greater increase in OSc relative to DBE/#C. In addition to the
O O O H
OH OH
O OH
O OH
OH OH O
O O O O
O OH O
O H
O OH O
O OH
O OH O
i) C3H2O3
ii) C3H4O3
iii) C4H6O4
iv) C4H4O5
v) C5H6O5
vi) C5H8O5 vii) C6H10O7
O O O H OH
glyoxylic acid oxalic acid
O O
H OH
O OH OH O
O O
OH OH OH
levoglucosan
Figure 7. OSc vs DBE/#C plot. The intensity-weighted average OScand DBE/#C from the products listed in Supplement Table S1
are displayed here. The color code represents the illumination time. The coordinates of major compounds are also shown.
O O
OH OH OH
Formation of ROH and/or ROOH
groups
Formation of carbonyl group
Compounds with reduced carbon number
Poly-carbonyl intermediates levoglucosan
Small organic acids The +O trend
The -2H trend
Bond scission Acid formation
Acid formation Multiple oxidation
Figure 8.A simplified overview of reaction mechanisms discussed in the current study. Solid arrows represent proposed reaction path-ways of LG upon OH oxidation. The dashed arrows illustrate the complicity in the reaction system where each product can also take more than one reaction path.
Starting from levoglucosan at the left bottom corner, the major products sequentially formed during photooxidation are located towards the right upper corner of the plot. Ox-alic acid, located at the right upper corner, presents the the-oretical maximum for both DBE/#C and OSc. The averaged
trajectory passes through these major products. 3.1.4 Summary of reaction mechanism
As can be seen from the discussion thus far, the reaction mechanisms of the aqueous-phase LG photooxidation by OH is highly complicated. Figure 8 provides a simplified overview of the mechanisms discussed in the current study. Oxidized by OH, a LG molecule can likely undergo one of the following reaction pathways: (1) formation of a hydroxyl or hydroperoxyl functional group, (2) conversion of a
hy-Table 1.Summary of the conditions and the results of the kinetic experiments.
Exp. # [LG] (µM) [DMSO] (µM) H2O2(µM) kIILG(M−1s−1)
1 30 5 0.5 8.06×10⁸
2 30 5 1 1.10×10⁹
3 30 5 1 1.08×10⁹
4 30 5 1.5 1.23×10⁹
5 30 5 0.5 1.16×10⁹
Average 1.08×10⁹
droxyl group into a carbonyl group, and (3) bond-scission reactions to form products with reduced carbon number. Among these three pathways, (1) and (2) present function-alization reactions, and consecutive occurrence of these two pathways has likely given rise to the observed+O and−2H trends. In fact, each product formed also has the opportu-nity to undergo one of the three reaction pathways mentioned above, forming a complicated reaction system (illustrated by the dashed arrows in Fig. 8). We propose that multiple OH oxidation eventually lead to a group of polycarbonyl inter-mediates that exhibit high DBE/#C values. Further oxidation has likely lead to formation of small organic acids, present-ing the last organic carbon reservoir in the aqueous solution. 3.2 Kinetic study
As mentioned in the experimental section, the kinetics of LG photooxidation was investigated under atmospherically relevant conditions, using DMSO as a reference compound. Both LG and DMSO decayed rapidly as soon as photooxi-dation was initiated. Typically, with 0.5 mM H2O2in
solu-tion and over 30 min of illuminasolu-tion, LG decayed to 70 % of its starting value whereas DMSO decayed by approximately 80 % (Fig. 9a). Data were plotted in the form of Eq. (1), as illustrated in Fig. 9b for one run. Five experiments were per-formed to determinekLGII (Table 1) where the value ofkIIDMSO, 5.6×10⁹M−1s−1, was taken to be the average of literature values (4.5×10⁹to 6.9×10⁹M−1s−1(Milne et al., 1989; Bardouki et al., 2002; Zhu et al., 2003). The concentration of H2O2 was varied between 0.5 and 1.5 M, but this
varia-tion did not affect the kIILG value obtained, consistent with the assumption that the concentration of OH is not of rel-evance to the relative rate method. The reproducibility of our experiments was excellent, and we report a value of 1.08±0.16×10⁹ M−1s−1, where the uncertainty reflects
1.0
0.8
0.6
0.4
0.2
0.0
Signal Normalized to Initial Level
50 40 30 20 10 0
Illumination Time (min)
0.5
0.4
0.3
0.2
0.1
0.0
Ln([LG]
0
/[LG]
t
)
4 3
2 1
0
Ln([DMSO]0/[DMSO]t)
a)
b)
Illumination Time (min)
50 40 30 20 10 0 Levoglucosan DMSO
Figure 9.The time series of LG and DMSO during a kinetic exper-iment (Exp. #1 in Table 1) are shown in(a). The signals are normal-ized to those at the beginning of the photooxidation. The relative kinetics plot from the same experiment is shown in(b)according to Eq. 1. The color code indicates the illumination time.
pseudo first-order decay of OH radicals. Teraji and Arakaki (2010) also used an excess amount of LG, and calculatedkLGII
from the observed formation rate of a probe compound. This study is the first relative rate measurement, using direct mea-surement of LG.
The slower reaction rate observed in the current work can potentially be due to LG desorbing from the wall of the volatilization line, delaying the decay monitored by the CIMS. LG exhibits substantially lower volatility than DMSO, hence more interaction can be expected between the wall and the LG compared to DMSO. If the decay of LG has been delayed relative to DMSO due to wall desorption, the results from the relative kinetic method may be biased. In fact, the diffusion limited rate constant of LG oxidation by OH radicals in the aqueous phase is estimated by us to be 1.9×10⁹M−1s−1(see Supplement Appendix S1 for de-tailed calculations). The results from the two previous studies are closer to this estimated value, and we consider our result a lower limit of the reaction kinetics.
0.25
0.20
0.15
0.10
0.05
0.00 f44
0.05 0.04 0.03 0.02 0.01 0.00
f60
1.0
0.8
0.6
0.4
0.2
Signal Normalized to Initial Level
150 100
50 0
Illumination Time (min)
levoglucosan (CIMS)
f60 (AMS)
150 100 50 0
Illumination Time (min) Fire Plumes Non-fire Plumes The Current Work a)
b)
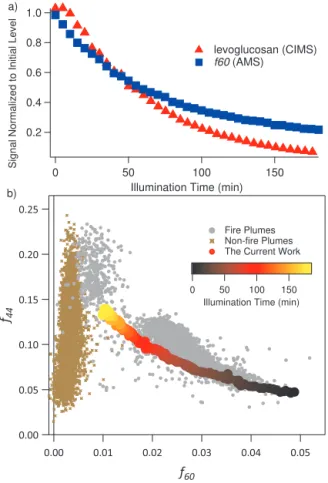
Figure 10.The decay of levoglucosan monitored by the Aerosol
ToF-CIMS and the decay off60 monitored by the AMS(a), and
thef60 vs.f40 trajectory from the current work compared to field measurements(b). The trajectory obtained in the current work is color coded with irradiation time. The compiled data (Cubison et al., 2011) from field measurements in fire plumes (grey) and non-fire plumes (brown) are also shown.
3.3 Comparison with AMS data
Decay of LG was accompanied by a decay off60 monitored by the AMS (Fig. 10a). The decay rate off60 appears slower than that of LG, perhaps due to the fact that compounds other than LG can also give rise tof60 in AMS. A simultane-ous increase inf44 was also observed, indicating formation of oxygenated compounds such as organic acids, consistent with the proposed mechanisms mentioned above. The trend of decreasingf60 and increasingf44 closely resembles that from field measurements of BB particles and heterogeneous oxidation of BB particles in the laboratory (Cubison et al., 2011; Ortega et al., 2013). Cubison et al. (2011) have demon-strated that the ratio off44 tof60 changes in a non-linear manner, approaching a background level off60 at 0.003, as the photochemical age of the BB air mass increases. Figure 10b demonstrates this trend from the compiled field data in Cubison et al. (2011). Overlayed on this plot is thef44 to
by the illumination time, which correlates nicely with field observations. This agreement is somewhat surprising given that the only reactive precursor is LG whereas BB particles in the environment contain a complex mixture of organic com-pounds. Oxidation of this complex and condensation of gas-phase organic acids could also contribute to an increase in
f44. Nevertheless, the current work indicates that aqueous-phase photooxidation can qualitatively lead to similar ob-servations as in the field, contributing to BB particle aging that arises from other mechanisms such as heterogeneous and gas-phase photooxidation.
4 Conclusions and environmental implications
This study presents the first detailed study of levoglucosan (LG) oxidation by OH radicals in the aqueous phase by on-line mass spectrometry: aerosol time-of-flight chemical ion-ization mass spectrometry (Aerosol ToF-CIMS). Being a soft ionization mass spectrometric technique, Aerosol ToF-CIMS is extremely useful in elucidating the elemental composition of the reaction products, which sheds light on fundamen-tal chemistry of aqueous-phase photooxidation. This type of analysis is difficult to perform using hard ionization mass spectrometry.
Functionalization and bond-scission reactions occurred si-multaneously in the reaction system. While bond-scission reactions contributed to formation of smaller organic com-pounds, functionalization reactions gave rise to distinct trends of “+O” and “−2H” on mass defect plots. We propose that these trends arose from formation of hydroxyl and/or hy-droperoxyl functional groups and conversion of hydroxyl to carbonyl functional groups, respectively. As a result, a com-pound with multiple hydroxyl functional groups, such as LG, can rapidly yield polycarbonyl intermediates, representing a general reaction mechanism for polyols.
The current study introduces DBE-to-carbon ratio (DBE/#C) as a novel analysis framework for high-resolution mass spectrometric data. It is particularly useful in photooxi-dation because DBE is most likely arising from formation of C=O in carbonyls and carboxylic acids. The degree of poly-carbonyl formation was observed to be extensive, leading to the average DBE/#C reaching 1 at the end of the photoox-idation. As photooxidation proceeds further, these polycar-bonyl intermediates are converted into carboxylic acids, as is inferred from a OSc-to-DBE/#C plot. This framework can
be applied to other soft ionization mass spectrometric tech-niques with high mass resolution, providing functional group information.
From the kinetic experiments, the rate constant of LG reacting with OH radical was determined to be 1.08±0.16×10⁹ M−1s−1, indicating that LG loss due to aqueous-phase photooxidation can be significant, with a sig-nificant portion of LG lost during a typical lifetime of BB particles. This loss rate should be taken into account when
LG is applied as a BB marker in chemical mass balance re-ceptor models.
Using the AMS, simultaneous decay off60 and increase inf44 were observed during LG aqueous oxidation, yielding behavior similar to that observed from field measurements. This observation qualitatively indicates that aqueous-phase photooxidation may be partially contributing to the observed decay of LG in the field and observed aging of BB particles.
The Supplement related to this article is available online at doi:10.5194/acp-14-9695-2014-supplement.
Acknowledgements. The authors thank NSERC for funding, J. L. Jimenez for offering the field data, Aerodyne Inc. for technical support, and CFI for funding the purchase of the CIMS.
Edited by: H. Su
References
Aljawhary, D., Lee, A. K. Y., and Abbatt, J. P. D.: High-resolution chemical ionization mass spectrometry (ToF-CIMS): application to study SOA composition and processing., Atmos. Mea. Tech-nol., 6, 3211–3224, 2013.
Allan, J., Delia, A., Coe, H., Bower, K., Alfarra, M., Jimenez, J., Middlebrook, A., Drewnick, F., Onasch, T., Canagaratna, M., Jayne, J., and Worsnop, D.: A generalised method for the extrac-tion of chemically resolved mass spectra from aerodyne aerosol mass spectrometer data, J. Aerosol Sci., 35, 909–922, 2004. Bai, J., Sun, X., Zhang, C., Xu, Y., and Qi, C.: The OH-initiated
atmospheric reaction mechanism and kinetics for levoglucosan emitted in biomass burning, Chemosphere, 93, 2004–2010, 2013. Bardouki, H., Rosa, M. B. D., Mihalopoulos, N., Palm, W.-U., and Zetzsch, C.: Kinetics and mechanism of the oxidation of
dimethylsulfoxide (DMSO) and methanesulfinate (MSI−) by
OH radicals in aqueous medium, Atmos. Environ., 36, 4627– 4634, 2002.
Bateman, A. P., Nizkorodov, S. A., Laskin, J., and Laskin, A.: Photolytic processing of secondary organic aerosols dissolved in cloud droplets, Phys. Chem. Chem. Phys., 13, 12199–12212, 2011.
Bertram, T., Kimmel, J., Crisp, T., Ryder, O., Yatavelli, R., Thorn-ton, J., Cubison, M., Gonin, M., and Worsnop, D.: A field-deployable, chemical ionization time-of-flight mass spectrome-ter, Atmos. Mea. Technol., 4, 1471–1479, 2011.
Blando, J. D. and Turpin, B. J.: Secondary organic aerosol forma-tion in cloud and fog droplets: a literature evaluaforma-tion of plausi-bility, Atmos. Environ., 34, 1623–1632, 2000.
ambient aerosols with the aerodyne aerosol mass spectrometer, Mass Spectrom. Rev., 26, 185–222, 2007.
Cubison, M. J., Ortega, A. M., Hayes, P. L., Farmer, D. K., Day, D., Lechner, M. J., Brune, W. H., Apel, E., Diskin, G. S., Fisher, J. A., Fuelberg, H. E., Hecobian, A., Knapp, D. J., Mikoviny, T., Riemer, D., Sachse, G. W., Sessions, W., We-ber, R. J., Weinheimer, A. J., Wisthaler, A., and Jimenez, J. L.: Effects of aging on organic aerosol from open biomass burning smoke in aircraft and laboratory studies, Atmos. Chem. Phys., 11, 12049–12064, doi:10.5194/acp-11-12049-2011, 2011. Ervens, B., Turpin, B. J., and Weber, R. J.: Secondary
or-ganic aerosol formation in cloud droplets and aqueous parti-cles (aqSOA): a review of laboratory, field and model stud-ies, Atmos. Chem. Phys., 11, 11069–11102, doi:10.5194/acp-11-11069-2011, 2011.
Fraser, M. and Lakshmanan, K.: Using levoglucosan as a molecu-lar marker for the long-range transport of biomass combustion aerosols, Environ. Sci. Technol., 34, 4560–4564, 2000.
Grieshop, A. P., Donahue, N. M., and Robinson, A. L.: Laboratory investigation of photochemical oxidation of organic aerosol from wood fires 2: analysis of aerosol mass spectrometer data, At-mos. Chem. Phys., 9, 2227–2240, doi:10.5194/acp-9-2227-2009, 2009.
Hearn, J. D. and Smith, G. D.: A chemical ionization mass spec-trometry method for the online analysis of organic aerosols, Anal. Chem., 76, 2820–2826, 2004.
Hennigan, C. J., Sullivan, A. P., Collett, J. L., and Robinson, A. L.: Levoglucosan stability in biomass burning particles ex-posed to hydroxyl radicals, Geophys. Res. Lett., 37, L09806, doi:10.1029/2010GL043088, 2010.
Hoffmann, T., Bandur, R., Marggraf, U., and Linscheid, M.: Molecular composition of organic aerosols formed in the
α-pinene/O3 reaction: Implications for new particle
forma-tion processes, J. Geophys. Res. Atmos., 103, 25569–25578, doi:10.1029/98JD01816, 1998.
Hoffmann, D., Tilgner, A., Iinuma, Y., and Herrmann, H.: Atmo-spheric stability of levoglucosan: a detailed laboratory and mod-eling study, Environ. Sci. Technol., 44, 694–699, 2010. Holmes, B. J. and Petrucci, G. A.: Water-soluble oligomer
forma-tion from acid-catalyzed reacforma-tions of levoglucosan in proxies of atmospheric aqueous aerosols, Environ. Sci. Technol., 40, 4983– 4989, 2006.
Holmes, B. J. and Petrucci, G. A.: Oligomerization of levoglucosan by Fenton chemistry in proxies of biomass burning aerosols, J. Atmos. Chem., 58, 151–166, 2007.
Hughey, C. A., Hendrickson, C. L., Rodgers, R. P., Marshall, A. G., and Qian, K.: Kendrick mass defect spectrum: A compact visual analysis for ultrahigh-resolution broadband mass spectra, Anal. Chem., 73, 4676–4681, 2001.
Jacob, D.: Chemistry of OH in remote clouds and its role in the production of formic-acid peroxymonosulfate, J. Geophys. Res. Atmos., 91, 9807–9826, 1986.
Jimenez, J. L., Canagaratna, M. R., Donahue, N. M., Prevot, A. S. H., Zhang, Q., Kroll, J. H., DeCarlo, P. F., Allan, J. D., Coe, H., Ng, N. L., Aiken, A. C., Docherty, K. S., Ulbrich, I. M., Grieshop, A. P., Robinson, A. L., Duplissy, J., Smith, J. D., Wil-son, K. R., Lanz, V. A., Hueglin, C., Sun, Y. L., Tian, J., Laakso-nen, A., RaatikaiLaakso-nen, T., RautiaiLaakso-nen, J., Vaattovaara, P., Ehn, M., Kulmala, M., Tomlinson, J. M., Collins, D. R., Cubison, M. J.,
Dunlea, E. J., Huffman, J. A., Onasch, T. B., Alfarra, M. R., Williams, P. I., Bower, K., Kondo, Y., Schneider, J., Drewnick, F., Borrmann, S., Weimer, S., Demerjian, K., Salcedo, D., Cot-trell, L., Griffin, R., Takami, A., Miyoshi, T., Hatakeyama, S., Shimono, A., Sun, J. Y., Zhang, Y. M., Dzepina, K., Kimmel, J. R., Sueper, D., Jayne, J. T., Herndon, S. C., Trimborn, A. M., Williams, L. R., Wood, E. C., Middlebrook, A. M., Kolb, C. E., Baltensperger, U., and Worsnop, D. R.: Evolution of Organic Aerosols in the Atmosphere, Science, 326, 1525–1529, 2009. Kessler, S. H., Smith, J. D., Che, D. L., Worsnop, D. R., Wilson,
K. R., and Kroll, J. H.: Chemical sinks of organic aerosol: Kinet-ics and products of the heterogeneous oxidation of erythritol and levoglucosan, Environ. Sci. Technol., 44, 7005–7010, 2010. Knopf, D. A., Forrester, S. M., and Slade, J. H.: Heterogeneous
ox-idation kinetics of organic biomass burning aerosol surrogates by O3, NO2, N2O5, and NO3, Phys. Chem. Chem. Phys., 13,
21050–21062, 2011.
Kroll, J. H., Donahue, N. M., Jimenez, J. L., Kessler, S. H., Cana-garatna, M. R., Wilson, K. R., Altieri, K. E., Mazzoleni, L. R., Wozniak, A. S., Bluhm, H., Mysak, E. R., Smith, J. D., Kolb, C. E., and Worsnop, D. R.: Carbon oxidation state as a metric for describing the chemistry of atmospheric organic aerosol, Nat. Chem., 3, 133–139, 2011.
Lee, A. K. Y., Zhao, R., Gao, S. S., and Abbatt, J. P. D.: Aqueous-phase OH oxidation of glyoxal: application of a novel analytical approach employing aerosol mass spectrometry and complemen-tary off-line techniques, J. Phys. Chem. A, 115, 10517–10526, 2011.
Lee, A. K. Y., Hayden, K. L., Herckes, P., Leaitch, W. R., Lig-gio, J., Macdonald, A. M., and Abbatt, J. P. D.: Characteri-zation of aerosol and cloud water at a mountain site during WACS 2010: secondary organic aerosol formation through ox-idative cloud processing, Atmos. Chem. Phys., 12, 7103–7116, doi:10.5194/acp-12-7103-2012, 2012.
Lee, B. H., Lopez-Hilfiker, F., Mohr, C., Kurtén, T. C., Worsnop, D., and Thornton, J. A.: An Iodide-Adduct High-Resolution Time-of-Flight Chemical-Ionization Mass Spectrometer: Application to Atmospheric Inorganic and Organic Compounds, Environ. Sci. Technol., 48, 6309–6317, 2014.
Lim, Y. B., Tan, Y., Perri, M. J., Seitzinger, S. P., and Turpin, B. J.: Aqueous chemistry and its role in secondary organic aerosol (SOA) formation, Atmos. Chem. Phys., 10, 10521–10539, doi:10.5194/acp-10-10521-2010, 2010.
May, A. A., Saleh, R., Hennigan, C. J., Donahue, N. M., and Robin-son, A. L.: Volatility of organic molecular markers used for source apportionment analysis: measurements and implications for atmospheric lifetime, Environ. Sci. Technol., 46, 12435– 12444, 2012.
Milne, P. J., Zika, R. G., and Saltzman, E. S.: Biogenic Sulfur in the Environment, American Chemical Society, Washington, DC, American Chemical Society, Washington DC, 1989.
Mochida, M., Kawamura, K., Fu, P., and Takemura, T.: Seasonal variation of levoglucosan in aerosols over the western North Pa-cific and its assessment as a biomass-burning tracer, Atmos. En-viron., 44, 3511–3518, 2010.
FLAME-3, Atmos. Chem. Phys., 1FLAME-3, 11551–11571, doi:10.5194/acp-13-11551-2013, 2013.
Petters, M. D. and Kreidenweis, S. M.: A single parameter repre-sentation of hygroscopic growth and cloud condensation nucleus activity, Atmos. Chem. Phys., 7, 1961–1971, doi:10.5194/acp-7-1961-2007, 2007.
Petters, M. D., Carrico, C. M., Kreidenweis, S. M., Prenni, A. J., DeMott, P. J., Collett, J. L., and Moosmuller, H.: Cloud conden-sation nucleation activity of biomass burning aerosol, J. Geo-phys. Res. Atmos., 114, D22205, doi:10.1029/2009JD012353, 2009.
Robinson, A. L., Subramanian, R., Donahue, N. M., Bernardo-Bricker, A., and Rogge, W. F.: Source apportionment of molecu-lar markers and organic aerosol. 2. Biomass smoke, Environ. Sci. Technol., 40, 7811–7819, 2006.
Saarikoski, S., Timonen, H., Saarnio, K., Aurela, M., Järvi, L., Keronen, P., Kerminen, V.-M., and Hillamo, R.: Sources of or-ganic carbon in fine particulate matter in northern European ur-ban air, Atmos. Chem. Phys., 8, 6281–6295, doi:10.5194/acp-8-6281-2008, 2008.
Sareen, N., Schwier, A. N., Shapiro, E. L., Mitroo, D., and Mc-Neill, V. F.: Secondary organic material formed by methylglyoxal in aqueous aerosol mimics, Atmos. Chem. Phys., 10, 997–1016, doi:10.5194/acp-10-997-2010, 2010.
Schauer, J., Rogge, W., Hildemann, L., Mazurek, M., Cass, G., and Simoneit, B.: Source apportionment of airborne particulate mat-ter using organic compounds as tracers, Atmos. Environ., 30, 3837–3855, 1996.
Schuchmann, M. N. and von Sonntag, C.: The rapid hydration of the acetyl radical – A pulse radiolosys study of acetaldehyde in aqueous-solution, J. Am. Chem. Soc., 110, 5698–5701, 1988. Simoneit, B. R. T.: Biomass burning - A review of organic
trac-ers for smoke from incomplete combustion, Appl. Geochem., 17, 129–162, 2002.
Simoneit, B. R. T., Schauer, J. J., Nolte, C. G., Oros, D. R., Elias, V. O., Fraser, M. P., Rogge, W. F., and Cass, G. R.: Levoglu-cosan, a tracer for cellulose in biomass burning and atmospheric particles, Atmos. Environ., 33, 173–182, 1999.
Simoneit, B. R. T., Elias, V. O., Kobayashi, M., Kawamura, K., Rushdi, A. I., Medeiros, P. M., Rogge, W. F., and Didyk, B. M.: Sugars - Dominant water-soluble organic compounds in soils and characterization as tracers in atmospheric particulate matter, En-viron. Sci. Technol., 38, 5939–5949, 2004.
Teraji, T. and Arakaki, T.: Bimolecular rate constants between lev-oglucosan and hydroxyl radical: effects of pH and temperature, Chem. Lett., 39, 900–901, 2010.
von Sonntag, C., Dowideit, P., Fang, X., Mertens, R., Pan, X., Schuchmann, M. N., and Schuchmann, H.-P.: The fate of per-oxyl radicals in aqueous solution, Water Sci. Technol., 35, 9–15, 1997.
Zhang, X., Hecobian, A., Zheng, M., Frank, N. H., and Weber, R. J.: Biomass burning impact on PM2.5over the southeastern US
dur-ing 2007: integratdur-ing chemically speciated FRM filter measure-ments, MODIS fire counts and PMF analysis, Atmos. Chem. Phys., 10, 6839–6853, doi:10.5194/acp-10-6839-2010, 2010. Zhao, R., Lee, A. K. Y., and Abbatt, J. P. D.: Investigation of
Aqueous-Phase Photooxidation of Glyoxal and Methylglyoxal by Aerosol Chemical Ionization Mass Spectrometry: Observa-tion of Hydroxyhydroperoxide FormaObserva-tion, J. Phys. Chem. A, 116, 6253–6263, 2012.