Advances in Mechanical Engineering 2015, Vol. 7(6) 1–9
ÓThe Author(s) 2015 DOI: 10.1177/1687814015584252 aime.sagepub.com
Layout design optimization of dynamic
environment flexible manufacturing
systems
Jaber Abu Qudeiri
1, Usama Umer
1, Fayiz Abu Khadra
2, HMA Hussein
1,3,
Abdulrahman Al-Ahmari
4, Saied Darwish
4and MH Abidi
1Abstract
The proper positioning of machine tools in flexible manufacturing system is one of the factors that lead to increase in production efficiency. Choosing the optimum position of machine tools curtails the total part handling cost between machine tools within the flexible manufacturing system. In this article, a two-stage approach is presented to investigate the best locations of the machine tools in flexible manufacturing system. The location of each machine tool is selected from the available specific and fixed locations in such a way that it will result in best throughput of the flexible manufac-turing system. In the first stage of the two-stage approach, the throughput of randomly selected locations of the machine tool in flexible manufacturing system is computed by proposing a production simulation system. The production simula-tion system utilizes genetic algorithms to find the locasimula-tions of the machine tools in flexible manufacturing system that achieve the maximum throughput of the flexible manufacturing system. In the second stage, the generated locations are fed into artificial neural network to find a relation between a machine tool’s location and the throughput that can be used to predict the throughput for any other set of locations. Artificial neural network will result in mitigating the com-putational time.
Keywords
Flexible manufacturing system, layout design, genetic algorithm, artificial neural network
Date received: 4 September 2014; accepted: 26 February 2015
Academic Editor: Jiin Y Jang
Introduction
Flexible manufacturing system (FMS) layout has an impact on material handling. The cost of material han-dling can be reduced by at least 10%–30% if an effi-cient layout is considered. This reduction is important and has a significant impact because of the fact that the cost of material handling ranges between 15% and 70% of the total production cost.1The variation in the percentage is based on the type of production system. Thus, the layout of machine tools in the FMS can be considered as an imperative factor, which can reduce the production cost by a significant amount. The layout of machine tools problem is NP-complete problem.2
Various techniques and methods were used to solve the FMS layout problem such as simulated annealing,2–4
1FARCAMT, Advanced Manufacturing Institute, King Saud University,
Riyadh, Saudi Arabia
2Mechanical Engineering Department, King Abdulaziz University, Rabigh,
Saudi Arabia
3Department of Mechanical Engineering, Helwan University, Cairo, Egypt 4Industrial Engineering Department, King Saud University, Riyadh, Saudi
Arabia
Corresponding author:
Jaber Abu Qudeiri, FARCAMT, Advanced Manufacturing Institute, King Saud University, Riyadh 11421, Saudi Arabia.
Email: [email protected]
ant colony optimization,5,6genetic algorithms (GAs),7–9 fuzzy heuristic approach,10,11 dynamic programming,12 tabu algorithm,13linear programming,14and many other methods and techniques can be found in the review and survey researches such as the studies by Drira et al.,15 Moslemipour et al.,16and Shirazi et al.17
On the other hand, many studies solved the layout problem in restricted plant, for example, Lee and Kim18 considered a rectangular shape department and modi-fied the shapes of departments in a given block layout. Other studies considered single flow line, such as Yang et al.19 considered departments with fixed shapes and pick-up/drop-off points with single-loop-directed flow path,20 described a constructive heuristic to solve the single-row facility layout problem,21introduced a heur-istic procedure to study the single-row facility layout problem, and also, Braglia7 used a GA to optimize simulated-annealing-based heuristic for single-row lay-out problem.
Irregular-shaped machines were also considered in other studies, for example, Yamamoto and Qudeiri22 proposed concurrent engineering system to find the lay-out design of flexible transfer line components, and also, Bock and Hoberg23 introduced a layout for irregular-shaped machines with transportation path. On the other hand, fixed shapes and input and output points have been considered to find the layout, such as Kim and Kim24focused on the facility that has prede-termined shape and input and output points, and also, Qudeiri and Yamamoto25introduced a one-by-one lay-out procedure to find the efficient laylay-out for produc-tion line components between a fixed start point and end point of the production line. Other research has focused on the dynamic case, for example, Conway and Venkataramanan26introduced genetic search technique to solve dynamic facility layout problem. Also, McKendall and Hakobyan27 considered unequal area departments and used heuristics to solve dynamic facil-ity layout problem. Furthermore, a heuristic procedure for the quadratic assignment formulation of the facility layout problem with single/multiple objectives was pre-sented,10and also, a combination of GA and simulated annealing was proposed for linear ordering of the machine tools to find the minimum of the total back-tracking.7,8 Some studies map the area to the rectangular-shaped elements.28Many heuristic methods and approaches were developed to solve the layout problem and to find the best possible location of FMS components.9,25,29
However, despite many publications for FMS machine tools layout, further augmentation is still required. Some studies considered machine tools as equal blocks, and others neglected the details between the machine tools. Moreover, most of the literature has no exact target points of the possible locations of the machine tools.
This research work considered specific and fixed locations for the machine tools and searched for the best location of each machine tool among these loca-tions that will result in best throughput of the FMS. To locate the FMS machine tools in the proper locations, a two-stage approach (TSA) is proposed. In the first stage of TSA, the throughput of randomly selected locations of the FMS machine tool for different layouts is found by a proposed production simulation system (PSS). GA is combined with the PSS to search for the optimal locations of all machine tools in FMS. Many groups of locations are generated for different locations of machine tools. The generated sets of locations and their corresponding throughput are then fed into artifi-cial neural network (ANN) to find a relation between a machine tool’s location and the throughput. This rela-tion can be used to predict the throughput of unseen locations of machine tools. The notations used in this article are listed in Appendix 1.
FMS model
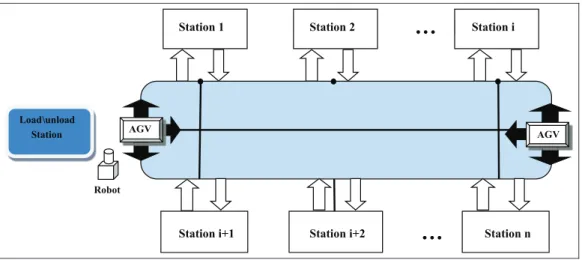
The FMS in our model consists of n machine tools (M1,M2,., Mn); each of these machine tools will be
located in one of the stations (S1,S2,.,Sn) as shown
in Figure 1.
The assumptions to define the FMS of this research are summarized in the following points:
1. The products enter and leave the production system through load/unload station.
2. The times including processing setup, loading, uploading, and so on for all parts are defined and well known.
3. The machine tool can perform one operation at a time.
4. Tool changing time is included in the processing time.
5. Once the operation is started, it cannot be divided.
6. The machine tool stops after producing specific number of parts to check the quality.
Problem formulation
Given:
Product type route for a set of part types R= (R1,
R2, ., Rl); a set of machine tools M= (M1, M2, .,
Mn) that will be located in a set of stationsS= (S1,S2,
., Sn); and a number of part types, where each type
requiresOpoperations, and each operation,Oij, can be processed in any machine toolMi,Mi2M.
Optimize and predict the location of:
Mi,Mi2M, in stationSi,Si2S
So that,
TH (R1,R2,.,Rl) is maximum.
Methodology
TSA finds the best locations of machine tools by utiliz-ing two stages. The first stage is the optimization stage and the second stage is the prediction stage. The flow chart of TSA is given in Figure 2.
Stage 1: optimization stage
In this stage, the FMS is evaluated at randomly selected locations for a set of machine tools. The PSS determi-nistic discrete event production simulation model is developed using a MATLAB 7.0 editor. The PSS simu-lates many production hours and finds the throughput of the FMS based on the locations of the machine tools in FMS. The throughput of the FMS can be calculated. To find the throughput in a given time, the total time,
Tp, that any part pspends to travel through the route
Rp, can be calculated using equation (1)
Tp=Tl=u+TT(Ri) +
XOp
j=1,k2Rp
Ppjk+ X
Op
j=1,k2Rp
Spjk
+ X
Op
j=1,k2Rp
Wpjk ð1Þ
AGV Load\unload
Station
Robot
…
Station iStation 2 Station 1
Station n Station i+2
Station i+1
AGV
…
Figure 1. FMS model.
Y
Generate randomly group of locations of all machine tools
Build a production simulation system
Select genetic operation probabilistically
Select two individuals based in fitness
Select one individual based in fitness
Perform crossover Perform Mutation
Copy the offspring to the next population
Sent to the next population No
Evaluate fitness of the generated group
Are the generated groups become GA population?
Iteration =0
Iteration =Iteration+1
Build an ANN model, train and validate with the simulation results
Apply ANN to generate new population (groups of locations)
Is the fitness become constant? No
Y
The PSS is combined with GA to search the best sets of locations among the many evaluated sets of loca-tions. The GA-based simulation runs until the fitness (throughput) of the FMS reaches its maximum value. The set of locations of machine tools that achieves the maximum fitness is considered as the optimal location.
Next, the above procedure is repeated with new loca-tions of all machine tools and another optimal solution is generated; this procedure is repeated until the data required to train the ANN are generated.
The algorithm of this stage is carried out using the following steps.
Algorithm 1: PSS.
Step 1. Generate P(0): IND(i) Random (S1,
S2,. . .,Sn), 8i=1!ND
Step 2. FindF(i) 8i=1,2,. . .,NI
Step 3. GenerateNcindividuals based onCr.
Step 4. GenerateNmindividuals based onMr.
Step 5. Select Ns individuals based on an elitist strategy.
Step 6. Repeat steps 2–5.
Step 7. Repeat step 6 to reach the optimal fitness value and set the individual of this fitness as the optimal lay-out design.
Step 8. Generate new locations, and repeat steps 1–7.
Step 9. Repeat step 8 to generate training examples required to learn the ANN.
Stage 2: prediction stage
To reduce the computational time that is needed when using simulation, ANN approach is proposed. ANN can learn a relationship between the input (locations of machine tools in our case) and the output (throughput). ANN is trained and introduced to predict the locations of the machine tools of FMS. The algorithm of this stage is carried out using the following steps.
Algorithm 2: ANN procedure.
Step 1. Build the ANN.
Step 2. Train the ANN with some of the groups of loca-tions generated by PSS.
Step 3. Use the rest of the PSS results to validate the ANN.
Step 4. Apply the trained ANN to predict the locations of machine tools.
GA for locations of machine tools in FMS
GA has been successfully utilized in diverse optimiza-tion problems to search the best soluoptimiza-tions. GA starts with an initial randomly selected population. The popu-lation consists of a set of solution called individual. Each solution in the population is encoded, and all
solutions are evaluated to measure their fitness. Each element of the individual is called gene. GA has many operations such as crossover and mutation to create the next population of new individuals. The iteration will be continued to reach the solution that achieves the maximum fitness value. The solution of the maximum fitness value is considered as the optimal solution.
Encoding
To express the individual, each machine tool location is represented by one gene. For example, the first gene represents the machine tool that will be located in the first station . Thus, the individual can be defined as given below
Individual(i) = (G1,G2,. . .,Gi,. . .,GN)
In this optimization problem, the size of the individ-uals is not limited, which means that FMS with any number of machine tools can be dealt with.
Crossover
In this article, the greedy crossover method30is applied because each machine tool should not appear more than one time in each individual. In this crossover method, the first gene of each offspring is selected ran-domly; then, the other genes leaving the first gene in the two individuals are compared and the gene that requires less time to reach from the first gene will be selected and encoded; if any of the leaving genes has already appeared in the individual, the other gene will be selected. The greedy crossover operation is illu-strated in Figure 3.
Mutation
The GA mutation is applied by swapping the values of two genes in a given individual. Figure 4 shows the mutation operation.
4 2 5 3 1 6 1 5 2 6 3 4
Individual 1 Individual 2
Before crossover
Step 1 4 - - - 3 - - -
-Step 2 4 2 - - - - 3 6 - -
-Step 3 4 2 6 - - - 3 6 1 -
-Step 4 4 2 6 3 - - 3 6 1 4
-Step 5 4 2 6 3 1 - 3 6 1 4 5
-Step 6 4 2 6 3 1 5 3 6 1 4 5 2
After crossover
Application example
To demonstrate the efficacy of the proposed approach, the following simulation examples are accomplished. In each simulation, the production system is simulated for long production hours to produce a specific number of products. The number of machine tools, variety of products, the production ratio, and the route of each part type are given in each simulation. The algorithm described in stage 1 of the ‘‘Methodology’’ section is applied to find the locations of the machine tools that achieve the best efficiency of the FMS. The GA is uti-lized to search the FMS layout design (locations of machine tools). The GA in this example has the follow-ing characteristics: the population size is 100. The cross-over and mutation rates are 0.8 and 0.05, respectively. And 15% of the individuals of the next populations are selected based on an elitist strategy.
Simulation conditions
Simulation 1: FMS with six machines. In this simulation, the FMS with six workstations is considered. Six machine tools are available and will be located through the workstations, one machine tool in each station. The FMS has the capability of producing five different types of products with the following production ratios: P1:P2:P3:P4:P5 = 8:6:4:3:1. Each of the five types requires six operations. The processing times and the setup times for each part on each machine tool are ran-domly selected between 5 and 10 min and between 1 and 4 min, respectively.
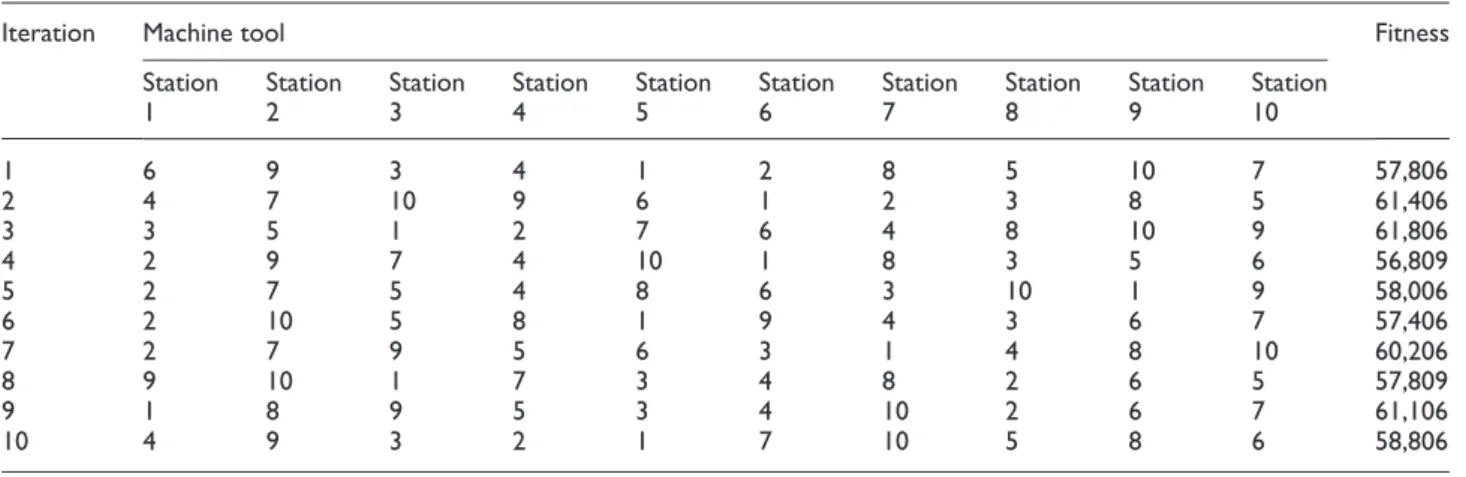
Simulation 2: FMS with 10 machines. In Simulation 2, 10 machine tools will be located through the well-defined workstations. The FMS will be used to produce 10 dif-ferent product types. Each of these products required eight operations. The production ratio is given by P1:P2:P3:P4:P5:P6:P7:P8:P9:P10 = 40:20:80:50:40:30: 70:12:15:5. The other conditions of this simulation are similar to Simulation 1.
In this research, all simulation examples used the same GA parameters to control the evaluation process. The following GA parameters were selected: The popu-lation size is 100; crossover and mutation rates are 0.9 and 0.05, respectively. These parameters were decided based on the experience and after several trial and error methods. Next, after finding the optimal solution for the machine tools’ locations problem, the Neural Network Toolbox in MATLAB 7.0 is used to build the prediction model. The input layer consists of 6 and 10 neurons for Examples 1 and 2, respectively. By trial and error, the number of neurons in the hidden layer for the two examples is selected and used which mini-mized the training error. The output layer consists of one neuron (FMS fitness) with a learning rate of 0.9. A total of 100 sets of results were obtained from PSS as the training group and 15 sets as the testing group.
Results and discussions
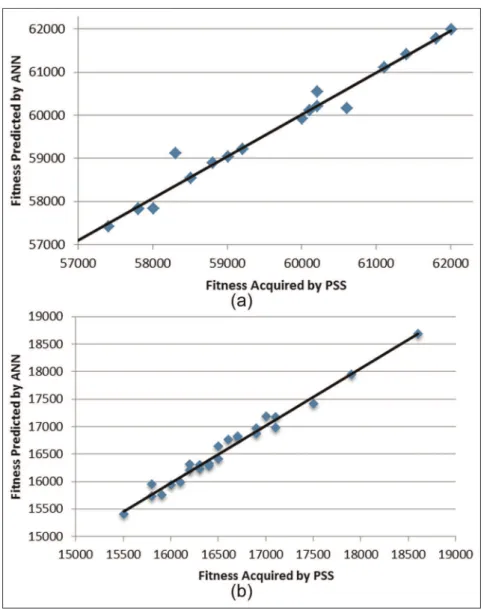
Based on the PSS results, the locations of machine tools are found. Tables 1 and 2 show some individuals acquired in the two simulations and their correspond-ing fitness. The comparison between some solutions of the layout problem and its corresponding fitness for ANN approach and PSS resulted in the two examples given in Tables 3 and 4. The regression analyses of out-puts from the PSS and ANN approach for the two simulation examples are shown in Figure 5(a) and (b). The locations of the machine tools through the Table 1. Some locations and their corresponding fitness acquired by PSS in Example 1.
Iteration Machine tool Fitness
Station 1 Station 2 Station 3 Station 4 Station 5 Station 6
1 4 2 1 5 6 3 15,506
2 2 5 6 1 4 3 17,606
3 2 3 4 6 1 5 16,806
4 6 4 3 1 5 2 16,706
5 3 2 4 1 6 5 15,906
6 4 3 5 2 6 1 15,106
7 2 5 3 4 6 1 18,606
8 2 1 3 6 5 4 15,806
9 1 5 4 6 2 3 16,606
10 3 2 1 5 6 4 16,306
PSS: production simulation system.
4 2 5 3 1 6 4 1 5 3 2 6
Swap locations
workstations achieve the best fitness optimized by the two simulations given in Table 5.
Based on the presented results, the maximum fitness values corresponding to the two simulations are 1.4706E4 and 5.6006E4, respectively.
The results show that the ANN results are close to the PSS results, and the errors between the two
Table 2. Some locations and their corresponding fitness acquired by PSS in Example 2.
Iteration Machine tool Fitness
Station 1
Station 2
Station 3
Station 4
Station 5
Station 6
Station 7
Station 8
Station 9
Station 10
1 6 9 3 4 1 2 8 5 10 7 57,806
2 4 7 10 9 6 1 2 3 8 5 61,406
3 3 5 1 2 7 6 4 8 10 9 61,806
4 2 9 7 4 10 1 8 3 5 6 56,809
5 2 7 5 4 8 6 3 10 1 9 58,006
6 2 10 5 8 1 9 4 3 6 7 57,406
7 2 7 9 5 6 3 1 4 8 10 60,206
8 9 10 1 7 3 4 8 2 6 5 57,809
9 1 8 9 5 3 4 10 2 6 7 61,106
10 4 9 3 2 1 7 10 5 8 6 58,806
PSS: production simulation system.
Table 3. Comparison of some fitness predicted by ANN and those obtained from PSS for Simulation 1.
Machines located in stations (S1,S2,.,S6) Fitness % Error
PSS ANN
4 2 1 5 6 3 1.55E+04 1.578E+04 1.830
2 5 6 1 4 3 1.67E+04 1.682E+04 0.728
3 2 4 1 6 5 1.59E+04 1.619E+04 1.853
2 5 3 4 6 1 1.86E+04 1.868E+04 0.429
6 2 3 4 5 1 1.61E+04 1.592E+04 1.133
6 1 4 5 3 2 1.71E+04 1.717E+04 0.424
2 6 4 3 1 5 1.79E+04 1.794E+04 0.241
4 1 2 3 6 5 1.68E+04 1.656E+04 1.440
4 5 2 6 3 1 1.58E+04 1.551E+04 1.867
6 4 1 5 2 3 1.75E+04 1.741E+04 0.492
ANN: artificial neural network; PSS: production simulation system.
Table 4. Comparison of some fitness predicted by ANN and those obtained from PSS for Simulation 2.
Machines located in stations (S1,S2,.,S
n) Fitness % Error
PSS ANN
1 3 4 8 9 5 6 7 10 2 6.00E+04 5.99E+04 0.15
9 6 4 3 5 2 10 7 8 1 6.06E+04 6.02E+04 0.72
8 3 1 7 5 6 2 4 9 10 6.01E+04 6.01E+04 0.02
3 4 2 8 10 7 1 5 9 6 5.83E+04 5.91E+04 1.39
2 7 5 4 8 6 3 10 1 9 5.80E+04 5.78E+04 0.28
2 10 5 8 1 9 4 3 6 7 5.74E+04 5.74E+04 0.03
5 10 7 3 8 4 6 1 2 9 6.20E+04 6.20E+04 0.01
9 10 1 7 3 4 8 2 6 5 5.78E+04 5.78E+04 0.05
1 8 9 5 3 4 10 2 6 7 6.11E+04 6.11E+04 0.01
4 9 3 2 1 7 10 5 8 6 5.88E+04 5.89E+04 0.14
ANN: artificial neural network; PSS: production simulation system.
Table 5. The layout achieves the best fitness for the two simulations.
Simulation Machines located in stations (S1,S2,.,Sn)
Fitness
1 4, 2, 3, 1, 5, 6 14,706
approaches in the two simulation examples are rela-tively small as shown in Tables 3 and 4. The results of this research can be used to improve the production plan, and production engineers can utilize these results when making decisions regarding the layout design; furthermore, it can be applied to evaluate the working production line layout.
Conclusion
In this article, TSA for FMS optimal layout design is presented. TSA utilized a PSS to evaluate a set of machine tools’ location groups and to find a corre-sponding fitness for each group. The PSS is combined with GA to find the group of locations that achieves the maximum throughput. Unique genetic operations were applied for the efficient use of GA. Finally, the generated location groups and their fitness were used to train ANN. The well-trained ANN was then used
instead of simulation system to evaluate the layout design. Through this method, a long simulation run time required by the simulation can be eliminated. Numerical simulations for different production cases showed that the results of the simulation and the trained ANN approach are close to each other, and prediction approach can be used efficiently instead of using the simulation each time.
The results of this research can be used to improve the production engineers’ decisions regarding the lay-out design. In addition, they can apply the proposed methodology to evaluate the working production line layout. Future work includes carrying out validation experiments by modeling the real systems and compar-ing the results with simulation modelcompar-ing.
Declaration of conflicting interests
Funding
This project was financially supported by King Saud University, Vice Deanship of Research Chairs.
References
1. Tompkins JA and White JA. Facilities planning. New York: Wiley, 1984.
2. Suresh G and Sahu S. Multiobjective facility layout using simulated annealing.Int J Prod Econ1993; 32: 239–254. 3. Heragu SS and Alfa AS. Experimental analysis of
simu-lated annealing based algorithms for the layout problem. Eur J Oper Res1992; 57: 190–202.
4. Sxahin R. A simulated annealing algorithm for solving the bi-objective facility layout problem. Expert Syst Appl 2011; 38: 4460–4465.
5. Solimanpur M, Vrat P and Shankar R. An ant algorithm for the single-row layout problem in flexible manufactur-ing systems.Comput Oper Res2005; 32: 583–598. 6. Hani Y, Amodeo L, Yalaoui F, et al. Ant colony
optimi-zation for solving an industrial layout problem. Eur J Oper Res2007; 183: 633–642.
7. Braglia M. Optimisation of a simulated-annealing-based heuristic for single-row machine layout problem by genetic algorithm.Int Trans Oper Res1996; 3: 37–49. 8. Ku M-Y, Hu MH and Wang M-J. Simulated annealing
based parallel genetic algorithm for facility layout prob-lem.Int J Prod Res2010; 49: 1801–1812.
9. Yamamoto H, Qudeiri JA and Jamali MA. Concurrent Production Engineering System for buffer size and flex-ible transfer line layout design.J Syst Sci Syst Eng2008; 17: 187–203.
10. Raoot AD and Rakshit A. A ‘‘fuzzy’’ heuristic for the quadratic assignment formulation to the facility layout problem.Int J Prod Res1994; 32: 563–581.
11. Deb SK and Bhattacharyya B. Fuzzy decision support system for manufacturing facilities layout planning.Decis Support Syst2005; 40: 305–314.
12. Dunker T, Radons G and Westka¨mper E. Combining evolutionary computation and dynamic programming for solving a dynamic facility layout problem. Eur J Oper Res2005; 165: 55–69.
13. Samarghandi H and Eshghi K. An efficient tabu algo-rithm for the single-row facility layout problem. Eur J Oper Res2010; 205: 98–105.
14. Amaral ARS. A new lower bound for the single-row facility layout problem. Discrete Appl Math 2009; 157: 183–190.
15. Drira A, Pierreval H and Hajri-Gabouj S. Facility layout problems: a survey.Annu Rev Contr2007; 31: 255–267. 16. Moslemipour G, Lee T and Rilling D. A review of
intelli-gent approaches for designing dynamic and robust lay-outs in flexible manufacturing systems.Int J Adv Manuf Technol2012; 60: 11–27.
17. Shirazi H, Kia R, Javadian N, et al. An archived multi-objective simulated annealing for a dynamic cellular man-ufacturing system.J Ind Eng Int2014; 10: 1–17.
18. Lee G-C and Kim Y-D. Algorithms for adjusting shapes of departments in block layouts on the grid-based plane. Omega2000; 28: 111–122.
19. Yang T, Peters BA and Tu M. Layout design for flexible manufacturing systems considering single-loop direc-tional flow patterns.Eur J Oper Res2005; 164: 440–455. 20. Ravi Kumar K, Hadjinicola GC and Lin T-L. A heuristic
procedure for the single-row facility layout problem.Eur J Oper Res1995; 87: 65–73.
21. Djellab H and Gourgand M. A new heuristic procedure for the single-row facility layout problem.Int J Comput Integr Manuf Technol2001; 14: 270–280.
22. Yamamoto H and Qudeiri JA. A concurrent engineering system to integrate a production simulation and CAD system for FTL layout design.Int J Prod Dev2010; 10: 101–122.
23. Bock S and Hoberg K. Detailed layout planning for irregularly-shaped machines with transportation path design.Eur J Oper Res2007; 177: 693–718.
24. Kim J-G and Kim Y-D. Layout planning for facilities with fixed shapes and input and output points.Int J Prod Res2000; 38: 4635–4653.
25. Qudeiri JA and Yamamoto H. Optimization of FTL lay-out design through an asymmetrical and restricted plant using GA.J Solid Mech Mater Eng2007; 1: 81–92. 26. Conway DG and Venkataramanan MA. Genetic search
and the dynamic facility layout problem. Comput Oper Res1994; 21: 955–960.
27. McKendall ARJr and Hakobyan A. Heuristics for the dynamic facility layout problem with unequal-area departments.Eur J Oper Res2010; 201: 171–182. 28. Yang T and Peters BA. Flexible machine layout design
for dynamic and uncertain production environments.Eur J Oper Res1998; 108: 49–64.
29. Ahmad A-R, Basir O, Hassanein K, et al. An intelligent expert systems’ approach to layout decision analysis and design under uncertainty. In Phillips-Wren G, Ichalkar-anje N and Jain L (eds) Intelligent decision making: an AI-based approach. Berlin, Heidelberg: Springer, 2008, pp.321–364.
30. Grefenstette JJ, Gopal R, Rosmaita BJ, et al. Genetic algorithms for the traveling salesman problem. In: Pro-ceedings of the 1st international conference on genetic algo-rithms, Pittsburgh, PA, 24–26 July 1985, pp.160–168. Hillsdale, NJ: Lawrence Erlbaum Associates, Inc.
Appendix 1
Notation
Cr crossover rate
F(i) fitness of individual numberi i index of part type (i= 1, 2,.,l)
IND(i) individuali
j operation index (j= 1, 2,.,O)
k machine tool index (k= 1, 2,.,M)
l number of different part types
Mi machine tooli
Mr mutation rate
n number of machine tools in FMS
ND number of individuals in each population
Nm number of individuals selected based on mutation
Oij operationjof part typei
Op number of operations of partp
P(i) populationi
Pijk machining time of operationOijin machine toolk
Ri route of part typei
Si workstationi
Sijk setup time of operationOijin machine toolk
TH throughput of the FMS
TT(i) total time the product needs to travel between stations in routei
Tl=u the summation of loading and unloading
times in loading/unloading unit.