ABSTRACT
The relationship between sorghum grain color and tannin content was reported in several references. In this study, 33 phenotypes of sorghum grain differing in seed characteristics were collected and analyzed by Folin–Ciocalteu method. A computer image analysis method was used to determine the color characteristics of all 33 sorghum phenotypes. Two methods of multiple linear regression and artificial neural network (ANN) models were developed to describe tannin content in sorghum grain from three input parameters of color characteristics. The goodness of fit of the models was tested using R2, MS error, and
bias. The computer image analysis technique was a suitable method to estimate tannin through sorghum grain color strength. Therefore, the color quality of the samples was described according three color parameters: L* (lightness), a* (redness – from green to red) and b* (blueness – from blue to yellow. The developed regression and ANN models showed a strong relationship between color and tannin content of samples. The goodness of fit (in terms of R2), which corresponds to
training the ANN model, showed higher accuracy of prediction of ANN compared with the equation established by the regression method (0.96 vs. 0.88). The ANN models in term of MS error showed lower residuals distribution than that of regression model (0.002 vs. 0.006). The platform of computer image analysis technique and ANN-based model may be used to estimate the tannin content of sorghum.
INTRODUCTION
Sorghum grain (Sorghum bicolor) is an important ingredient in poultry diets with approximately 95% of the nutritional value of corn (Hulan & Proudfoot, 1982; Dowling et al., 2002; Black et al., 2005). Certain agronomic characteristics, such as drought tolerance, allow sorghum to be grown in diverse geographical regions. Tannin content in the pericarp is one of the most important factors affecting the feeding value of sorghum grain (Nyachoti, 1997; Selle et al., 2010) and adversely affects its metabolizable energy and protein utilization in poultry (Boren & Waniska, 1992; Black et al., 2005; Selle et al., 2010). An initial study on Iranian sorghum grain indicated that its true metabolizable energy corrected for nitrogen (TMEn) content ranged between 3003 and 3899 kcal/kg (Sedghi et al., 2011), and protein content between 10.9 and 13.8% (Ebadi et al., 2011) in high- and low-tannin sorghum, respectively. Tannin can reduce feed intake (Oduhu & Baker, 2005; Bryden et al., 2009b), metabolizable energy (Perez-Maldonado & Rodrigues, 2009; Bryden et al., 2009b; Sannamani et al., 2010; Sedghi et al., 2011) and amino acid digestibility (Selle et al., 2010; Ebadi et al., 2011) in broilers when present in sorghum. Therefore, performance can be reduced when broiler are fed diets containing sorghum (Donald et al., 2008; Oduhu & Baker, 2005).
Artifi cial Neural Network
nAuthor(s)
Sedghi M* Golian A Soleimani-Roodi P Ahmadi A Aami-Azghadi M
Center of Excellence in the Animal Sciences Department
Ferdowsi University of Mashhad Mashhad, Iran
nMail Adress
Department of Animal Sciences Ferdowsi University of Mashhad Mashhad, Iran
E-mail: [email protected]
nKeywords
Image analysis, neural network model, Sorghum grain, tannin.
in seed characteristics were collected. All samples were chemically analyzed in triplicate for total tannin content by Folin–Ciocalteu method (Makkar et al., 2000). The picture of sorghum grain was taken using a scanner (model Hp 3800) and saved in JPEG format. Since the computer vision system perceived color as RGB (red, green and blue) signals, which is device-dependent (Fernandez et al., 2005), a 200*200 pixel areas was cut from each image and converted into L*a*b* units to ensure color reproducibility. In the L*a*b* color space, L* is lightness component, ranging from 0-100, parameter a* is the redness component (from green to red) and parameter b* is the blueness component (from blue to yellow). L* and b* are two chromatic components, which range from !120 to 120. In the L*a*b* space, color perception is uniform, and therefore, the Euclidean distance between two colors corresponds approximately to the color difference perceived by the human eye (Pedreschi
et al., 2007). Transformation of RGB into L*a*b space was performed according to a direct model, similar to the procedure described by Leon et al. (2006). Image analysis was performed using ImageJ tool-box software version 1.40g (Edit/Selection/Specify/Plugins/ Color space converter).
Model development and evaluation
The regression analysis was employed using L*, a* and b* as independent variables and sorghum tannin as the dependent variable. The model was fitted to data using PROC REG of the SAS (SAS Institute Inc., 2003).
An algorithm of feed-forward multi-layer perceptron with three inputs, one output (with linear activation function), and five hidden neurons (with hyperbolic tangent activation function) was considered to build the ANN models (Haykin, 1999). A Quasi-Newton training algorithm was used to train the network. The three input variables were L, a, and b. The 33 data lines were randomly divided into two sets of learning and testing, with 24 and 9 data lines, respectively. The data set was imported into the Statistica Neural Networks software version 8.0 (StatSoft, 2009). The goodness of fit of ANN models was determined using R2, MS error, and bias (Roush et al., 2006).
RESULTS
The tannin content and color parameter values of sorghum phenotypes obtained from chemical and image analyses are listed in Table 1. It seems The color of sorghum grain varies greatly due
to pericarp color and thickness, presence of testa, and endosperm texture and color. The relationship between sorghum color and tannin content was previously reported (Hahn & Rooney, 1985). Phenolic compounds, particularly especially tannin, may change the pigmentation of the pericarp and testa in sorghum grain (Rooney & Miller, 1982). Asquith et al. (1983) reported that sorghum cultivars may be divided into three categories, depending on their genotypes and tannin contents: type I sorghums do not have a pigmented testa and are tannin free; type II sorghums have a pigmented testa layer that contains condensed tannins; and Type III sorghums contain tannin both in the testa and the pericarp. Dykes & Rooney (2006) recorded tannin concentrations of 0.28, 4.48 and 11.95 g/kg in Type I, II and III sorghum categories, respectively. The determination of color can be carried out by visual (human) inspection or by using a color-measuring instrument. Determination of color by human inspection is extremely variable from observer to observer. Therefore, standard colors are often used as reference for color determination. Food color is measured by L*a*b* units, using either a colorimeter or specific data acquisition and image processing systems. L*a*b* is an international standard for color measurements and widely used in agriculture (Fathi
et al., 2009; Wan et al., 2011; Afshari-Jouybari & Farahnaky, 2011).
Several methods of chemical analysis were frequently used to determine phenolic compounds and tannin content (Price et al., 1978; Hahn & Rooney, 1985; Makkar et al., 2000). Tannin determination through chemical analysis is expensive and time consuming, thus, it is necessary to find an alternative method. Image analysis and artificial neural network (ANN) have widely been applied to determine quality parameters of food and agricultural products (Majumdar & Jayas, 2000; Lu et al., 2000; Shafafi Zenoozian et al., 2008; Fathi et al., 2009).
The objective of this study was to use a computer image analysis method and ANN model to describe the relationship between sorghum tannin (as output) and color variation (as inputs). The predicted values of the developed ANN model were compared with those obtained with regression model.
MATERIAL AND METHODS
Sorghum samples and analyses
Where L*, a*, and b* are lightness, redness, and blueness, respectively. Redness and blueness were not significant (p> 0.05).
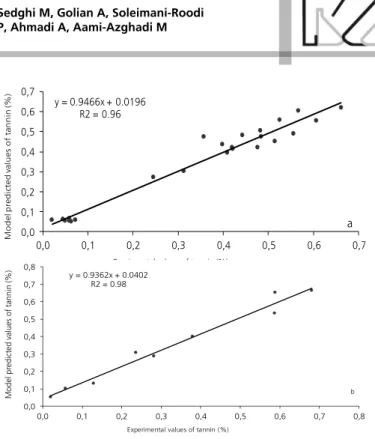
The regression and ANN model plots of predicted vs. actual values of tannin content are shown in Figures 1 and 2, respectively. The comparison between actual and predicted output values may describe the behavior of the prediction model from the investigating inputs. The calculated coefficients of determination indicated good agreement between the observed and the predicted tannin values both in the regression and ANN models (training and testing sets). The goodness of fit statistic values derived from the regression and ANN models to predict the sorghum tannin content are shown in Table 2. The regression model (equation 1) adequately (R2= 0.88) explained the variation among
tannin contents of different sorghum samples (Figure 1). The goodness of fit in terms of R2 corresponding to
training of the ANN model showed a higher accuracy of prediction than the equation established by the regression method (0.96 vs. 0.88). In terms of MS error, the ANN model showed lower residuals distribution than that of regression model (0.002 vs. 0.006).
DISCUSSION
The objective of this study was to explore the possibility of using digital image analysis to estimate the tannin content of sorghum grain from its color. Nowadays, digital camera systems and image analysis techniques are well established, robust, and relatively cheap and can form the basis of a real-time observation
that computer image analysis technique is a suitable method for predicting tannin in sorghum grain both by regression and ANN models. A linear regression model was applied to all data (Table 1), and the following relationship was established:
Tannin = 1.167 (SE= 0.141) -0.015 (SE= 0.003) × L* + 0.004 (SE=0.004) × a* -0.004 (SE=0.004) × b* R2= 0.88
Table 1 – Values of tannin content and color parameters insorghum phenotypes obtained by chemical and image analyses.
Sorghum phenotypes
Color parameter1 Chemical
analysis Tannin (%)1
Blueness Redness Lightness
1 26 18 43 0.587
2 27 5 70 0.049
3 13 16 36 0.589
4 24 16 44 0.357
5 25 18 46 0.515
6 28 18 49 0.246
7 22 7 58 0.058
8 24 17 48 0.476
9 26 20 45 0.420
10 6 71 0.059
11 24 19 47 0.399
12 18 17 40 0.607
13 17 15 62 0.313
14 21 13 45 0.483
15 23 18 49 0.422
16 18 13 39 0.567
17 26 18 51 0.282
18 29 8 63 0.059
19 28 6 68 0.021
20 21 22 41 0.484
21 26 5 73 0.020
22 23 16 44 0.443
23 36 9 63 0.129
24 31 7 69 0.063
25 17 13 36 0.681
26 29 7 64 0.046
27 31 8 65 0.072
28 10 6 42 0.409
29 28 17 45 0.379
30 27 13 45 0.556
31 26 19 50 0.236
32 23 17 42 0.525
33 18 15 37 0.662
1 - Blueness, redness, lightness and tannin values of 33 sorghum samples. Each value is the mean of a triplicate.
Figure 1 - The scatter plot of experimental vs. predicted values of sorghum tannin content obtained by regression analysis (black dots) using entire data set (n=33). Solid line indicates the fitted simple regression line on scattered points.
y = 0.8775x + 0.0416 R2 = 0.88
-0,1 0,0 0,1 0,2 0,3 0,4 0,5 0,6 0,7
0,0 0,1 0,2 0,3 0,4 0,5 0,6 0,7 0,8
Experimental values of tannin (%)
M
o
d
e
l
p
re
d
ic
te
d
v
a
lu
e
s
o
f
ta
n
n
in
(
Multiple linear regression (MLR) and artificial neural network (AAN) models were previously used to describe the correlation between chemical compositions and TMEn value of sorghum grain in poultry (Sedghi et al., 2011; Ebadi et al., 2011). The results of these studies showed that the ANN model may more accurately estimate TMEn of feed ingredients than those using the MLR model. Furthermore, the results of those studies indicated that TMEn and amino acid digestibility were negatively correlated with polyphenol content in sorghum grain.
Sorghum grain characteristics have been documented by Rooney & Miller (1982). Sorghum appearance and quality are significantly affected by genetically-controlled characters. Several studies reported that there is a relationship between sorghum grain color and tannin content (Hahn & Rooney, 1985; Leeson & Summers, 2005). In contrast, Boren & Waniska (1992) suggest that seed color is not a good parameter to predict tannin content. Rooney & Miller (1982) reported that phenolic compounds, like tannin, change the pigmentation of the pericarp and testa of sorghum grain. Sorghum phenols, pigmentation and color of the pericarp and testa are controlled by the R, Y, B1, B2 and S genes. When both R and Y are dominant, anthocyanidin pigments increase and the pericarp becomes red. Dominant B1 and B2 genes control the presence of pigmented testa layer and tannin in sorghum. When S is dominant, in the presence of B1 and B2, the level of total phenols and tannin in the whole grain, pericarp and testa layers increased (Hahn & Rooney, 1985; Rooney & Miller, 1982). Since the precision of tannin estimation from color may be different in other sorghum varieties, further research on this field is required in order to ensure tannin estimation in sorghum grain based on grain color.
Table 2 - Statistical values derived from regression and artificial neural network models to describe tannin content in sorghum grain based on grain color parameters.
Artificial neural network model ** Regression model
Statistics Training set Testing set Entire data
R2 0.96 0.98 0.88
Mean square error 0.002 0.002 0.006
Bias -0.004 -0.019 0.000
Type of network Three layers perceptron
Training algorithm Quasi-Newton
Number of hidden neurons 4
Type of activation function in hidden neurons Hyperbolic tangent
y = 0.9466x + 0.0196 R2 = 0.96
0,0 0,1 0,2 0,3 0,4 0,5 0,6 0,7
0,0 0,1 0,2 0,3 0,4 0,5 0,6 0,7
M
o
d
el
p
red
ic
ted
v
al
u
es
o
f
tan
n
in
(%)
Exprimental values of tannin (%)
a
Figure 2 - The scatter plot of experimental vs. predicted values of sorghum tannin content obtained by artificial neural network mo-del (black dots). a: Training set (n=24); b: Testing set (n=9). Solid line indicates the fitted simple regression line on scattered points.
system. There is a clearly considerable potential benefi•t in using image-based estimation of tannin content in sorghum grain instead of chemical analysis.
The ANN-model seems to be a more accurate (R2>
0.96) tool for predicting tannin content both in training and testing data sets (testing data were not used during the training processes). Moreover, the trained ANN model of tannin was statistically balanced in two subsets of training and testing data (Table 2). This may suggest that there was no overlearning during the training process, and that developed model has good generalization ability (Figures 2b) when faced with completely novel datasets (Lou & Nakai, 2001; Ahmadi & Golian, 2010).
y = 0.9362x + 0.0402 R2 = 0.98
0,0 0,1 0,2 0,3 0,4 0,5 0,6 0,7 0,8
0,0 0,1 0,2 0,3 0,4 0,5 0,6 0,7 0,8 Experimental values of tannin (%)
M
o
d
el
p
red
ic
ted
v
al
u
es
o
f
tan
n
in
(%)
CONCLUSION
The objective of this study was to explore the possibility of using digital image analysis and ANN to predict tannin content in sorghum grain based on its color. Although the precision of tannin estimation depends on many factors, based on our procedures and results, the development of a practical imaging system for tannin estimation in sorghum grain is feasible. However, more sorghum varieties must be analyzed to find a more accurate relationship between tannin and its color. The image analysis results may be used in ANN models instead of regression models to increase accuracy of tannin prediction based on color of sorghum grain.
REFERENCES
Afshari-Jouybari H, Farahnaky A. Evaluation of Photoshop software potential for food colorimetry. Journal of Food Engineering 2011; 106: 170-175.
Ahmadi H, Golian A. Growth analysis of chickens fed diets varying in the percentage of metabolizable energy provided by protein, fat, and carbohydrate through artificial neural network. Poultry Science 2010; 89:173-179.
Asquith TN, Izuno CC, Butler LG. Characterization of the condensed tannin (proanthocyanidin) from a group II sorghum. Journal of Agricultural and Food Chemistry 1983; 31:1299-1303.
Boren B, Waniska RD. Sorghum seed color as an indicator of tannin content. Journal of Applied Poultry Research 1992; 1:117-121.
Bryden WL, Selle PH, Cadogan DJ, Li X, Muller ND, Jordan DR, Gidley MJ, Hamilton WD. 2009b. A review of the nutritive value of sorghum for broilers [RIRDC Publication 09/077]. Barton: Rural Industries Research and Development Corporation; 2009b.
Dowling LF, Arndt C, Hamaker BR. Economic viability of high digestibility sorghum as feed for market broilers. Agronomy Journal 2002; 94:1050-1058.
Dykes L, Rooney LW. Sorghum and millet phenols and antioxidants. Journal of Cereal Science 2006; 44:236-251.
Ebadi MR, Sedghi M, Golian A, Ahmadi, H. Prediction of the true digestible amino acid contents from the chemical composition of sorghum grain for poultry. Poultry science 2011; 90:2397-2401.
Fathi M, Mohebbi M, Razavi MA. Application of image analysis and artificial neural network to predict mass transfer kinetics and color changes of osmotically dehydrated kiwifruit. Food and Bioprocess Technology; 2009. Disponivel em: <http.//dx.doi.org>. Doi:10.1007/s11947-009-0222-y.
Fernandez L, Castillero C, Aguilera JM. An application of image analysis to dehydration of apple discs. Journal of Food Engineering 2005; 67: 185-193.
Hahn DH, Rooney LW. Effect of genotype on tannin and phenols of sorghum. Cereal Chemists 1985; 63(1):4-8.
Haykin S. Neural Networks: A Comprehensive Foundation. 2nd ed. New
Jersey: Prentice-Hall; 1999.
Hulan HW, Proudfoot FG. Nutritive value of sorghum grain for broiler chickens. Canadian Journal of Animal Science 1982; 62:869-875.
Leeson S, Summers JD. Commercial Poultry Nutrition. 3rd ed. Guelph: University Books; 2005.
Leon K, Mery D, Pedreschi F, Leon J. Color measurement in L*a*b units from RGB digital images. Food Research International 2006; 39:1084-1091.
Lou W, Nakai S. Artificial neural network-based predictive model for bacterial growth in a simulated medium of modified-atmosphere-packed cooked meat products. Journal of Agricultural and Food Chemistry. 2001; 49:1799-1804.
Lu J, Tan J, Shatadal P, Gerrard, DE. Evaluation of pork color by using computer vision. Meat Science 2000; 56:57-60.
Majumdar S, Jayas DS. Classification of cereal grains using machine vision: III. Texture models. Transactions of the ASABE 2000; 43:1681-1687.
Makkar HPS, editor. IAEA Vienna Austria. Qualification of Tannins in Tree Foliage. A Laboratory Manual for the FAO/IAEA Co-ordinated Research Project on Use of Nuclear and Related techiquea to Develop Simple Tannin Assays for Predicting and Improving the safety and Ef•ciency of Feeding Ruminants on Tanniniferous Tree Foliage. Joint FAO/IAEA, FAO/IAEA of Nuclear Techniques in Food and Agriculture. Animal Production and Health Sub-program, FAO/IAEA Working Document; 2000.
Nyachoti CM, Atkinson JL, Leeson S. Sorghum tannins: a review. Worlds poultry Science Journal 1997; 53:5-21.
Oduhu GW, Baker DH. Some tropical high tannin sorghums and their effects on broiler performance. Agricultura Tropica ET Subtropica 2005; 38:105-110.
Pedreschi F, Leon J, Mery D, Moyano P, Pedreschi R, Kaack K. Color and acrylamide content of pre-dried potato chips. Journal of Food Engineering 2007; 79:786-793.
Perez-Maldonado RA, Rodrigues HD. Nutritional characteristics of sorghums from Queensland and New South Wales for chicken meat production[ RIRDC Publication, 07] Barton: Rural Industries Research and Development Corporation; 2009.
Price ML, Van Scoyok S, Butler LG. A critical evaluation of the vanillin reaction as an assay for tannin in sorghum grain. Journal of Agricultural and Food Chemistry 1978; 26(5):1214-1218.
Rooney LW, Miller FR. Variation in the structure and kernel characteristics of sorghum. Proceedings of the International Symposium on Sorghum Grain Quality. Patancheru: ICRISAT 1982. p.143-162.
Roush WB, Dozier III WA, Branton SL. Comparision of Gompertz and neural networks models of broiler growth. Poultry Science 2006; 85:794-797.
Sannamani P, Tyagi PK, Tyagi PK, Sastry VRB, Elangovan AV, Mandal AB. value of high and low tannin sorghum as broiler feed. Indian Journal of Poultry Science 2010; 45:35-41.
SAS Institute. 2003. SAS/STAT software version 9. SAS Inst. Inc., Cary, NC.
Selle PH, Cadoganb DJ, Li X, Bryden WL. Implications of sorghum in broiler chicken nutrition. Animal Feed Science and Technology 2010; 156:57-74.
Shafafi Zenoozian M, Devahastin S, Razavi MA, Shahidi F, Poreza HR. Use of artificial neural network and image analysis to predict physical properties of osmotically dehydrated pumpkin. Drying Technology 2008; 26:132-144.
StatSoft. Statistica. Data analysis software system. Version 8.0. Tulsa: StatSoft; 2009.
Thomas DV, Ravindra V. Effect of Cereal type on the performance, gastrointestinal tract development and intestinal morphology of the newly hatched broiler chick. The Journal of Poultry Science 2008; 45:46-50.