* Corresponding author.
E-mail addresses: [email protected] (M. Chattopadhyay) © 2012 Growing Science Ltd. All rights reserved. doi: 10.5267/j.msl.2012.03.003
Contents lists available atGrowingScience
Management Science Letters
homepage: www.GrowingScience.com/msl
Application of principal component analysis in machine-part cell formation
Manojit Chattopadhyaya*, Sitanath Mazumdarb,Pranab K Dancand Partha Sarathi Chakrabortyd
aDepartment of Computer Application, Pailan College of Management and Technology, Kolkata 700 104, India b
Department of Business Management, University of Calcutta, Kolkata, India
c
Department of Industrial Engineering, School of Engineering & Technology, West Bengal University of Technology, Kolkata 700064, India
d
Department of Business Administration, Pailan College of Management and Technology, Kolkata 700104, India A R T I C L E I N F O A B S T R A C T
Article history: Received October 1, 2011 Received in Revised form November, 14, 2011 Accepted 15 February 2012 Available online 5 March 2012
The present work applies Principal Component Analysis (PCA) for grouping of machines and parts so that the part families could be processed in the cells formed by those associated machines. An incidence matrix with binary entries has been chosen to apply this methodology. After performing the eigenanalysis of the principal component and observing the component loading plot of the principal components, the machine groups and part families are identified and arranged to form machine-part cells. Later, the same methodology is extended and it is applied to nine other machine-part matrices collected from literature for the validation of the proposed methodology. The goodness of cell formation is compared using the grouping efficacy and the potential of eigenanalysis in cell formation is established over the best available results using the various established methodologies. The result shows that in 70% of the problems there is an increase in grouping efficacy and in 30% problem, the performance measure of cell formation is as good as the best result from literature.
© 2012 Growing Science Ltd. All rights reserved. Keywords:
Eigen Analysis
Principal Component Analysis Group Technology
Machine-Part Cell Grouping efficacy
1. Introduction
throughput time, reduced work in progress inventory, simplified material flow and reduced material handling (Love, 1996; Hyer & Wemmerlov, 2002).
According to GT concept, as applied in production, a group of machines for one or more part families may be formed to process the parts that have similar operations using the machines. Since the machines are laid out as a group or cell, requiring reduced movement and flow of parts, it minimizes transportation and waiting and thereby reduces the throughput time. These groups of machining centres are referred as flexible manufacturing systems (FMS) or manufacturing cells (Ham & Hitomi, 1985) and are based on the concept of the GT principles to manufacturing (Burbidge, 1969) known as cellular manufacturing (Wemmerlov & Hyer, 1986).
Cellular manufacturing (CM) is considered, in the present time, as one of the latest technological methodologies in batch type production (Boyer et al., 1997; Fahad, 2003) in providing economic advantages comparable to those of mass production and helping to gain efficiency and achieve flexibility by the manufacturing units (Luong, 2002). The first step in the design of cellular manufacturing systems is the cell formation by clustering machines and parts into machine cells and part families respectively to ensure minimum intercellular part movement( Kim et al., 2005; Ameli & Arkat, 2008).
The context of determining part families and machine group is referred to as the cell formation (CF) problem. Researches in the field addressed this issue and development of various techniques for solving the GT and CM problems were reported which paved the way for classification of cell formation techniques in GT/CM (Burbidge, 1963; King & Nakornchai, 1982; Han & Ham, 1986; Vakharia, 1986; Wemmerlov & Hyer, 1986). A cellular manufacturing system is primarily concerned with production flow analysis where machines and parts are grouped together based on manufacturing similarities.
McCormick et al. (1972) defined the clustering technique as an attempt to uncover and display similar cluster or groups from a given input object-object or object-attribute data matrix. Heragu (1994) modified the classification of cell formation as i) techniques that identify part families only, ii) techniques that identify machine cells only, and iii) techniques that identify part families and machine cells simultaneously. In CF problem the later technique is more useful than the other two. Similarity coefficient approach reported to specify the similarity among parts (Carrie, 1973; Offodile, 1991; Kini, 1991). The part families based on the cells identified after identification of the machine- cells (Witte, 1980; Seifoddini & Wolfe, 1987). McAuley (1972) developed the single-linkage clustering technique while graph theoretic method has been used to identify machine cells (Rajagopalan and Batra, 1975; Faber and Carter, 1986).
Srinivasan et al. (1990) proposed an assignment based algorithm that identifies machine groups first and then part families. Wayback in 1968, Iri presented a clustering algorithm that masks all columns having a ‘1’ as entry in that row while the iteration starts from any row. It then masks all rows, which have ‘1’ as entries in the masked columns. This procedure is repeated until it is further not possible to get a new set of unmasked rows or columns. When this condition occurs, a cluster of machines and corresponding part families is formed (Kusiak & Chow, 1987).
antcolony based clustering algorithm for manufacturing cell design. Muruganandam et al. (2005),
Adil and Ghosh (2005) and Yin et al. (2005) successfully introduced various metaheuristic algorithms to solve the machine cell formation problem in group technology.
For solving cell formation problem, Hachicha et al. (2008) used a multivariate approach based correlation analysis to get an original similarity coefficient matrix in the first phase of the procedure, and in the second phase, the PCA was applied to find the eigenvalues and eigenvectors on the correlation similarity matrix. They also used a ‘scatter plot’ as a cluster analysis which was applied to form machine groups, and the comparative results on multiple performance criteria duly establishes the effectiveness, efficiency and practical suitability of their approach. Seifoddini (1987); Gupta (1991) developed software packages to verify the suitability of the usage of similarity coefficient obtained using production data for machine-component grouping decisions in the design of a cellular manufacturing system. Some researchers, in the recent past, developed similarity coefficient algorithms for solution and presented them with illustrated numerical problems and computational results (Waghodekar & Sahu, 1984; Kusiak & Cho, 1992).
The new similarity measure is particularly useful for size reduction of the cell formation problem. A discussion on the behaviour of machine cell formation is found in the works of McCormick (1972), King (1980, 1982) and Chu and Tsai (1990). Hierarchical clustering (Stanfel, 1985; McAuley, 1972), non-hierarchical clustering (Chandrasekharan & Rajagopalan, 1986), graph based clustering (Rajagopalan & Batra, 1975), neural network (Malave & Ramchandran, 1991; Kao & Moon, 1997;
Mehrabad & Safaei, 2007), fuzzy logic (Xu & Wang, 1989; Ravichandran & Rao, 2001) and metaheuristics like Simulated Annealing (Boctor, 1991;Venugopal, & Narendran, 1992; Akturk & Yayla, 2006; Arkat et al., 2007), tabu search ( Wu et al., 2004; Lei & Wu, 2006) and Genetic Algorithm (Joines, 1993; Jawahar et al., 1998 ; Khoo et al., 2000; Mak et al., 2000; Asokan et al., 2001;Pai et al., 2005) based procedures have been applied in finding CF solution.
The importance of forming the clusters of machines vis-a-vis the parts is evident from the work done, as mentioned above, in this area. Therefore, in the design of such cells the most significant criteria will be to examine the performance measure of a suitable kind to ensure the optimality of the layout design. Different kinds of performance measurement have been proposed by researchers (Chandrasekharan & Rajagopalan, 1986; Kumar & Chandrasekaran, 1990; Zolfaghari & Liang, 2003; Li, 2007). It is comprehensible from the review of past research that the clustering method needs to be chosen in such a manner that the efficiency or efficacy remains high.
Although various methodologies for clustering as well as the performance measures were studied, very few were found to have dealt with the PCA model and even fewer attempted to determine the performance measure. In this research, a new approach is adopted by deploying PCA as clustering technique and using the grouping efficacy procedure for measuring the performance. A comparative study is carried out and presented in this work to verify and establish the effectiveness of the proposed method.
In the present paper, an attempt has been made to cluster the machine-part by deploying the PCA approach where the available commercial statistical packages like Minitab, SPSS, Matlab etc can be used. In this work Minitab has been deployed.
2. Proposed Methodology
2.1 Principal component analysis
PCA perhaps is the best known and oldest technique in multivariate analysis (Jolliffe, 1986; Preisendorfer, 1988). Pearson (1901), was first to introduce it in the context to recast linear regression analysis into a new form. Thereafter, it was developed by Hotelling (1933) in the field of psychometry. In the various real world problems, the PCA is frequently used in the data set with some intrinsic complexity (Tuncer et al., 2008; Horenko et al., 2006; Rothenberger et al., 2003; Atsma & Hodgson, 1999; Barbieri et al., 1999). The PCA is applied as a cluster analysis tool to form machine groups and part families (Hachicha et al., 2006) simultaneously. Application of PCA has been in representing the data using a smaller number of variables (Wall et al., 2002).
Hotelling, 1933 developed the principal component (PC) method of factor analysis, which seeks to maximize the sum of squared loadings of each factor extracted. The PC factor can explain more variance than any other loadings obtained from any methods of factoring. The objective of PCA is the construction out of a given set of variables X's(j=1,2,3…,k) of new variables(pi), called principal
components which are linear combinations of the X,
1 11 1 12 2 1k k
p = a X + a X +"+ a X (1)
k 1k 2
12 1 11
i =a X +a X + +a X
p " (2)
#
k kk 2
k2 1 k1
k =a X +a X + +a X
p " (3)
The aij 's are called loadings and are worked out in such a way that the extracted principal
components satisfy two conditions: (i) PC are uncorrelated(orthogonal) and (ii) the first PC (PC1) has the maximum variance, the second PC(PC2) has the next maximum variance and so on. The PCA from the perspective of statistical pattern recognition is having the practical value as it is an effective technique for dimension reduction (Haykin, 2008). The other main advantage of PCA is that once these patterns in the data are found, the data can be compressed by reducing the number of dimensions without much loss of information.
This work adheres to the procedure involving the steps needed to perform a PCA on a set of data. Here, the PCA, first finds the set of orthogonal eigenvectors of the correlation or covariance matrix of the variables. The matrix of principal components is the product of the eigenvector matrix with the matrix of independent variables. The first principal component accounts for the largest percent of the total data variance. The second principal component accounts the second largest percent of the total data variance, and so on. The goal of principal components is to explain the maximum amount of variance with the fewest number of components.
2.2 Implementation approach
The principal objective of this research is to implement a PCA model to generate optimal machine cells and part families in cell formation. For this, a problem in the format of machine/part incidence matrix is adopted from the available literature and the following stages are involved in the method developed here. The correlation matrix for similarity of machines and parts is used as similarity coefficient matrix after standarising the machine-part matrix. The PCA method is applied to find the eigenvalues and eigenvectors on the correlation matrix.
on the machine corresponding to the particular column and “0” indicates otherwise. In the (p×m) dimension of binary machine/part matrix, the p rows indicate p parts and the m columns represent m
machines. In the above mentioned incidence matrix, the entry mij=1 if the th
j component of the
machine is processed by the th
i part, and mij=0 otherwise. The binary forms of the matrix are
presented in the Table 1 and Table 2.
Table 1
Incidence Matrix obtained from Waghodekar and Sahu (1984)
m1 m2 m3 m4 m5
p1 1 0 0 1 0
p2 0 1 0 1 1
p3 0 1 1 1 0
p4 0 1 1 1 1
p5 1 1 1 0 1
p6 1 0 1 0 1
p7 1 0 0 0 0
In the said tables, the columns indicated by mj imply the th
j component of the machine and the rows indicated by mi imply the th
i processing part. Necessity of data standardization prior to
implementation of PCA is well documented (e.g. Cao et al.,1999; Montogomery, 2001). In the present work. the data have been standardized by subtracting the mean from each row element and then by dividing by the standard deviation of the corresponding row.
(
)
j 2 j j j
X X =
z − .
This standardization procedure has been applied to the aforementioned matrix (Table 1). The correlation matrix has been computed from the matrix of the standardized data, in the next step, and presented in Tables 2a and 2b.
Table 2a
The correlation matrix of parts corresponding to the incidence matrix obtained from Waghodekar and Sahu (1984)
p1 p2 p3 p4 p5 p6 p7
p1 1.00
p2 -0.17 1.00
p3 -0.17 0.17 1.00
p4 -0.61 0.61 0.61 1.00
p5 -0.61 -0.41 -0.41 -0.25 1.00
p6 -0.17 -0.67 -0.67 -0.41 0.61 1.00
p7 0.61 -0.61 -0.61 -1.00 0.25 0.41 1.00
Table 2b
The correlation matrix of machines corresponding to the incidence matrix obtained from Waghodekar and Sahu (1984)
m1 m2 m3 m4 m5
m1 1.00
m2 -0.75 1.00
m3 -0.17 0.42 1.00
m4 -0.75 0.42 -0.17 1.00
m5 -0.17 0.42 0.42 -0.17 1.00
The PCA method begins through the identification of a linear combination of variables (machine-part) known as a component. This component accounts for as much variation in the original variables (machine-part) as possible. Thereafter, it finds another component that accounts for as much of the remaining variation as possible and is uncorrelated with the previous component. This process will continue in the same way until there are as many components as original variables (machine-part). Most of the variance is due to the few components. These components can be used to replace the original variables (machine-part). Thus, this method can be used to reduce the number of variables (machine-part) of the machine-part correlation matrix. The eigenvalue results will be used to determine the number of principal components.
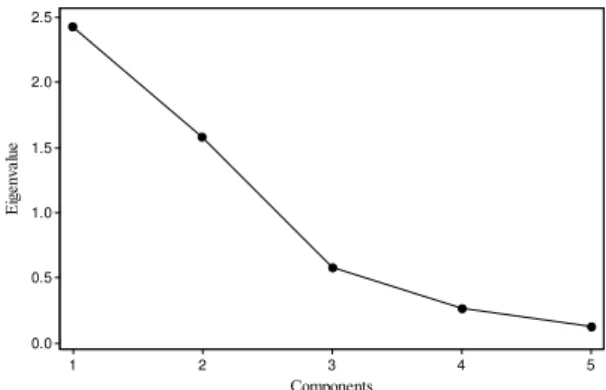
The variance in each variable is determined in terms of eigenvalue. For the problem matrix under consideration the eigenvalues are presented in Table3 and Table4 and the corresponding plotting of those eigenvalues are presented in Fig. 1(a) and Fig. 1(b). The eigenanalysis of the correlation matrix with the eigenvalue are then derived using PCA. The observations made on the figures are detailed in the subsequent sections.
Components
E
ige
nv
a
lue
7 6 5 4 3 2 1 4
3
2
1
0
Components
E
ige
nva
lue
5 4
3 2
1 2.5
2.0
1.5
1.0
0.5
0.0
Fig. 1a. Scree Plot diagram of parts showing the eigenvalues derived from the correlation matrix obtained from Waghodekar and Sahu (1984) . The eigenvalues have been computed with respect to parts
Fig. 1b. Scree Plot diagram of machines showing the eigenvalues derived from the correlation matrix corresponding to the incidence matrix obtained from Waghodekar and Sahu (1984) . The eigenvalues have been computed with respect to machines.
3. Computational Results
In this section, acronyms have been used for source literature from which the incidence matrix has been obtained for referral convenience. The literature referred here by Waghodekar and Sahu (1984) would be abbreviated as WS84. For the initial solution, there are as many components as variables, and in a correlations analysis, the sum of the eigenvalues equals the number of components. In this work the eigenvalues greater than 1 have been extracted and so in WS84 the first two principal components form the extracted solution.
The Table 3 and Table 4 show the extracted components. In WS84 they explain nearly 82.0% (parts) and 80.00% (machines) of the variability in the original variables. So the complexity of the data set can be reduced considerably by using these components, with only minimum loss of information.
Table 3
Tabular presentation of the Eigenanalysis of the Correlation Matrix of parts obtained from WS84 PC1 PC2 PC3 PC4 PC5 PC6 PC7 Eigenvalue 3.69 2.02 0.83 0.46 0.00 0.00 0.00
Proportion 0.53 0.29 0.12 0.07 0.00 0.00 0.00
Cumulative 0.53 0.82 0.94 1.00 1.00 1.00 1.00
In WS84 the Eigenanalysis of the Correlation Matrix retain components that cumulatively explain 82.0%(of parts) and 80.0%(of machine) of the variance (Tables 3,4).
Table 4
Tabular presentation of the Eigenanalysis of the Correlation Matrix of machine obtained from WS84
PC1 PC2 PC3 PC4 PC5
Eigenvalue 2.43 1.59 0.58 0.27 0.13
Proportion 0.49 0.32 0.12 0.05 0.03
Cumulative 0.49 0.80 0.92 0.98 1.00
For the WS84 the data related to machine (Table 4), the first principal component (PC1) has variance of 2.43 (equal to the largest eigenvalue) and accounts for 0.49 (49.0%) of the total variance in the data. The second principal component (PC2) the variance is 0.32 and accounts for 0.80(80.0%) of the total data variation. The first two principal components with variances equal to the eigenvalues greater than 1 represent 0.80(80.0%) of the total variability, suggesting that 2 principal components adequately explain the variance in the data.
For the WS84 the data related to parts (Table 3), the first principal component (PC1) has variance of 3.69 (equal to the largest eigenvalue) and accounts for 0.53(53%) of the total variance in the data. The second principal component (PC2) the variance is 2.02 and accounts for 0.29 (29.0%) of the total data variation. The first two principal components with variances equal to the eigenvalues greater than 1 represent 0.82(82.0%) of the total variability, suggesting that 2 principal components adequately explain the variance in the data.
Table 5
Coefficients Matrix of parts obtained from WS84
Variable PC1 PC2 PC3 PC4 PC5 PC6 PC7
p1 -0.19 0.65 0.00 -0.18 -0.42 0.54 -0.20
p2 0.39 0.09 -0.71 0.20 0.38 0.40 0.03
p3 0.39 0.09 0.71 0.20 0.38 0.40 0.03
p4 0.48 -0.24 0.00 -0.31 -0.50 0.17 0.58
p5 -0.25 -0.56 0.00 0.53 -0.34 0.44 -0.17
p6 -0.38 -0.37 0.00 -0.64 0.38 0.40 0.03
p7 -0.48 0.24 0.00 0.31 0.15 0.06 0.77
The principal components are the linear combinations of the original variables that account for the variance in the data. The maximum number of components extracted always equals the number of variables. The eigenvectors, which are comprised of coefficients corresponding to each variable, are used to calculate the principal component scores. The coefficients indicate the relative weight of each variable in the component. The bigger the absolute value of the coefficient, the more important the corresponding variable is in constructing the component.
Thus, for the WS84 data pertaining to machines, the first principal component’s scores are computed from the original data using the coefficients listed under PC1 (Table 6):
Table 6
Coefficients Matrix of machines obtained from WS84
Variable PC1 PC2 PC3 PC4 PC5
m1 -0.59 -0.24 0.00 -0.01 0.78
m2 0.58 -0.11 0.00 -0.70 0.40
m3 0.27 -0.56 0.71 0.33 0.03
m4 0.42 0.55 0.00 0.54 0.49
m5 0.27 -0.56 -0.71 0.33 0.03
PC1 = -0.59m1 +0.58 m2 +0.27m3 + 0.42m4+0.27m5
m1 have large negative loadings on component 1, therefore, it has been treated as component machine group1 and m2, m3, m4 and m5 have large positive loadings on component 1, therefore, they have been treated as machine group2.
First Component S eco n d C o m p o n en t 0.50 0.25 0.00 -0.25 -0.50 0.75 0.50 0.25 0.00 -0.25 -0.50 p7 p6 p5 p4 p3 p2 p1 First Component S e co n d C o m p o n en t 0.50 0.25 0.00 -0.25 -0.50 -0.75 0.50 0.25 0.00 -0.25 -0.50 m5 m4 m3 m2 m1
Fig.2a. Component loading plot of parts for
WS84
Fig. 2b. Component loading plot of machines
Also in this WS84 data pertaining to parts, the first principal component’s scores are computed from the original data using the coefficients listed under PC1 (Table 5):
PC1 = -0.19p1+0.39p2+0.39p3+0.48p4-0.25p5-0.38p6-0.48p7
p1, p6, p7 have large negative loadings on component 1, therefore, they have been treated as component part family1. Similarly, p2, p3, and p4 have large positive loadings on component 1, therefore, they have been treated as component part family2. The p5 has large negative loading on component 2 for which the part p5 is placed under part family 2.
Also the loading plot (Fig. 2a and Fig. 2b) provides information about the loadings of the first two principal components. For the WS84 data pertaining to machine (Fig. 2b): the m1 form a visually obvious cluster of machine group1 and m2, m3, m4, m5 form another visually obvious cluster of machine group2. Similarly, for data pertaining to part (Fig. 2a) p1, p7, p6 form a visually obvious cluster of part family1 and p2, p3, p4 forms the other cluster of part family2.
The above information of part family and machine group have been rearranged from the incidence matrix to obtain the GT cell and finally the block diagonal has been derived (Table7).
Table 7
Showing Cell formation of the Matrix obtained from Waghodekar and Sahu (1984)
m3 m5 m2 m4 m1
p2 0 1 1 1 0
p3 1 0 1 1 0
p4 1 1 1 1 0
p5 1 1 1 0 1
p6 1 1 0 0 1 p7 0 0 0 0 1 p1 0 0 0 1 1
During this process it has been found that p5 belongs to part family 2.
Thus, two machine-part cells can be formed using this PCA approach for the referred problem. After application of PCA in the manner explained above the grouping efficacy of the cell formation (Kumar & Chandrasekaran, 1990) is measured using the Eq. (4).
⎟⎟ ⎠ ⎞ ⎜⎜ ⎝ ⎛
− −
φ
1
ψ
1
= (4)
where,
operations of
number Total
elements l
exceptiona of
Number =
ψ ,
operations of
number Total
blocks diagonal in the
voids of Number =
φ
It has already been mentioned that the methodology proposed here adopted PCA in cell formation where the existing methodologies found in the literature adopted techniques other than PCA. Therefore, to examine the suitability of the methodology adopted in the present work it is necessary to compare its grouping efficacy with the referred one where competitive learning was adopted and the grouping efficacy was found to be 62.5. Based on the approach of this research the grouping efficacy is 0.6957.
Table 8
Summary of computational results
Test data set
References Size Grouping Efficacy
Best Result from Other Approaches
Our Approach
Percentage(%) Improvement
1 Kusiak (1992) 6X8 76.92 76.92 0.00
2 Mosier & Taube(1985a) 10X10 70.59 70.59 0.00
3 Carrie(1973) 20X35 76.22 77.91 2.22
4 Waghodekar & Sahu(1984) 5X7 62.50 69.57 11.31
5 Balasubramanian &
Panneerselvam(1993)
15X10 72.10 75.00
4.02
6 Balakrishnan & Jog(1995) 12X19 56.00 58.59 4.63
7 Chandrasekharan
&Rajagopalan(1986)
8X20 85.25 85.25
0.00
8 Kusiak(1987) 7X12 0.733 0.8 9.14
9 Waghodekar & Sahu(1984) 5X7 0.7333 0.7368 0.48
10 Boctor (1991) 16X30 0.727 0.73 0.41
The grouping efficacies are obtained and compared with the best result available in the literature. Thus from 10 problems it is shown that in 7 problems (70%) there is increase in grouping efficacy and in 3 problems (30%) the grouping efficacy is as good as the best one. Moreover in two problems (20%) the increase in grouping efficacy is more than 9% from the best result. Thus the proposed method’s application in cellular manufacturing is established for both in research and industry purpose.
4. Conclusion
The formation of cell is the fundamental step towards cellular manufacturing. The literature in cellular manufacturing is filled with various grouping techniques deployed to identify part families to form cells. In general, an average sized manufacturing facility may have hundreds of machines and thousands of parts, and such high dimensionality restricts the performance of most of the clustering techniques found in the literature. The main objective of this work was to explore PCA method as one of the easy, convenient, flexible, readily available and clearly understandable grouping techniques and to test it with the other grouping approaches in the literature to determine if WS84 approach was better, worse, or the same.
In this work, PCA approach decomposed the Machine-Part matrix into lower dimensional one. The objective of this work was also to test the effectiveness of dimensionality reduction by comparing the results obtained with those found in the literature. In this research, grouping efficacy was used as the main criteria for evaluating the quality of grouping.
To test the PCA method, a total ten problems was identified including the problem matrix for demonstration from the literature and based on the analysis it can be concluded that PCA approach is better in 70% of the problem through the measure of performance (grouping efficacy) and in 30% problem the proposed approach is as good as the best one using other algorithms in the cellular manufacturing.
Reference
Adil, G. K., & Ghosh, J. B. (2005). Forming GT cells incrementally using GRASP. International Journal of Advanced Manufacturing Technology, 26, 1402–1408.
Akturk, M.S., & Yayla, H.M. (2006). Management of product variety in cellular manufacturing systems. International Journal of Advanced Manufacturing Technology, 17, 93–117.
Allahverdi, A., Gupta, J.N.D., & Aldowaisan, T. (1999) A review of scheduling research involving setup considerations. Omega, 27(2), 219-239.
Ameli, M.S.J., & Arkat, J. (2008). Cell formation with alternative process routings and machine reliability consideration. International Journal of Advanced Manufacturing Technology, 35(7-8), 761-768.
Arkat, J., Saidi, M., & Abbasi, B. (2007) Applying simulated annealing to cellular manufacturing system design. International Journal of Advanced Manufacturing Technology, 32, 531–536.
Asokan, P., Prabhakaran, G., & Kumar, G.S. (2001). Machine-cell grouping in cellular manufacturing systems using non-traditional optimisation techniques – A comparative study. International Journal of Advanced Manufacturing Technology, 18, 140–147.
Atsma, W.J., & Hodgson, A.J. (1999). Inferring motor plan complexity using a modified principal component analysis. Engineering in Medicine and Biology, 21st Annual Conference,1, 533.
Balakrishnan, J., & Jog, P.D. (1995) Manufacturing cell formation using similarity coefficients and a parallel genetic TSP algorithm formulation and comparison. Mathematics and Computational Modeling, 21(12), 61–73.
Balasubramanian, K.N. & Panneerselvam, R. (1993). Covering technique-based algorithm for machine grouping to form manufacturing cells. International Journal of Production Research, 31(6), 1479-1504
Barbieri, P., Adami, G., Piselli, S., Gemiti, F., & Reisenhofer, E., (2002). A three-way principal factor analysis for assessing the time variability of freshwaters related to a municipal water supply.
Chemometrics and Intelligent Laboratory Systems, 62(1), 89-100.
Boctor, F.F. (1991). A linear formulation of the machine-part cell formation problem. International Journal of Production Research, 29(2), 343-356.
Boyer, K. K., Leong, G. K., Ward, P. T., & Krajewski, L. J. (1997). Unlocking the potential of advanced manufacturing technologies, Journal of Operations Management, 15(4), 331-347.
Burbidge J. L. (1963). Production flow analysis, The Production Engineer, 42(12), 742.
Carrie, S. (1973). Numerical taxonomy applied to group technology and plant layout. International Journal Production Research, 11(4), 399-416.
Chan, H.M. (1981). Design & Control of Cellular Manufacturing Systems, Ph.D. Thesis, University of Aston, Birmingham, U.K.
Chandrasekharan, M.P., & Rajagopalan, R. (1986). An ideal seed nonhierarchical clustering algorithm for cellular manufacturing. International Journal Production Research, 24, 451–464. Chu, C.H., & Tsai, M. (1990). A comparison of three array-based clustering techniques for
manufacturing cell formation. International Journal Production Research, 28(8), 1417-1433. Faber, Z., & Carter, M. W. (1986). A new graph theoretic approach for forming machine cells in
cellular production systems. Flexible Manufacturing Systems: Methods and Studies, New York, North Holland, 301-318.
Fahad, A., Canel, C., Khumawala, B. M. (2003). A simulation study of focused cellular manufacturing as an alternative batch-processing layout. International Journal of Production Economics, 83(2), 123-138
George, A. P., Rajendran, C., & Ghosh, S. (2003). An analytical-iterative clustering algorithm for cell formation in cellular manufacturing systems with ordinal-level and ratio-level data. International Journal of Advanced Manufacturing Technology, 22, 125–133.
Hachicha, W, Masmoudi, F, & Haddar, M.(2006).A correlation analysis approach of cell formation in cellular manufacturing system with incorporated production data. International Journal of Manufacturing Research, 1(3), 332 – 353.
Hachicha, W., Masmoudi, F., & Haddar, M. (2008). Formation of machine groups and part families in cellular manufacturing systems using a correlation analysis approach. International Journal of Advanced Manufacturing Technology, 36(11-12), 1157-1169.
Ham, I., & Hitomi, K. (1985). Group Technology Applications to Production Management. Kluwer-Nijhoff Publishing.
Han, C., & Ham, I. (1986). Multiobjective cluster analysis for part family formations. Journal of Manufacturing Systems, 5(4), 223-230.
Haykin, S. (2008). Neural Networks a Comprehensive Foundation, 2nd ed., Pearson Education, India, Delhi.
Heragu, S.S. (1994). Group Technology and Cellular Manufacturing. IEEE Transactions On Systems, Man, And Cybernetics, 24(2), 203
Horenko I, Dittmer E, & Schütte C. (2006). Reduced Stochastic Models for Complex Molecular Systems. Computing and Visualization in Science, 9(2), 89-102.
Hotelling, H. (1933) Analysis of a Complex of Statistical Variables into Principal Components. The Journal of Educational Psychology, 498-520.
Hyer, N., & Wemmerlov, U. (2002) Reorganizing the Factory: Competing Through Cellular Manufacturing. Productivity Press, pp 770
Iri, M. (1968). On the synthesis of loop and cutset matrices and related problems, In RAAG Memoirs.
Research Association of Applied Geometry, Japan 4 (A-XII):376-410.
Jawahar, N., Aravindan, P., & Ponnambalam, S. G. (1998). A Genetic Algorithm for Scheduling Flexible Manufacturing Systems. International Journal of Advanced Manufacturing Technology,
14, 588-607.
Jolliffe, I. T. (1986) Principal Component Analysis. New York: Springer, ISBN: 0-387-96269-7.
Kao, Y., & Fu, S.C. (2006) An ant-based clustering algorithm for manufacturing cell design. International Journal of Advanced Manufacturing Technology, 28,1182–1189.
Kao Y and Moon Y B (1997) Part Family Formation by Memory Association. International Journal of Advanced Manufacturing Technology 13:649-657
Khoo, L. P., Lee, S. G., & Yin, X. F. (2000). A prototype genetic algorithm-enhanced multi-objective
scheduler for manufacturing systems. International Journal of Advanced Manufacturing
Technology, 16, 131–138.
Kim, C.O., Baek, J.G., & Jun, J. (2005). A machine cell formation algorithm for simultaneously minimisingmachine workload imbalances and inter-cell part movements. International Journal of Advanced Manufacturing Technology, 26, 268–275.
King, J.R., & Nakomchai, V. (1982). Machine-component group formation in group technology: Review and extension. International Journal Production Research, 20(2), 117-133.
Kini, R. B., Taube, L. R., & Mosier, C. T. (1991). Part identification and group technology: A new approach. Journal Manufacturing Systems, 10(2), 136-145.
Kitaoka, M., Nakamura, R., Serizawa, S., & Usuki, J. (1999). Multivariate analysis model for machine-part cell formation problem in group technology. International Journal of Production Economics, 60-61, 433-438.
Kumar, K.R., & Chandrasekaran, M.P. (1990). Grouping efficacy: a quantitative criterion for goodness of block diagonal forms of binary matrices in group technology. International Journal Production Research, 28(2), 233–243.
Kusiak, A., & Chow, W.S. (1987) An efficient cluster identification algorithm. IEEE Transaction System, Man, Cybem, SMC-17(4), 696-699.
Kusiak, A. (1988) A knowledge based system for group technology. International Journal
Production of Research, 26(5), 887-904.
Kusiak, A. (1992). Similarity coefficient algorithms for solving the group technology problem,
Lei, D., & Wu, Z. (2006). Tabu search for multiple-criteria manufacturing cell design. International Journal of Advanced Manufacturing Technology, 28, 950–956.
Li, M.L. (2007). Efficiency measurement for multi-dimensional group technology. International Journal of Advanced Manufacturing Technology, 35, 621–632.
Love, D. (1996). The design of manufacturing systems. International Encyclopedia of Business and Management, 4, 3154-3174.
Luong, L., He, J., Abhary, K., & Qiu, L. (2002). A decision support system for cellular manufacturing system design. Computers & Industrial Engineering, 42(2-4), 457-470.
Mak, K. L., Wong, Y. S., & Wang, X. X. (2000) An adaptive genetic algorithm for manufacturing cell formation. International Journal of Advanced Manufacturing Technology, 16, 491–497. McAuley, I. (1972). Machine grouping for efficient production. The Production Engineer , 51(2),
53-57.
McCormick, W. T., Schweitzer, P. J., White, T. W. (1972). Problem decomposition and data reorganization by a clustering technique. Operational Research, 20, 992-1009.
Mosier, C. T., & Taube, L. (1985) The facets of group technology and their impact on implementation, OMEGA, 13(6), 381–391
Murugan, M., & Selladurai, V. (2007). Optimization and implementation of cellular manufacturing system in a pump industry using three cell formation algorithms. International Journal of Advanced Manufacturing Technology, 35(1-2), 135-149.
Muruganandam, A., Prabhaharan, G., Asokan, P., & Baskaran, V. (2005). A memetic algorithm approach to the cell formation problem. International Journal of Advanced Manufacturing Technology, 25, 988–997.
Offodile, F. (1991). Application of similarity coefficient method to parts coding and classification analysis in group technology. Journal of Manufacturing Systems, 10(6), 442-448.
Pai, P.F., Chang, P.T., & Lee, S.Y. (2005). Part-machine family formation using genetic algorithms
in a fuzzy environment. International Journal of Advanced Manufacturing Technology, 25, 1175–
1179.
Pearson, K. (1901). On lines and planes of closest fit to systems of points in space. Philosophical Magazine, 2, 559-572.
Prabhaharan, G., Muruganandam, A., Asokan, P., & Girish, B.S. (2005). Machine cell formation for
cellular manufacturing systems using an ant colony system approach. International Journal of
Advanced Manufacturing Technology, 25, 1013–1019.
Preisendorfer, R. (1988). Principal component analysis in meteorology and oceanography. Elsevier Science.
Rajagopalan, R., & Batra, J. L. (1975). Design of cellular production systems- A graph theoretic approach. International Journal Production Research, 13(6), 567-579.
Ravichandran, K. S., & Rao, K. C.S. (2001). A New Approach to Fuzzy Part-Family Formation in Cellular Manufacturing Systems. International Journal of Advanced Manufacturing Technology,
18, 591–597.
Rothenberger, M.A., Dooley, K. J., Kulkarni, U.R., & Nada, N. (2003). Strategies for Software Reuse: A Principal Component Analysis of Reuse Practices. IEEE Transactions on Software Engineering, 29(9), 825-837.
Saidi-Mehrabad, M., Safaei, N. (2007). A new model of dynamic cell formation by a neural approach. International Journal of Advanced Manufacturing Technology, 33, 1001–1009.
Seifoddini, H., & Wolfe, P.M. (1987). Application of the similarity coefficient method in group technology. IIE Transactions, 271-277.
Srinivasan, G., Narendran, T. T., Mahadevan, B. (1990). An assignment model for the part-families problem in group technology. International Journal Production Research, 28(2), 145-152.
Vakharia, A.J. (1986). Methods of cell formation in group technology: A framework for evaluation.
Journal Operational Management, 6(3), 257-271
Wall, M.E., Rechtsteiner, A., Rocha, L.M. (2003). A Practical Approach to Microarray Data Analysis, Kluwer: Norwell, MA, pp. 91-109,
Wei, N.-C., & Mejabi, O. O. (2008) A clustering approach for minimizing intercell trips in cell formation. Journal of Intelligent Manufacturing, 19, 13–20.
Wemmerlov, U., & Hyer, N.L. (1986). Procedures for the part-family/ machine group identification problem in cellular manufacturing. Journal Operational Management, 6(2), 125-147.
Witte, de J. (1980). The use of similarity coefficients in production flow analysis. International Journal of Production Research, 18(4), 503-514.
Wu, T. H., Low, C., & Wu, W.T. (2004) A tabu search approach to the cell formation problem
International Journal of Advanced Manufacturing Technology, 23, 916–924.
Yin, Y., Yasuda, K., & Hu, L. (2005). Formation of manufacturing cells based on material flows.
International Journal of Advanced Manufacturing Technology, 27, 159–165.