13JANUARY 2009
“SONAECOM”
C
OMPANY
R
EPORT
“TELECOMMUNICATION”
A
NALYST:
“PEDRO
MESQUITA” [email protected]
Recommendation: BUY
VALUATION
Our price target for Sonaecom is 1,64€, which corresponds to a potential upside of 53,27%.
BUSINESS UNITS
We continue to see a very competitive Portuguese telecom market, and do not expect Sonaecom’s position to change in upcoming years.
In our view there is a big divergence in operating performance, regarding Sonaecom’s business:
• In the mobile unit and after the rebranding of 2008 we expect profitability levels to increase, though with an anticipated ARPU decrease. This is the most profitability unit and accounts for 84% of total enterprise value.
• In the fixed unit, the outlook remains bleak and further competitive pressures are expected, with an expected decrease in the number of clients’ accesses. This unit worths 9,34% of total enterprise value .
• SSI, has been able to achieve a good set of financial and operational results and we expect this situation to continue in the future, geared on further international expansion. • Público, keeps facing the severe market dynamics for the
daily paid generalist in what advertising revenues and readership concerns and we expect this situation to continue.
We believe Sonaecom’s fibre project may represent a valuable opportunity, but for now there is big uncertainty regarding Portuguese regulator’s NGN decision.
Consolidation stills on agenda and we see potential synergies among Portuguese operator. We continue to see Sonaecom and Zon as the main candidates and we do not expect a hostile bid. .
Low scale, High uncertainty
Vs Recommendation BUY
Price Target FY09: 1.64 €
Vs Price Target 1,65 €
Price (as of 13-Jan-09) 1.07 €
Reuters: SNC.LS, Bloomberg: SNC.PL
52-week range (€) 3.14-0.925
Market Cap (€m) 392,25
Outstanding Shares (m) 366,2
Source:Bloomberg
Sonaecom vs PSI-20
02-01-08 02-05-08 02-09-08 02-01-09 Sonaecom PSI 20
Source:Bloomberg
(Values in € millions) 2007 2008E 2009E
Revenues 892,7 976,44 953,66
EBITDA 162 160,04 169,44
Net Profit 37,2 (12,32) 1,98
EPS 0,1 (0,03) 0,005
P/E 10,5 197 197
EV/EBITDA 6,2 6,4 6,0 EBITDA margin 18,1% 16,4% 17,8%
Source:Analyst Estimates
DISCLOSURES AND DISCLAIMER AT THE END OF THE DOCUMENT PAGE 1/30
Table of Contents
Valuation………..3
DCF………..………..3/4 Comparables………...………..5
Company Overview………..5
Shareholder structure………..6
Business Units………..7
Optimus……….………….………7
Sonaecom Fixed…………..………...17
Broadband……….……….19
Fixed Voice………..………...…21
Pay- TV……….………..……….22
FTTH………24
Público ………..25
SSI………..26
Consolidation……….27
Financial Statements……….………28/29
Valuation
We used a DCF for each business unit of Sonaecom and then through a sum of the
parts(SOTP) have reached our enterprise value. After that, using our estimated net
financial debt for 2009 we found our estimated equity market value and reached our final price target.
TABLE 1: VALUATION
EV Stake(%) Sonaecom's value Weight Criteria
€m
858,40 100 858,40 84,11% DCF
Optimus
95,35 100 95,35 9,34% DCF
Fixed Unit
3,65 100 3,65 0,36% DCF
Público
63,20 100 63,20 6,19% DCF
SSI
1020,61
Sonaecom's EV
420,06
Net Financial Debt
600,55
Equity Market Value
# shares (m) 366,20
1,64
Per share(€)
1,07
Current Price(€)
53,27%
Potential upside/downside Source:Analyst estimates
As for our main DCF assumptions, we did a 6 - year explicit estimation plus a normalized year for the termination value. Regarding our WACC assumptions, we have considered the following:
• We first have computed the unlevered beta for France Telcom, Telecom Italia, KPN , Portugal Telecom (PT) , Telefonica , Deutsche Telecom and Swisscom taking each of their capital structure into account. After we calculated their average and came out with our asset beta of 0,585. Next step was to calculate our levered beta (Equity beta) for Sonaecom, using the asset beta and Sonae’s capital structure at market values( 64% for Equity and 36% for Debt). Our final Beta used was of 0,91.
• Our risk free rate used was the10 year Bund yield, i,e. 3,75%. • Our cost of debt used was of 5,3%, which according to information
provided by Sonaecom, corresponds to the average interest rate supported by the group.
• Our Risk Premium used was of 5,5% and the tax rate used was 2,5%.
Our final cost of capital computed was of 7,2% , a value that was used for each business unit.
We have however considered, when computing the terminal value, different growth rates for each business unit. We have considered a 1% growth rate for Público, 1,5% for Optimus , 2,4 % for the SSI and of 2,2% for the fixed unit. When doing a valuation of a company, analysts very often make different assumptions that lead to different target prices. Our computed WACC was of 7,2%, but for example if we have computed the beta based on different companies, final result would be different.
In this sense, sensitivity analyses are a very useful tool, as they allow us to study how different assumptions would impact our final valuation. We have done five alternative scenarios:
TABLE 2: SENSITIVITY ANALYSIS
EV(€m) Price target €/share Diff. Vs base case WACC
837,87 1,14 -30,49%
8,10%
891,00 1,29 -21,34%
7,80%
949,86 1,45 -11,59%
7,50%
1020,61 1,64 0,00%
Base Valuation (7,2%)
1115,35 1,9 15,85%
6,80%
1201,75 2,13 29,88%
6,50%
Source:Analyst estimates
We can conclude that the WACC chosen by analysts will have a big impact in final outcome, as for a small variation in our base scenario such as a +3p.p ,final impact in share’s price will be of roughly 11,6%.
Multiples
Multiples are financial ratios that allow for a very direct and fast way of accessing a company value. Through comparison with its peers, investors have an immediate idea of which companies might be “cheap” within its sector. We believe it is important to choose companies that have similar activities, as well as similar exposure to risk and similar capital structure
TABLE 3: TELECOM OPERATORS MULTIPLES Mkt. Cap.(€m) EV/Revenues EV/EBITDA P/E
50.679 1,75 4,53 8,89
France Telecom
18.128 1,84 5,19 9,57
Telecom Italia
18.481 2,08 6,00 7,35
KPN
5.469 1,86 4,81 10,77
PT
18.170 2,43 5,54 10,04
Swisscom
47.626 1,50 5,54 33,09
Deutsch Telecom
75.139 2,15 5,15 11,23
Telefonica
Average 1,94 5,25 12,99
392 1,05 6,38 -
Sonaecom
Source:Analyst estimates and Bloomberg Year 2008
We consider that would be much interesting to gather a group of telecom “third-players” companies to compare with Sonaecom, but such scenario was not possible to accomplish, and our option was to compare it with the above telecommunications companies.
We can see that Sonaecom trades above its peers on the EV/EBITDA at 6,38x, while on the EV/Revenues Sonae is tradin below its peers at 1,05x.
We find the above results inconclusive, and believe this is not the best way to acess Sonaecom’s value.
Company overview
Sonaecom operates in the Portuguese telecom market and is a holding company that controls and actively manages a portfolio of companies, divided into three main business units: telco with its mobile and wireline division , SSI and media.
TABLE 3: SONAECOM’S BUSINESS UNITS
Sonaecom
Telco Mobile
Telco Fixed
Media
Software and
Systems
Source: Sonaecom
Sonaecom has two main shareholders, Sonae SGPS and France Telecom (FT), which together account for more than 70% of total shareholder structure. The third big shareholder is EDP, with a stake of 7,96% of total shares.
GRAPHIC 1: SONAECOM'S SHAREHOLDER STRUCTURE
Own Shares; 1,62% EDP; 7,96% Free Float; 17,44%
France Telecom; 20%
Sonae SGPS; 52,97%
Source: Sonaecom´s report
Sonaecom as a strategic partnership agreement with FT, that was recently renewed, under which FT has commited to provide strategic co-operation to Sonae’s telecom companies in four main areas: roaming and interconnection; multimedia services ;handset procurement and preferred network partner arrangements. EDP has already announced that is ready to sell Sonaecom’s position as soon as market conditions improve. Sonae SGPS is a Portuguese holding company with controlling interests in different businesses, which include besides its operations in Telecoms with Sonaecom , Sonae Distribuição(food and non-food retail) and Sonae Sierra (property, development and management of shopping centres) .
Business Units
Mobile Unit- Optimus
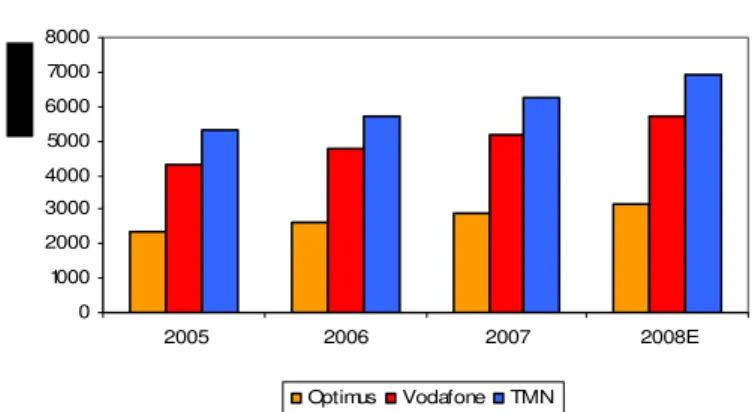
Optimus was launched in 1998 and is a Portuguese mobile operator that offers a wide range of mobile communication services both to residential and corporate segments. Optimus is the third mobile market player and has been able to maintain a stable market share through time in a very competitive market where there are two main players, TMN and Vodafone, which geared on a higher client base have been able to achieve better margins than Optimus. Sonaecom has been upgrading the whole network to 3,5G/UMTS technology and has almost total coverage of the national territory.
GRAPHIC 3: M obile Operat or's EBITDA margin
15,00% 20,00% 25,00% 30,00% 35,00% 40,00% 45,00% 50,00%
2005 2006 2007 2008E Opt imus Vodafone TMN
GRAPHIC 2: M obile Operat ors' Client s
0 1000 2000 3000 4000 5000 6000 7000 8000
2005 2006 2007 2008E
Optimus Vodafone TMN
Source: Companies reports and analyst estimates Source: Companies reports and analyst estimates
GRAPHIC 4: M obile M arket 3Q 08
Optimus; 20%
Vodafone; 36% TMN; 44%
Also, in the last quarter of 2008 a new MVNO has entered the market, Zon Mobile, which will start offering mobile voice and Internet. Zon Mobile has two pre-paid offers, one with a minimum monthly fee of €12.5 (Z-Simples) and another without minimum recharge obligations (Z-Livre). Calls will be charged by the second and they will have the same cost independently of the destination network. Additionally, the pricing plans will contemplate discounts for customers who already subscribe Zon services. Source: Sonaecom We do not anticipate significant changes in mobile market with Zon’s entrance
and have assumed in our model that Sonae will be able to keep its mobile market share at around 20% by 2013.
PAGE 8/30
Portuguese mobile market has experienced a significant growth for the last years, at a 7,3% compounded annual growth rate(CAGR)04-07 and had, according to the Portuguese regulator, ANACOM, 14,5 million subscribers at the end of 3Q08 with a mobile penetration rate of 137 per 100 inhabitants.
In our model we have assumed an expected CAGR 08- 13 growth of 3%.
GRAPHIC 5: Portuguese Mobile Market and Penetration Rate
12
,
GRAPHIC 6: Weighting of post-paid and prepaid cards in total number of subscribers
79, 1 % 78, 3 % 78, 2 % 76, 7 % 75, 5 % 75, 4 % 74, 8 % 17, 8 % 18, 5 % 19, 4 % 21, 5 % 23, 0 % 24, 2 % 25, 2 % 0% 20% 40% 60% 80% 100%
07 2Q07 3Q07 4Q07 1Q08 2Q08 3Q08 1Q
Pre-paid Cards Post-paid Cards
4 12, 4 12, 9 13 ,5 13,
7 14,3 14
,5 11 12 13 14 15
1Q07 2Q07 3Q
07 4Q 07 1Q 08 2Q 08 3Q 08 M illio n 100 110 120 130 140 s
Mobile subscribers Mobile penetration Source: ANACOM
The total number of subscribers is divided between pre-paid and post-paid subscribers, being that the main difference between these two kinds of services is that the post-paid subscribers sign a contract with their operator, while pre-paid do not. These two kinds of services have experienced different growth over the last year (30%YoY for post-paid compared to 7,4% for pre-paid) with post-paid cards’ weighting in total number of accesses rising, now representing 25% of the
total number of subscribers.
The growth of post-paid card can be associated with the sign up to UMTS network services, i.e. video-call or broadband data transmission, that typically involve the payment of a monthly charge.
Portuguese mobile market is one of the most penetrated markets in Europe and according to available information for the 2Q08, it registered a penetration rate of 134,9 per 100 inhabitants, which was above the EU average of 117,9 per 100 inhabitants.
GRAPH 7: Mobile Penetration Rate in European Countries (2Q 08)
0 20 40 60 80 100 120 140 160 Ital y Gre ece Lux em bou rg Po rtuga
l Cz ech Re pub lic Au stri a Fin lan d UK Sw ede n Ge rm any Den ma rk
Irela nd Sp ain Net herl and s Po lan d Be lgiu m Slo vaki a Hun gar y Fra nce
European Countries European Countries' Average
Source: ANACOM
We have, however, to distinguish between the nominal penetration rate indicated above, and the real one which is lower. Last available data released by the Portuguese regulator indicated a real penetration rate, which is perceived as the proportion of the population using mobile phone, of 89,7% for December 2007. The difference between the nominal and real penetration rates are due to:
• users that either for personal or professional reasons have more than one active card ; Anacom estimated that around 16% of users had 2 active cards, while 5% had 3 or more cards.
• cards used in machines , equipment and vehicles such as mobile payment terminals , alarm equipments ; No information was available regarding the weighting of this type of service in total accesses.
• cards used exclusively for UMTS network services, i.e. Internet access
and data services; Regarding this last topic, it is interesting to pay attention to the evolution of the
UMTS in the Portuguese market, as it has been registering a significant growth and already accounted for 27% of the mobile market at 3Q08 , compared with a weight of 20% at 3Q 07.
PAGE 10/30
In this quarter, and once again relying on information released by ANACOM, the number of users with access to UMTS services was of 3,9 million, being that the active users totalled 1,062. This represents a YoY growth of 79,3% .
GRAPH 8: UMTS vs Mobile Market Growth
0% 10% 20% 30% 40% 50% 60% 70%
1Q07 2Q07 3Q07 4Q07 1Q08 2Q08
Mobile Market growth Potential UMTS users Active UMTS users
Source: ANACOM
The UMTS penetration rate at the end of 3Q08 was of 37,4 per 100 inhabitants and according to available information , for the 2Q08 it stood above the EU average of 20,5 per inhabitant , with Portugal taking the third place.
Now, among the total number of UMTS possible users, the number of potential broadband users in 3Q08 was of 2,1 million being 1,015 million active. This represents a YoY growth of 78% for the total number and a growth of 112% in the active users of the mobile broadband.
GRAPH 9: Mobile Broadband evolution
0 1.000 2.000 3.000
Th
ou
4.000 5.000
1Q07 2Q07 3Q07 4Q07 1Q08 2Q08 3Q08
s
a
n
d
Active MB users Potential MB users Potential UMTS users
Source: ANACOM
500thousand people with a computer and mobile broadband and was divided into three different segments:
• e-escola, which grants a computer and mobile broadband for a total of 240thousand students in the 10th grade. Students with government subsidy do not pay any initial fee and pay 5€ per month for the mobile broadband, students with low aggregate pay 15€ without initial fee and the others pay an initial fee of 150 € and are charged 5 € less than market price for the broadband.
• e-professor, which grants a computer and mobile broadband to a total of 150 thousand teachers of primary and high school . The price charged for the broadband is 5 € below market for all offers and they also have to pay the initial fee of 150€.
th
• e-oportunidades, which started later on 11 ,June, 2008 and is available for participants of the “Novas Oportunidades” government programme.
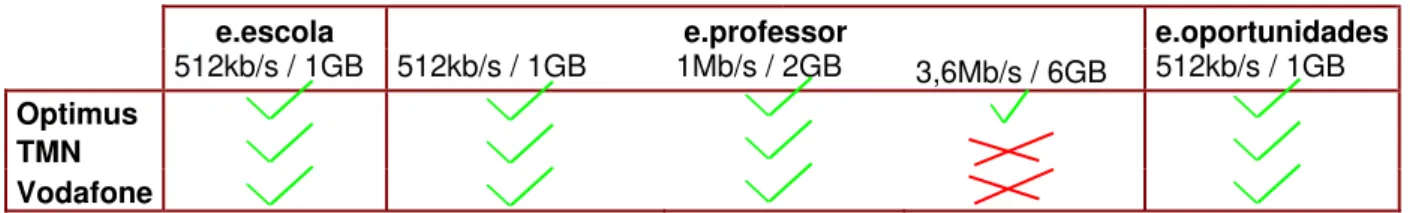
An initial fee of 150 € plus 15 € monthly for broadband is charged. All the three mobile operators have similar offers available for this government
programme, except for the 3,6Mb/s speed , which is only offered by Optimus. TABLE 4: Mobile Broadband Offers
e.escola e.professor e.oportunidades
512kb/s / 1GB 512kb/s / 1GB 1Mb/s / 2GB 3,6Mb/s / 6GB 512kb/s / 1GB
Optimus
TMN
Vodafone
Source: e-escolas web site
Under the contracts celebrated, the mobile broadband has to be paid for a period of 36months for the escola and professores, and of 12 months for the e-oportunidades. The market prices charged by the different operators are very competitive, which can be seen below with all offers being exactly the same:
TABLE 5: Mobile Broadband Prices
Prices(€) 22,31 Download 1Mbps/ Upload 384 Kbps
29,65 Download 2Mbps/ Upload 512 Kbps
39,56 Download 4Mbps/ Upload 1,4 Mbps
44,53 Download 7,2Mbps/ Upload 1,4 Mbps
Source: e-escolas web site
Available data released by the Portuguese government, says that since the beginning of the programme , a total of more than 350thousand computers with mobile broadband were delivered , being that roughly 70 thousand were inserted in the e.professores segment and for e.escola and e.oportunidades the number stood at around 140thousand. Already in 2008, government has announced a new programme, e-escolinhas, whose objective is to offer at lower prices a computer to 500thousand primary school students. The computers are called “Magalhães” and unlikely the other programmes mentioned above, the students are not obliged to adhere to mobile broadband. Last data available indicates that roughly 50 thousand computers were distributed, though no information was revealed concerning the number of mobile broadband subscription.
Considering that since the beginning of the programme (when the number of possible mobile broadband users was 1,183million) the number of possible users has experienced a YoY growth of 77% to a total of 2,1million in 3Q08, we can conclude that the e-initiatives were probably the main driver of this growth, as for a total of 918thousand adds to total possible mobile broadband users, roughly 350thousand or 38% were due to this government initiative. Doing the same analysis for active rather than potential users, for a total of 1,015million in 3Q08 and total YoY adds of 537 thousand the weight of the e-initiatives now rises to 65%. We believe that even if this last analysis may overstate the weight of e-initiatives as it is assuming 100% of active users, we believe that figures will not differ so much from reality as under the contracts celebrated in e-initiatives the mobile broadband adhesion is mandatory for a certain period of time and as so we expect users to access mobile broadband at least once, which is enough to consider them as active users.
The three Portuguese mobile operators, as part of the agreements celebrated with the Government to fulfil the obligations under the UMTS licenses, have to contribute with a total of 24,9 million to a Fund that will be managed by the state . The contribution of each operator will be of 8,3million.
Until now, only TMN has disclosed figures regarding its share in the e-initiatives programme. The operator announced that it distributed more than 210thousand computers, and as so as the leading position as it accounts for roughly 60% of total computers distributed.
We see the wireless market as a strategic one for Optimus, furthermore with the extremely competitive situation Sonaecom is facing in its fix unit, and as so we anticipate data revenues’ share to increase in the future and also the investment in network to continue. Until now, none of the operators has disclosed any detailed figures regarding their mobile BB offers, especially in what profitability levels concerns. Nevertheless, mobile BB is offered at a premium relatively to traditional fixed BB, which indicates that these services have a positive effect on margins.
TAG
Also 2008 saw the launch by the three operators of specific offers which allow free calls to be made between operators of the same network. Optimus was the first to launch this service, through their newly created concept targeted to young people, the TAG. This had a cost of 9million for Sonaecom. Besides free calls between TAGs, it also allows for free SMS , MMS , Video-calls and Messenger. The other operators followed with similar offers, TMN launched “moche” and Vodafone came out with YORN Power Extravaganza. These are all pre-paid offers, that allow for the same services though they have different prices.
• Optimus TAG ranges from 5€ for 15 days to a maximum of 60€ for 180 communication days. These fees are all consumable.
• Vodafone´s offer, is for a monthly charge of 9,91€, which are not consumable.
• TMN “moche” offer is for a monthly charge of 9,90€, which are not consumable.
This had obviously an impact on both the number of calls made by total mobile subscribers and also in the number of minutes, namely with an increase in intra-network traffic.
In 3Q08 the number of outgoing calls made saw a YoY increase of 8,2% to a total of 1,97billion calls and the number of incoming calls saw an increase of 7,6% to a total of 1,95billion with intra-network traffic being the segment that experienced the higher growth with a YoY increase of 10,4%.
Regarding the number of minutes, there was a YoY increase for outgoing traffic of 12,4% to a total of 1,043billion minutes in 3Q08, whereas the number of incoming minutes experienced 11,4% growth to a total of 4,057 billion for the
same period. Once again, the intra-net traffic was the one experiencing the higher growth rate with a YoY increase of 16% .
REGULATION-Steep Termination Rates Cut
Since Optimus entered the market in 1998, it had always faced performance restrictions vis-à-vis its main internal mobile competitors. With a smaller client base, it has always suffered from the network effects and also had high traffic imbalances, being a net payer to its competitors.
The common position released by the European Regulator Group (ERG) in Febuary 2008, recommends that national regulator authorities implement symmetrical termination rates, though it recognizes some exceptions that might justify asymmetrical prices during a transitory period.It finds three main situations that when occurring together may justify the introduction of asymmetric termination rates benefiting the smaller operator:
• High traffic imbalances resulting from price differentiation strategies regarding on-net and off-net calls from the bigger operators;
• MTR charged by operators above its real cost;
• National Regulator Authority considering that the benefits from an asymmetric transitory period are above the costs it may impose.
Anacom in its final decision released in June 2008, considered that these three conditions were applicable to Portuguese market, and as so considered adequate to implement an asymmetric transitory period, benefiting Optimus.
TABLE 6:NewPortuguese MTR
(€) TMN e Vodafone Optimus Asymmetry
0,11 0,11 0%
Before
0,08 0,096 20%
15-July-08
0,075 0,09 20%
01-October-08
0,07 0,084 20%
01-January-09
0,065 0,078 20%
01-April-09
0,065 0,072 11%
01-July-09
0,065 0,065 0%
01-October-09
Source: ANACOM
Regarding the first condition, in 2005 ANACOM had already identified its presence in the Portuguese market and had decided for a symmetrical cut in MTR. However, three years after the decision, ANACOM considers that TMN and Vodafone keep on benefiting from a profitable high traffic imbalance. The
regulator does not disclose information regarding on and off-net traffic, being only the final conclusions available. In what second condition is concerned, Portuguese MTR were in January 2008 the fifth highest in EU27 and were roughly 17 times bigger when compared with the Portuguese prices charged for fixed termination rates (the average for Europe is 10,57). Also, operators have offers that use the same 2G/3G network as mobile do and are currently charging termination rates equivalent to the fixed offers. Furthermore, in recent comments the EU commissioner for information society and media, Viviane Reding, has announced that MTR prices should follow to a 0,015-0,01€ range and considering that the real costs are in this range.
Finally, ANACOM also considers that the third condition is applicable though not revealing the total benefits expected by this decision. The regulator expects this decision to have impact on both the fixed and mobile market, and in final consumers. It has estimated the benefits of the MTR cuts in the fixed-mobile calls in 67million, being that 17million will be in 2008 and the remaining in 2009.
In a market where, according to a survey done by Anacom in December, 2006 the main factor taken into account when choosing a mobile operator is the network (44,6%), Optimus will in our opinion, always suffer from its late entrance into the market and from its smaller client base.
What we anticipate…
Now that we have introduced the mobile market and have identified the main events that we believe will have greater impact on Optimus ( UMTS as the driver for mobile market growth, with post-paid cards increasing its weight in total accesses; TAG as the main driver for minutes per user growth ; MTR cuts with impact both on operators revenues and interconnection costs), it is now time to study them into further detail:
TABLE 7 :Optimus P&L
2008e 2009e 2010e 2011e 2012e 2013e
€m
Optimus Clients(k) 3165,34 3325,59 3426,10 3528,88 3634,75 3743,79
MOU 129,10 136,38 139,79 143,64 145,80 147,98
ARPU 16,27 15,08 14,67 14,22 13,98 13,76
Clients ARPU 12,44 11,70 11,46 11,35 11,08 10,95
Operator ARPU 3,83 3,37 3,21 2,87 2,90 2,81
Data Revenue(% of total revenues) 21,50 23,00 24,50 26,00 27,50 29,00 635,72 637,38 642,32 646,49 655,03 664,38 Total Revenues
Client Revenues 452,66 461,37 467,84 480,54 483,30 491,97 Operator Revenues 139,36 133,01 130,83 121,66 126,55 126,32
523,82 502,38 506,29 510,27 515,92 521,67 Operational Costs
146,80 167,00 167,53 168,92 172,01 175,70 EBITDA
EBITDA margin 23,09% 26,20% 26,08% 26,13% 26,26% 26,45% Source:Analyst estimates
We expect operational ARPU to be directly impacted by the referred MTR cuts and the downward trend concerning terminal rates. We have estimated that MTR cuts will bring a benefit of roughly 1€m per month during the asymmetric transition period. These benefits will result from the reduction on interconnection fees paid to operators.
We anticipate clients ARPU to continue on its decreasing trend, as we assume further competition in the mobile segment.
Optimus has incurred in big costs with its rebranding campaign during 2008 and as a consequence seen its profitability levels hurt. We expect this situation to be overcome in the future with a costs cut in Marketing& Sales that we have assumed to be of 20% , from 88,20€m on 2008 to 68,64€m on 2009.
All in all we expect profitability margins to increase geared, on one hand on the client growth and on the other hand, in an increase in data revenue’s share.
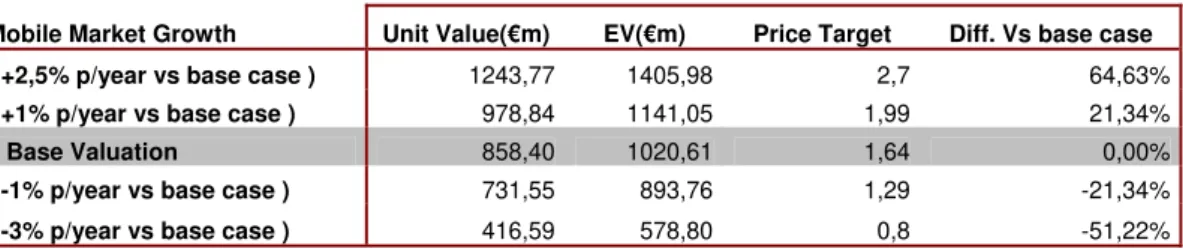
TABLE 8: SENSITIVITY ANALYSIS
Mobile Market Growth Unit Value(€m) EV(€m) Price Target Diff. Vs base case ( +2,5% p/year vs base case ) 1243,77 1405,98 2,7 64,63%
( +1% p/year vs base case ) 978,84 1141,05 1,99 21,34%
Base Valuation 858,40 1020,61 1,64 0,00%
( -1% p/year vs base case ) 731,55 893,76 1,29 -21,34%
( -3% p/year vs base case ) 416,59 578,80 0,8 -51,22%
Source:Analyst estimates
Client ARPU Unit Value(€m) EV(€m) Price Target Diff. Vs base case
( +2,5% p/year vs base case ) 982,02 1130,18 1,98 20,73%
( +1% p/year vs base case ) 907,84 1056,00 1,78 8,54%
Base Valuation 858,40 1006,56 1,64 0,00%
( -1% p/year vs base case ) 808,95 957,11 1,51 -7,93%
( -3% p/year vs base case ) 710,05 858,21 1,24 -24,39%
Source:Analyst estimates
Operator ARPU Unit Value(€m) EV(€m) Price Target Diff. Vs base case
( +2,5% p/year vs base case ) 882,89 1039,67 1,73 5,49%
( +1% p/year vs base case ) 863,02 1019,80 1,68 2,44%
Base Valuation 849,78 1006,56 1,64 0,00%
( -1% p/year vs base case ) 836,53 993,31 1,61 -1,83%
( -3% p/year vs base case ) 810,04 966,82 1,53 -6,71%
Source:Analyst estimates
Our sensitivity analysis shows that mobile market growth, which is reflected in our model through a impact on Optimus clients, is the main variable to take into account as small deviations from the base case lead to considerable changes in our valuation. This shows the big dependence that Sonaecom has on its mobile unit, and is maybe one of the reasons that help to explain why this unit is currently the focus of the group.
We can also see that ARPU levels have an important role, especially if we consider the uncertainty around MTR rates already mentioned.
Wireline Business
In our opinion, to fully understand the Portuguese wireline market and before entering further detail, it is worth going back in time to 2007 and analyse what has happened since then.
We believe significant changes have happened during the last year and market dynamics have changed since the spin-off of PT-Multimédia (PTM) from Portugal-Telecom (PT) as a sequence of Sonaecom’s failed hostile bid over PT. At the time, we had clearly a strong player both in the fixed line and in the broadband, PT, while in the pay TV we had PTM with a strong competitive position. As so, PT Group accounted for roughly 2/3 of the Portuguese wireline market.
PAGE 18/30
GRAPHIC 11:Broadband Market 3Q 07
AR Telecom 0,80% Sonaecom;
15,60%
PT ; 69,40% Others; 4,70%
Cabovisão; 10,30%
2,10% Vodafone
0,20%
PT TV TEL Cabovisão Sonaecom AR Telecom Vodafone Others
~ GRAPHIC 10:Fixed Voice Market 3Q 07
PT; 72,60% Sonaecom;
17,50% ONITelecom;
1,90%
Cabovisao; 6,40%
Vodafone; 1,10% Others; 0,50%
PT Sonaecom Cabovisao ONITelecom Vodafone Others
Following the spin-off, and going back to current times, we can now see ZON Multimédia (former PTM) with aggressive promotions in the fixed line and Internet which were areas less exploit in the past , and at the same time PT with aggressive promotions in the Pay-TV services which was an area that it did not have in the past . We believe the market has gone through a change and while in the past we had operators “specialized” in one service offer, in current days we see a trend for operators to offer bundles , two-play or triple-play offers , and all with very aggressive promotions. In a 2006 ICP-ANACOM survey, it identified that more 50% of clients of fixed broadband acquired this service as a dual-play bundle. These bundle offers make, in our opinion, part of a client retention strategy as these offers allow for a lower churn rate.
Regarding this, Zon’s view is that for a single TV offer the churn is of 100 while of 62 for TV+Net and 26 for TV+Net+Voice. In a 2006 ICP-ANACOM survey, it identified that more than 50% of clients of fixed broadband acquired this service
as a dual-play bundle.
Sonaecom operates under two brands, Clix (for residential customers) and Novis (business and wholesale market) which, besides providing broadband internet through direct offers based on ADSL+2 technology , also offers IPTV and Home- Video-Services.
PAGE 19/30
In June 2007, Sonaecom agreed on the acquisition of the residential client base of both OniTelecom and Tele2, which has increased Sonaecom’s direct and indirect services.
A brief description of the Portuguese wireline market follows below:
Broadband
The Portuguese fixed internet service experienced a CAGR05-07 of 9,6% and registered in the 3Q 08, according to the Portuguese regulator, a total of 1,64
million customers, being that roughly 1,6 million (97% of total accesses) of the accesses are done using broadband services while dial-up accesses continue to steeply fall(-56,9% YoY) to a total of 45,5 thousand accesses. Among the broadband technologies, ADSL is the most used with PT, Sonaecom and Vodafone offers using this technology, for a total of 58,1% of the total broadband customer base , while Zon and Cabovisão offers are through cable access for a share of 40,4%. The remaining 1,5 % include technologies such as
Fixed wireline access (FWA) which is used by AR TELECOM and leased lines. Total active customers were 98,4% of all fixed broadband customers.
GRAPH 12:Broadband Market 3Q 08
PT 41%
ZON 28% Cabovisao
10% Vodafone
2%
SNC 14%
TVTel 2%
Others 3%
PT ZON SNC Cabovisao Vodafone TVTel Others
Source: ANACOM
The penetration rate of the fixed Internet access service was of 14,8 on 2Q08, which according to information provided by OECD , was below the 24,4 per 100
inhabitants. At the end of 3Q 08, penetration rate stood on 15,1 per 100
PAGE 20/30
GRAPH 13: Broadband customers' evolution
0 500 1.000 1.500 2.000 2.500
1T07 2T07 3T07 4T07 1T08 2T08 3T08
Tho
us
a
n
d
Fixed Broadband users Mobile Broadband users
Fixed and mobile broadband experience different growth rates and it is interesting to see their evolution over time.
Source: ANACOM
As already mentioned, there were 2,1 million potential internet mobile users in 3Q08, 1,015 million being active , but information regarding the weights of “datacard”, “smartphones” and PDA usage on total mobile broadband is not disclosed by the regulator . We do not see the smartphone and PDA as direct substitutes of fixed broadband because of their limitations on data capacity and also due to their small dimension. On the other hand, mobile broadband can be seen as a substitute for fixed broadband, even if it has limited coverage and prices are not competitive when compared with the fixed broadband offers:
• CaboVisao is currently offering four different speeds for the fixed broadband: 3Mb at 17,99€; 10Mb at 23,99€ ; 20Mb at 32,99€ and 30 Mb at 44,99€.
• Sonaecom has double play offers ( broadband + fixed telephone), with three different speeds: 2 Mb at 14,99€ ; 12Mb at 29,65€ and 24Mb at 39,57€.
• Zon has five different speed offers: 2Mb at 14,99€ ; 4Mb at 19,82€ ; 8Mb at 24,78€ ; 18Mb at 35,30€ ; 30Mb at 59,49€. • PT has three fixed broadband offers: 4Mb at 19,82€; 8Mb at 24,70€ and
24Mb at 35,28€.
• Vodafone has two double play ( broadband + fixed telephone) offers :
12Mb at 19,9€ and 24Mb at 24,9€. We believe that even having price disadvantage, mobile offers may be attractive
FTTx(network architecture that uses optical fibre) and when the new fibre offers come into market the speed offered by mobile broadband will no longer be so attractive.
Bottomline, we admit there might be a substitution effect between fixed and mobile broadband in the short-term though seeing them as complementary when looking forward.
Fixed Voice
According to the regulator, the total number of telephones installed at customer request at the end of 3Q08 was roughly 4 million which represented a penetration rate of approximately 37,9 per 100 inhabitants. The CAGR05-07 for the total
number of telephone installed at customer request was of -0,6%. and had at the end of 3Q08 a negative growth of 1,1% since the beginning of the
year.
GRAPH 14 :Fixed Voice Market 3Q 08
PT; 69,00% Vodafone;
1,50%
ONITelecom; 1,70%
ZON; 2,80%
Sonaecom; 16,90%
Others; 8%
Cabovisao; 7%
Regarding market shares of total accesses at customer request, PT has seen a decline of 25,5p.p since 2004 though continuing to be the main market player with approximately 69% of market share, while Sonaecom appears as the strongest alternative provider with 16,9%. Cabovisão with a 7% of market share appears as the third player followed by Zon/TV Cabo with 2,8% , OniTelecom with 1,7% and Vodafone with 1,5%.
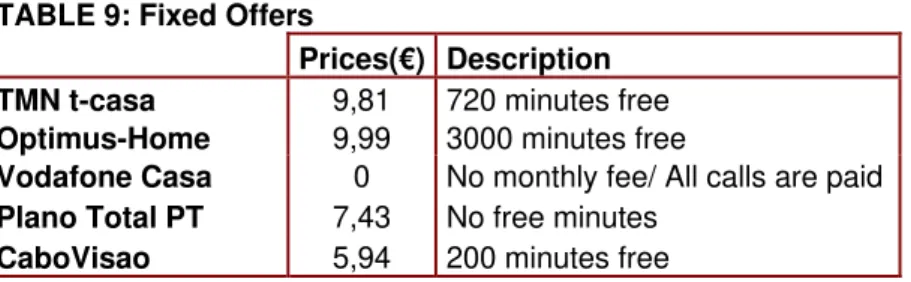
All the Portuguese mobile operators have fixed offers that use GSM technology (Vodafone Casa; Optimus Home and TMN t-casa), which had seen in 3Q08 a considerable expansion with a YoY growth of 20,2%. The growth of GSM based products, along with a decline in the use of traditional fixed telephone service , the growth of packaged offers by cable and Internet operators and also the development of offers using VoIP technology (namely by Zon Multimedia), seem to be the main drivers to the declining trend of PT share in total accesses. TABLE 9: Fixed Offers
Prices(€) Description 9,81 720 minutes free TMN t-casa
9,99 3000 minutes free Optimus-Home
0 No monthly fee/ All calls are paid Vodafone Casa
7,43 No free minutes Plano Total PT
5,94 200 minutes free CaboVisao
Source: Companies web site
Also in the fixed voice market, it is interesting to notice the falling trend seen for the indirect access which had a YoY fall of about 45% in the end of 3Q 08 to a
PAGE 22/30
total of 220,9 thousand indirect accesses while direct accesses and Voip
accesses experienced a YoY of 0,8% and 38,8% respectively. Indirect accesses allow customers from one operator to choose from which line
they will make a call by just dialling a short-access code that corresponds to another operator. Tele2 operated under an indirect access business model, and since its acquisition by Sonaecom in 2007 clients are being transferred to direct accesses, which is also contributing to overall indirect accesses decline.
Pay-TV
GRAPH 15: Pay-Tv Market 3Q 08
ZON; 71,10%
Others; 2,80% TVTel
3,10%
PT 9,50%
Cabovisão 13,50%
Total number of Pay-Tv suscribers amounted to 2,2 million in the end of 3Q08 , which, according to regulator, represented a penetration rate of 20,9 per 100 inhabitants and 39,6% of total cabled households . Regarding the technologies used, cable TV distribution remains the most used (76%) followed by DTH(25,3%) and other technologies(7,4%).
Pay-TV market is clearly dominated by a bigger player, Zon, with around 7 in every 10 subscribers of the whole market and where PT appears as the new operator and experiencing the highest growth pace among operators. Cabovisão is the second player, while Sonaecom has a very small market share and as well as PT, is able to offer Pay-TV to its clients in areas with ADSL2+. Zon operates under its cable offers.
Source: ANACOM
• Zon has the widest Pay-TV coverage with more than 2,7 millions of home passed and roughly 1,6 million subscribers. Regarding its offers (not considering offers with premium channels included), they have options that go from 15,85€ for 18channels to 28,24€ for 93 channels. • Sonaecom offers Pay-TV packages to unbundled households with
triple-play capability. Sonae has unbundled 56% of total ADSL2+ lines of which 72% have triple-play capability. Its offers go from 18,35€ for 51channels to 34,21€ for 100channels.
• PT offers its Pay-TV packages to the areas with ADSL2+. It only has bundle offers all containing 45 channels, that go from a double-play(TV +
voice) at 29,90€ to triple-play(TV+Internet16Mb+ Voice) at 49,54€. • Cabovisão is able to offer its services to roughly 900thousand
households and has three different single-play offers: 38channels at 18,83€, 47 channels at 23,79 and 76channels at 28,75€.
joint-venture between Zon Conteudos and Sportinveste, is an example of this wholesale activity and is sold to operators such as PT, Cabovisão or Sonaecom.
What we anticipate…
TABLE 10 :Fixed Unit P&L
2008e 2009e 2010e 2011e 2012e 2013e
€m
Total accesses 644477 603032 593416 594306 594178 591365 290 265 255 249 266 291 Total Revenues
Direct access 123,08 121,05 117,30 109,24 97,58 86,22 Indirect access 46,86 21,85 10,71 5,25 2,57 1,26
Fibre access 3,80 5,77 8,60 12,31 28,60 47,50
10,19 1,30 3,69 7,68 32,56 62,54 EBITDA
EBITDA margin 3,52% 0,49% 1,45% 3,09% 12,26% 21,47%
Source : Analyst Estimates
Regarding our estimations for the wireline business, we expect further aggressive promotions by Sonaecom’s competitors with lower prices in all the voice, broadband and pay-tv segments which will have an impact in Sonaecom’s profitability. These aggressive promotions will in our opinion, lead to lower ARPUs and a higher customer churn in the future.
We also expect that indirect customer revenues will follow the already explained market trend and will decrease. Direct customers revenues are expected to follow, as we have assumed that ARPU will decrease for the upcoming years and also that direct clients will gradually adhere to Sonae’s fibre offers.
Margins will in our opinion gradually rise, as soon as fibre deployment evolves and clients start to move to fibre offers that allow for greater ARPU and reduced operational costs.
We anticipate a slowdown in the expansion of the ULL network and thus of its ULL addressable market , and believe the focus will now be on avoiding churn and protecting its clients base rather than entering lowering margins to try to gain market share.
FTTH
In February 2008 Soanecom has announced a three year investment plan of 240€m for the deployment of a Next Generation Fibre Network targeted at
covering 1 million homes and approximately 25% of the Portuguese population. We believe this announcement will have wider implications for the Portuguese
telecom market and represents a strategic shift for the company. In our opinion there are three main reasons that led Sonaecom to the fibre deployment project: • The particular competitive conditions of the Portuguese wireline market, with competitors being very aggressive in the triple player offers and that led to a deteriorating performance of Sonaecom’s wireline division and client churn. Actually, there is a big “overlap” between the areas in which fibre will be deployed and the existing ULL offer, which we believe is a strategic way to transfer clients from ULL to the fibre by just doing an up-selling of TV and as so offering 3play.
• Also, Sonaecom operates under PT’s copper line, and roughly half of its operational costs are spent with interconnection fees. Having its own wireline structure will avoid rental costs with local loop connection being that the only costs that Sonaecom will have to pay to the incumbent are the ones related with conduct access.
• Lastly and in our opinion the main reason behind the decision, we view it as a “political” decision. The fact that Sonaecom starts the fibre deployment and is ready to open its structure before an ANACOM decision about NGN, is somewhat a way to put pressure on the regulator. PT doesn’t want to be forced to open its structures and has announced that it won’t start its fibre deployment until a decision comes out. Final decision is expected to come at the end of January 2009. In our valuation of the project we considered:
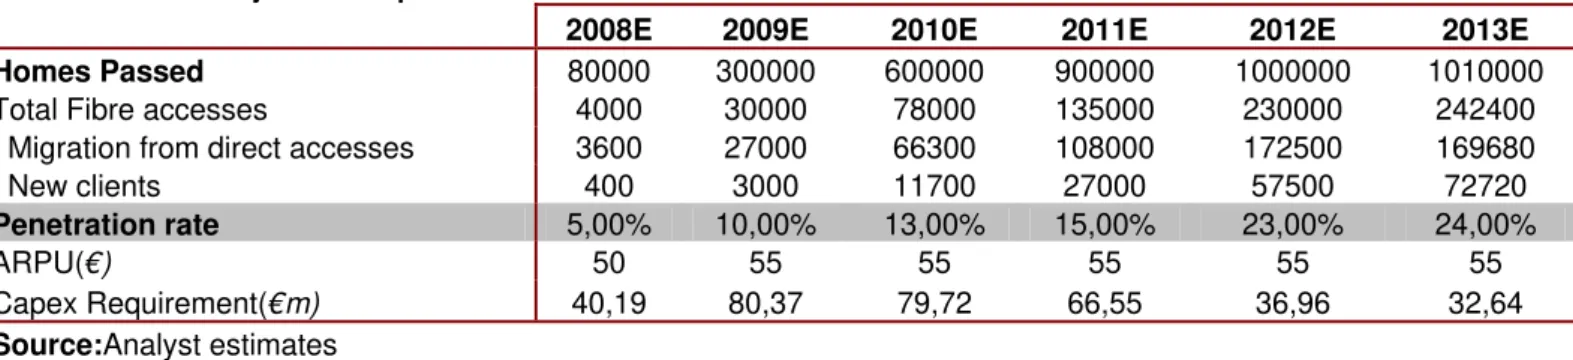
TABLE 11: Fibre Project Assumptions
2008E 2009E 2010E 2011E 2012E 2013E
80000 300000 600000 900000 1000000 1010000 Homes Passed
Total Fibre accesses 4000 30000 78000 135000 230000 242400
Migration from direct accesses 3600 27000 66300 108000 172500 169680
New clients 400 3000 11700 27000 57500 72720
5,00% 10,00% 13,00% 15,00% 23,00% 24,00% Penetration rate
ARPU(€) 50 55 55 55 55 55
Capex Requirement(€m) 40,19 80,37 79,72 66,55 36,96 32,64
Source:Analyst estimates
We believe the addressable market is very limited and while fibre is being deployed, ZON and PT keep on strengthening their position. Despite this, we consider that in the long-term the fibre will allow for better margins, and as so we view the project as a value creating one. Our estimated NPV for the project was of 48,2€m .Our estimations for the Sonae’s fixed unit, already take into account the fibre project.
Considering the financing of the project, we believe it will be done with the cash-flow from other business units as well as the use of credit lines already hired (at the end of 3Q08 there were 125m cash).
Already in 2009 , Portuguese government announced the New Generation Networks (NGN) and the telecommunications sector as a priority and strategic sector for the Portuguese economy. The government compromised itself to create a credit line of 800€ million available for all operators that may want to invest in NGN, and in exchange asked operators to accelerate investment and create conditions for during 2009 the number of subscribers using fibre networks reaching 1,5million ( Previously the target was 1million for 2010).
If we consider that the weight of the Portuguese telecommunications sector in total GDP is of 5% while European average stands at 2%, we can immediately understand the importance and government commitment regarding this subject.
Público
Público is a reference newspaper of the Portuguese media sector and was launched 15 years ago. Despite Público average market share being growing since last year, it keeps on facing the severe market dynamics for the daily paid generalist in what advertising revenues and readership concerns.
We do not anticipate things to become better in the future, furthermore with the deteriorating macro-economic conditions expected for the years to come, and that may lead to further cuts in advertising budgets from companies.
We believe that Sonae will not proceed to acquisitions in this sector, though we think it could improve Público’s margins as fixed costs would now be diluted.
TABLE 12: Público P&L
2008e 2009e 2010e 2011e 2012e 2013e
€m
33,14 33,42 33,54 33,96 34,37 34,79 Total Revenues
-2,80 -2,44 -2,09 -1,47 -0,86 -0,24 EBITDA
EBITDA margin -8,45% -7,29% -6,23% -4,33% -2,51% -0,68% Source:Analyst estimates
SSI
Sonaecom’s systems integration business, SSI, has been able to achieve a good set of both operational and financial results and is quickly managing to recover
from the costs incurred with the acquisitions made in 2007. It includes companies such as WeDo, Bizdirect, Mainroad, Saphety and Cape
Tecchnologies.
• WeDo is a provider of systems integration products and consultancy; • Bizdirect is a provider of eSourcing and eProcurement to commercial
business solutions;
• Mainroad operates in information technology;
• Saphety is a provider of trusted services , like electronic invoice and secure messaging;
• Cape Technology operates in information systems for the telecommunications industry.
Looking forward, we expect WeDo to keep on with its international expansion and leading position in the international Revenue Assurance market and the overall SSI to increase its profitability margins.
TABLE 13: SSI P&L
2008e 2009e 2010e 2011e 2012e 2013e
€m
116,78 115,72 116,59 118,59 118,98 119,40 Total Revenues
7,61 7,48 4,31 4,65 4,84 4,75 EBITDA
EBITDA margin 6,52% 6,47% 3,70% 3,92% 4,07% 3,98%
Source:Analyst estimates
Consolidation
Speculation about potential consolidation is one of the top issues of the Portuguese telecom market and despite the past failed of Sonaecom’s bid for PT, we still believe consolidation is possible in Portugal.
In our opinion, there is room for value creation among the current players, and we believe the largest candidates for consolidation are Sonaecom and ZON. Currently we view Sonaecom with very limited growth opportunities and consider that non-organic growth would be the only solution to overcome this situation. Despite their different access technologies may be an issue, as Sonaecom uses ULL over copper for broadband access while ZON uses coaxial cable, in our opinion there is room for potential synergies.
We do not expect an hostile bid and recent words from Sonae’s management makes us believe that Sonaecom will not bid for ZON without management agreements. Furthermore, we have to keep in mind that Zon’s shareholders are the same who rejected the bid for PT over the past, so we do not expect a positive reaction from them and so do not expect consolidation to happen in a short-term.
PAGE 28/30
Financials
TABLE 14: Sonaecom's P&L
€m 2008e 2009e 2010e 2011e 2012e 2013e
Turnover(consolidated) 976,44 953,66 950,57 950,83 974,38 1006,96 Optimus 635,72 637,38 642,32 646,49 655,03 664,38 Sonaecom Fixed 289,74 264,57 255,24 248,94 265,55 291,28
Público 33,14 33,42 33,54 33,96 34,37 34,79
SSI 116,78 115,72 116,59 118,59 118,98 119,40
Cons. Adjustments -98,93 -97,44 -97,12 -97,15 -99,55 -102,88 EBITDA (consolidated) 160,04 169,44 169,60 174,88 196,77 233,37 Optimus 146,80 167,00 167,53 168,92 172,01 175,70
Sonaecom Fixed 10,19 1,30 3,69 7,68 32,56 62,54
Público -2,80 -2,44 -2,09 -1,47 -0,86 -0,24
SSI 7,61 7,48 4,31 4,65 4,84 4,75
Cons. Adjustments -1,76 -3,91 -3,85 -4,90 -11,78 -9,39
EBIT 1,89 19,44 19,95 30,00 52,38 90,19
Financial Results -18,32 -16,80 -17,20 -17,50 -17,30 -16,80
EBT -16,43 2,64 2,75 12,50 35,08 73,39
Income taxes -4,11 0,66 0,69 3,13 8,77 18,35
Net Profit -12,32 1,98 2,07 9,38 26,31 55,04
Source:Analyst estimates
TABLE 15: Sonaecom's Balance Sheet
€m 2008e 2009e 2010e 2011e 2012e 2013e
Total Assets 1841,47 1902,16 1967,42 2001,39 2014,41 2022,37
Tangible&Intangible Assets 815,00 880,33 943,85 974,16 980,07 981,51
Cash&Equivalent 10,00 8,00 7,00 7,00 7,00 7,00
Accounts Receivable 200,35 195,22 193,43 194,35 195,86 200,62
Other Assets 790,39 792,00 792,00 792,00 792,00 792,00
Equity+Minority 923,06 925,06 927,14 936,62 965,28 1020,32
Shareholder´s Equity 922,28 924,26 926,33 935,70 964,08 1019,12
Minority Interests 0,78 0,80 0,82 0,91 1,19 1,19
Total Liabilities 922,65 981,32 1042,45 1064,70 1047,02 998,25
Financial Liabilities 375,60 428,06 476,67 486,12 452,42 391,19
Current bank loans 0,08 0,09 0,10 0,11 0,10 0,09
Non-current bank loans 375,52 427,96 476,56 486,01 452,32 391,11
Suppliers 211,07 202,23 199,38 198,66 198,42 198,22
Others 335,98 351,03 366,40 379,92 396,18 408,84
Net debt(cash) 365,60 420,06 469,67 479,12 445,42 384,19
PAGE 29/30
TABLE 16:Sonaecom's Cash Flow Statement
€m 2008e 2009e 2010e 2011e 2012e 2013e
EBIT 1,89 19,44 19,95 30,00 55,14 90,19
Taxes on EBIT 0,47 4,86 4,99 7,50 13,78 22,55
Depreciation 158,15 148,59 149,65 144,88 144,39 143,18
Changes in NWC -91,32 1,71 0,06 1,65 1,75 4,97
Capex 206,90 213,93 213,16 175,19 150,30 144,62
FCF 43,99 -52,46 -48,61 -9,45 33,70 61,23
Source:Analyst estimates
TABLE 17: FINANCIAL RATIOS
PER SHARE DATA (€) 2007 2008E 2009E 2010E 2011E 2012E 2013E
EPS 0,10 -0,03 0,005 0,01 0,03 0,07 0,15
BVPS 2,55 2,52 2,52 2,53 2,56 2,63 2,78
PERFORMANCE RATIOS
Sales growth 9% -2% 0% 0% 2% 3%
EBITDA growth -1% 6% 0% 3% 13% 19%
EBIT growth -91% 927% 3% 50% 75% 72%
Net profit growth -133% -116% 4% 354% 181% 109%
PROFITABILITY RATIOS
EBITDA margin 18,1% 16,4% 17,8% 17,8% 18,4% 20,2% 23,2%
EBIT margin 2,5% 0,2% 2,0% 2,1% 3,2% 5,4% 9,0%
ROE 4,0% -1,3% 0,2% 0,2% 1,0% 2,7% 5,4%
Payout 0,0% 0,0% 0,0% 0,0% 0,0% 0,0% 0,0%
LEVERAGE INDICATORS
Net Debt/ Capital Employed 23,3% 25,8% 28,2% 30,2% 30,1% 27,9% 23,9%
Net Debt / EV 22,0% 35,9% 41,2% 46,1% 47,0% 43,9% 37,9%
Total Debt / Total Assets 46,8% 50,1% 51,6% 53,0% 53,2% 52,1% 49,5% Net Debt / Market Cap - 93,3% 107,2% 119,8% 122,3% 114,2% 98,6%
Net Debt / EBITDA 1,9x 2,3 2,5 2,8 2,7 2,3 1,7
VALUATION
P/E 10,5 -31,8 197,9 189,6 41,8 14,9 7,1
Dividend Yield 0,0% 0,0% 0,0% 0,0% 0,0% 0,0% 0,0%
EV / Sales 1,1 1,0 1,1 1,1 1,1 1,0 1,0
EV / EBITDA 6,3 6,4 6,0 6,0 5,8 5,2 4,4
EV/EBIT 46,3 538,1 52,4 51,1 34,0 19,5 11,3
Disclosures and Disclaimer
Research Recommendations
Expected total return (including dividends) of more than 10% over a 12-month period.
Buy
Expected total return (including dividends) between -10% and 10% over a 12-month period.
Hold
Expected total return (including dividends) of -10% or worse over a 12-month period.
Sell
This report has been prepared by a Masters of Finance student following the Equity Research track within the Integrative Work Project for exclusively academic purposes. Thus, the author is the sole responsible for the information and estimates contained herein and for the opinions expressed, which exclusively reflect his/her own personal judgement. All opinions and estimates are subject to change without notice. NOVA or its faculty accepts no responsibility whatsoever for the content of this report nor for any consequences of its use. The information contained herein has been compiled by students from sources believed to be reliable, but NOVA or the students make no representation that it is accurate or complete and accept no liability whatsoever for any direct or indirect loss resulting from the use of this report or its content.
The author hereby certifies that the views expressed in this report accurately reflect his/her personal opinion about the subject company and its securities. He/she has not received or been promised any direct or indirect compensation for expressing the opinions or recommendation included in this report.
The author of this report may have a position, or otherwise be interested, in transactions in securities which are directly or indirectly the subject of this report.
NOVA may have received compensation from the subject company during the last 12 months related to its fund raising program. Nevertheless, no compensation eventually received by NOVA is in any way related to or dependent on the opinions expressed in this report.
The School of Economics and Management at NOVA is a public university thus not dealing for, advising or otherwise offering any investment or intermediate services to market counterparties, private or intermediate customers.
This report may not be reproduced, distributed or published without the explicit previous consent of its author, unless when used by NOVA for academic purposes only. At any time, NOVA may decide to suspend this report reproduction or distribution without further notice.