Autores
Giselly Rosa Modesto Pereira1
Jorge Paulo Strogoff-de-Matos1
Frederico Ruzany2 Sergio Fernando Ferreira dos Santos2
Eufrônio D´Almeida Filho3 Marcos Sandro Fernandes de Vasconcelos3
Ana Beatriz Barra3 Jocemir Ronaldo Lugon1
1 Universidade Federal
Fluminense (UFF).
2 Universidade do Estado do
Rio de Janeiro (UERJ).
3 Fresenius Medical Care,
Brasil.
Data de submissão: 29/04/2014. Data de aprovação: 05/10/2014.
Correspondência para: Jocemir Ronaldo Lugon. Universidade Federal Fluminense. Hospital Universitário Antônio Pedro.
Rua Marquês de Paraná. nº 303, 2º Andar, Centro de Diálise. Centro, Niterói, RJ, Brasil. CEP: 24033-900. E-mail: [email protected] Tel: 55 (21) 2629-9260.
Early changes in serum albumin: impact on 2-year mortality
in incident hemodialysis patients
Alterações precoces da albumina sérica: impacto sobre a
mortali-dade aos 2 anos em pacientes incidentes em hemodiálise
Introduction/Objective: We evaluated the predictability of early changes in serum albumin (sAlb) on the two-year mortality of incident hemodialysis patients. Methods: Observational, longitudinal retrospective study using the database of Fresenius Medical Care of Latin America. Adult patients starting dialysis from January/2000 to June/2004, from 25 centers were included. Changes in sAlb during the first 3 months on hemodialysis were used as the main predictor. The outcome was death from any cause. Results: 1,679 incident patients were included. They were 52 ± 15 years old, 58.7% male and 21.5% diabetic, with a median sAlb of 38 g/L (bromocresol green). 923 patients had sAlb ≤ 38 g/L (Low sAlb Group) and 756 ones had sAlb > 38.0 g/L (Adequate sAlb Group). The mortality was significantly higher in Low sAlb Group (17% vs. 11%, p < 0.001). Early changes in sAlb significantly affected two-year mortality. Factoring the Kaplan Meier curve of Low sAlb Group by the presence of an increase in sAlb uncovered of a statistically significant difference in mortality favoring the ones whose sAlb went up (19% vs. 15%, p = 0.043). Differently, patients from Adequate sAlb Group with a decrease in their sAlb had a statistically higher mortality rate (13% vs.
8%, p = 0.029). Conclusions: Early sAlb changes showed a significant predictive power on mortality at 2 years in incident hemodialysis patients. Those with low initial sAlb may have a better prognosis if their sAlb rises. In contrast, patients with satisfactory initial levels can have a worsening of their prognosis in the case of an early reduction in sAlb.
A
BSTRACTPalavras-chave: albumina sérica; diálise renal; falência renal crônica; mortalidade.
Introdução/objetivo: Avaliou-se o impacto das alterações precoces na albumina sérica (sAlb) na mortalidade em 2 anos de hemodialisados incidentes. Métodos: Estudo longitudinal retrospectivo usando o banco de dados da Fresenius Medical Care da América Latina. Adultos iniciando diálise de janeiro de 2000 a junho de 2004, originados de 25 centros de diálise foram incluídos. Mudanças na sAlb durante os primeiros 3 meses em hemodiálise foram usadas como a variável de principal interesse. O desfecho foi morte por qualquer causa. Resultados: Um total de 1.679 pacientes incidentes foi incluído. Eles tinham 52 ± 15 anos, 58,7% eram do sexo masculino e 21,5%, diabéticos, com sAlb mediana de 38,0 g/L (bromocresol verde). Novecentos e vinte e três pacientes tiveram sAlb ≤ 38,0 g/L (Grupo sAlb baixa) e 756, sAlb > 38,0 g/L (Grupo sAlb adequada). A mortalidade foi significativamente maior no Grupo sAlb baixa (17% vs. 11%, p < 0,001). Alterações precoces na sAlb afetaram significativamente a mortalidade em dois anos. Fatoração da curva de Kaplan-Meier do Grupo sAlb baixa pela presença de um aumento na sAlb revelou uma diferença na mortalidade favorecendo aqueles cuja sAlb subiu (19% vs. 15%, p = 0,043). Em contraste, pacientes do Grupo sAlb adequada que mostraram diminuição na sAlb tiveram maior taxa de mortalidade (13% vs. 8%,
p = 0,029). Conclusão: Alterações precoces na sAlb mostraram um poder previsor significativo sobre a mortalidade em 2 anos em hemodialisados incidentes. Casos com sAlb inicial baixa melhoraram seu prognóstico quando houve elevação na sAlb, enquanto que aqueles com níveis iniciais satisfatórios tiveram um agravamento de seu prognóstico quando houve redução na sAlb.
RESUMO
Keywords: kidney failure, chronic; morta-lity; renal dialysis; serum albumin.
INTRODUCTION
Patients on hemodialysis (HD) are subject to an unac-ceptably high mortality rate, predominantly from cardiovascular causes.1-3 In the last decade, a new
acronym was coined, “MIA syndrome”, which indi-cates malnutrition, inflammation and atherosclero-sis,4,5 highlighting the link between these disorders.
The association of each respective variable of this triad with the mortality rate in HD patients has been the focus of several studies. Thus, an elevation in the serum level of C-reactive protein (CRP),6,7 reduction
in serum albumin (sAlb)8,9 and increased intimal
me-dia thickness, an early marker of atherosclerosis,10,11
are all individually associated with a higher mortality in the course of dialysis.
Most of chronic kidney disease patients are hy-poalbuminemic at entrance on dialysis, with a trend to increase sAlb level over time.12 However, the
nu-tritional profile is not much better among prevalent patients. Kalantar-Zadeh et al.13 found a prevalence
of hypoalbuminemia, defined as sAlb < 38 g/L by bro-mocresol green method, in over of 50% of patient on maintenance hemodialysis, and an optimum sAlb level > 40 g/L was present in only 28% of those patients. Hypoalbuminemia is associated with a poor outco-me in hemodialysis. Because of the close association of inflammation and hypoalbuminemia, it is unclear whether nutritional interventional could change the prognosis of malnourished patients on dialysis. An observational study suggested that the provision of oral nutritional supplements during dialysis impro-ves survival in hypoalbuminemic maintenance hemo-dialysis patients.14
Of special relevance for the present study, two pre-vious reports comprising predominantly prevalent pa-tients have suggested that the longitudinal changes in nutritional parameters may exert an effect on dialysis that impacts mortality in HD patients.13,15 Based on
these concepts, we assessed the impact of longitudinal changes in sAlb over the first three months of HD treatment on the two-year mortality rate in a cohort of incident HD patients.
MATERIALS AND METHODS
This is a retrospective analysis of the entire adult (≥ 20 years old) incident patients on HD at every dialysis center franchised by Fresenius Medical Care in Brazil, from January 1, 2000 to June 30, 2004. Data were
censored at two years of follow-up. The protocol was approved by the ethical committee of Pedro Ernesto University Hospital. The twenty-five dialysis facilities were located in 7 out of the 26 states that comprise the country. Data were collected at two years of follow-up. Patients were censored at time they left dialysis for any reason other than death. The primary outcome was all-cause mortality. Laboratory measurements were centrally performed (NefroLab, Belo Horizonte, MG). Serum albumin was measured by bromocresol green method (Bioclin, Belo Horizonte, MG). Patients whose sAlb levels at baseline or at the end of the third month of HD treatment were not available were excluded from the analysis.
DIALYSIS PROCEDURES
Hemodialysis sessions were carried out using pro-portional mixture machines (Model 4008B or 4008S, Fresenius Medical Care AG, Bad Homburg, Germany), with settings of blood flow of 300-450 ml/min, bicarbonate buffered dialysate ([Ca] = 2.5-3.0 mEq/L) at 500 ml/min and high flux polysulfone hollow-fiber dialyzers. Reverse osmosis was used to provide water treatment. Dialyzers were reprocessed with peracetic acid as the sterilant and discarded after the 12th use or as needed if the internal volume of the
hollow fibers decreased more than 20%.
PARAMETERS
Demographics and routine laboratorial measure-ments were analyzed. Blood sample collection was performed predialysis in a non-fasting state before a midweek session, except for the initial sampling, which occurred on the day the patient initiated regu-lar dialysis therapy. The dialysis dose was measured monthly by the equilibrated urea Kt/V.16
For the purpose of the study, patients were dicho-tomized according to their initial sAlb as belonging to Low sAlb Group (the ones whose initial sAlb was
the intra-and inter-assay variation coefficient of the sAlb determination, only percent changes in sAlb > 3% were taken in consideration.
STATISTICALANALYSIS
Continuous variables are expressed as the mean ± standard deviation. Differences between Low sAlb and Adequate sAlb groups were analyzed using an unpaired t test or Mann Whitney test as appropria-te. Categorical variables are presented as frequencies. The mortality rate was calculated with the Kaplan-Meier method and the curves were compared using the Log-Rank test. The hazard ratio for mortality was estimated by Cox proportional models in which the variable of primary interest was the sAlb changes at the first 3 months inserted as a dichotomic variable and controlled for demographics, comorbidities, la-boratory findings, and dialysis-related parameters. Effective inclusion of the variable in the multivaria-te model required a high probability of association with mortality in the univariate analysis (p < 0.10). Multivariate analysis was carried out step-by-step through the progressive inclusion of independent va-riables that could influence mortality. p values lower than 0.05 were considered significant. Changes in se-rum albumin (elevation in the Low sAlb Group and reduction in the Adequate sAlb Group) were binned into tertiles and their impact upon mortality was eva-luated in separate models.
The software SPSS, version 18.0 for Windows (IBM, Chicago, IL, USA), was used for statistical analysis.
RESULTS
From 1,834 adult incident HD patients, 1,679 met the selection criteria (availability of serum albumin at entrance and at the end of the third month on dialysis) and were included in the study. The median sAlb of the study population was 38 g/L. Nine-hundred and twenty-three patients had sAlb ≤ 38 g/L (Low sAlb Group) and 756 ones had sAlb > 38 g/L (Adequate sAlb Group). A flow chart of the study until the third month is showed in Figure 1. The general characteris-tics of patients are presented in Table 1. Patients with initial adequate sAlb were more likely to be male and young and less likely to be diabetic or have hepatitis C than those with initial low sAlb. A total of 489 pa-tients did not complete the 2-year follow-up period,
Figure 1. Enrolled patients, stratification according to initial serum albumin (sAlb), and status after three months on hemodialysis. 206 of them because of death. Of the remaining 281 out for other reasons, 141 were transferred to other centers, 101 had a kidney transplant, 16 were in the process of recovering renal function, 12 left the treat-ment center and 11 were shifted to peritoneal dialy-sis. At the end of two years, the whole cumulative mortality rate was 12.5%. When the Kaplan-Meier mortality curve was factored by the median sAlb, pa-tients from Low sAlb Group had a significantly hi-gher cumulative mortality rate (17%) compared to Adequate sAlb Group (11%), p < 0.001, Figure 2.
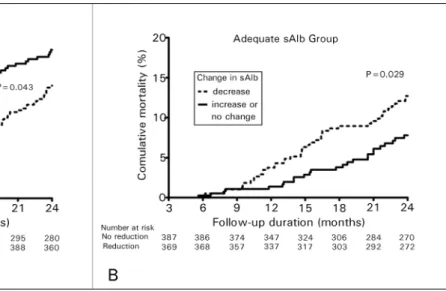
Additional analyses were performed to assess the influence of longitudinal changes in the serum levels of albumin during the first three months of dialysis treatment on the two-year mortality in each group. Factoring the Kaplan Meier curve of Low sAlb Group into two subsets by the presence of an increase in sAlb in the first 3 months on dialysis allowed detection of a statistically significant difference in mortality favoring the ones whose sAlb went up (19% vs.
15%, p = 0.043), Figure 3A. Mean changes in serum albumin in these subgroups were -2 ± 3 g/L and 5 ± 4 g/L. In contrast, patients from Adequate sAlb Group who showed a decrease in their sAlb had a statistically significant higher mortality (13% vs. 8%,
p = 0.029), Figure 3B. Mean changes in serum albumin of subgroups of Adequate sAlb Group were 2 ± 3 g/dL and -6 ± 4g/dL.
The patients in Low sAlb Group who did not have any increase in their sAlb levels had a higher proportion of serum positivity for hepatitis C (8.3%
Figure 2. Kaplan-Meyer cumulative mortality rate of incident hemodialysis patients with initial serum albumin > 38 g/L (dashed line) or ≤ 38 g/L (continuous line) along 24 months (p < 0.001). a Number entering the interval.
increased sAlb and those that did not (48.8% vs.
50.5.4%, p = 0.701). Similarly, the numbers regar-ding catheter use in Adequate sAlb Group did not di-ffer between those who had a decrease in their sAlb compared to those who did not (47.1% vs. 46.5%,
p = 0.896).
In a univariate analysis in Low sAlb Group, increase in sAlb, sAlb at entrance, age, diabetes, and mean Kt/V were all found to have a high probability of association with two-year mortality, Table 2. When these parame-ters were step-by-step inserted in a series of multivaria-te models, an increase in sAlb in the first three months was associated with lower mortality until the last model, Table 3. At this point, higher values of both sAlb at en-trance and mean Kt/V of the first three months were also associated with reduced risk of mortality whereas older age, as expected, increased the risk of death.
At the univariate analysis in Adequate sAlb Group, sAlb reduction, age, diabetes, and %variation in dry weight were the factors identified as having an association with two-year mortality, Table 4. At the multivariate analysis, after the progressive inclusion of the independent variables with p values < 0.10 in the univariate analysis, a reduction in sAlb in three months had a high probability of association with a higher mortality until the model 2, Table 5. After the insertion of the other controlling variables, only age
TABLE 1 CHARACTERISTICSOFTHEINCIDENTPATIENTS
All (N = 1679)
Initial albumin
p valuea
≤ 38 g/L (N = 923)
> 38 g/L (N = 756)
Gender (% males) 58.7 55.3 63.1 0.01
Age, years 52 ± 15b 54 ± 15 50 ± 15 < 0.001
> 65 years old, % 20.0 23.0 15.3 < 0.001
Primary renal disease, %
Diabetes 21.5 25.4 16.8 < 0.001
Hypertension 18.0 19.9 15.6 0.027
Chronic glomerulonephritis 7.9 7.0 8.9 0.190
Adult polycystic kidney 2.8 2.7 2.9 0.910
Others 19.8 19.6 20.0 0.880
Unknown 30.1 25.4 35.8 < 0.001
Body mass index (Kg/m2) 22.8 ± 4.4 22.7 ± 4.6 23.0 ± 4.1 0.10
Positive anti-HCV (%) 4.5 5.9 2.7 0.01
Positive HBsAg (%) 1.3 1.7 0.8 0.11
Positive HIV (%) 0.6 0.6 0.5 0.73
Hematocrit (%) 30.9 ± 6.1 34.0 ± 6.2 31.1 ± 5.9 0.29
sAlbi (g/L)c 38.0 ± 5.3 3.4 ± 0.4 4.2 ± 0.3 < 0.001
Changes in sAlb (g/L)d 0.3 ± 5.5 2.2 ± 4.9 -2.1 ± 5.4 < 0.001
Vascular catheter at start, % 48.2 49.4 46.9 0.414
Kt/V e 1.36 ± 0.25 1.37 ± 0.25 1.35 ± 0.25 < 0.322
a > 38 g/L vs. ≤ 38 g/L; b Mean ± S.D.; c sAlb
i = Initial serum albumin;
d Calculated as sAlb
TABLE 2 COXPROPORTIONALHAZARDRATIOS (H.R.) AND 95% CONFIDENCEINTERVALSINA
UNIVARIATEANALYSISFORFACTORS
ASSOCIATEDWITHTWO-YEARMORTALITYIN
LOWSALBGROUP (INITIALSERUMALBUMIN ≤
38 G/L)
H.R. (95% C.I.) p
Increase in sAlb (y/n)a 0.707
(0.505-0.990) 0.044
sAlb (g/L) at entrance 0.66
7 (0.441-1.009) 0.055
Age, years 1.032
(1.019-1.044) < 0.001
Male gender 1.041
(0.741-1.461) 0.818
Body mass index (Kg/m2) 0.991
(0.952-1.031) 0.670
Diabetes 1.629
(1.146-2.315) 0.007
Hematocrit at entrance (%)
0.989
(0.962-1.016) 0.415
Positive hepatitis C serology
1.566
(0.842-2.911) 0.156
% Variation in dry weight at the 3rd month
0.987
(0.968-1.007) 0.210
Kt/Vb 0.236
(0.118-0.472) < 0.001 a Calculated as a percent increase > 3% at the 3rd month of hemodialysis; b Mean of the first 3 months on hemodialysis.
Figure 3. Kaplan-Meyer cumulative mortality rate of incident hemodialysis patients with initial serum albumin ≤ 38 g/L (factored by the occurrence of a serum albumin elevation in 3 months, panel 3A) or > 38 g/dL (factored by the occurrence of a serum albumin reduction in 3 months, panel 3B).
and diabetes remained as factors independently asso-ciated with a higher risk of mortality in this group.
We analyzed the mortality risk according to the magnitude of early sAlb change in each group. In the Low sAlb Group, the mortality risk was statistically
lower for patients in the middle and higher tertiles of serum albumin elevation after 3 months on hemodialysis, but only after adjustment, Figure 4A. In the Adequate sAlb Group, the unadjusted mortality risk was statistically higher in the middle and higher tertiles. After adjustment, statistical significance was no longer present, Figure 4B.
DISCUSSION
The main objective of the present study was to deter-mine whether the early changes in sAlb could be used as a marker of the long-term prognosis for incident HD patients. Data for analysis were derived from 25 centers of a major dialysis provider in the country wi-th standardized handling practices and centrally per-formed laboratory measurements.
As a whole, the study patients were younger and with a lower proportion of diabetes in comparison to the data reported on dialysis populations in developed nations.17 These differences may have contributed to
the relatively low two-year cumulative mortality rate of 12.5% found in the study. The low mortality rate could also be accounted for by the exclusion of fatalities taking place before the completion of 3 months on dialysis, owing to the required availability of the sAlb levels at the start and at 3 months of treatment.
TABLE 3 ADJUSTEDHAZARDRATIO (H.R.) AND 95% CONFIDENCEINTERVAL (C.I.) FORASSOCIATIONOFINCREASEIN
SERUMALBUMINWITHMORTALITYINLOWSALBGROUP (INITIALSERUMALBUMIN ≤ 38 G/L)
VARIÁBLES
MODEL 1 MODEL 2 MODEL 3 MODEL 4
H.R. (C.I.95%)
p
value
H.R. (C.I. 95%)
p
value
H.R. (C.I. 95%)
p
value
H.R. (C.I.95%)
p
value Increase in sAlb
(y/n)
0.579
(0.399-0.838) 0.004
0.592
(0.410-0.856) 0.005
0.602
(0.416-0.872) 0.007
0.586
(0.405-0.847) 0.005
sAlb at entrance (g/L)
0.514
(0.334-0.792) 0.003
0.484
(0.309-0.758) 0.002
0.493
(0.312-0.779) 0.002
0.526
(0.336-0.823) 0.005
Age (years) 1.032
(1.019-1.045)
< 0.001
1.031 (1.018-1.044)
< 0.001
1.031 (1.018-1.044)
< 0.001
Diabetes (y/n) 1.396
(0.980-1.988) 0.065
1.311
(0.919-1.871) 0.135
Mean Kt/V 0.261
(0.130-0.526) < 0.001 Cox proportional models with progressive inclusion of the independent variables with p values < 0.10 in the univariate analysis.
TABLE 4 COXPROPORTIONALHAZARDRATIOS (H.R.)
AND 95% CONFIDENCEINTERVALSINA
UNIVARIATEANALYSISFORFACTORS
ASSOCIATEDWITHTWO-YEARMORTALITYIN
ADEQUATESALBGROUP (INITIALSERUM
ALBUMIN > 38 G/L)
H.R. (95% C.I.) p
Reduction in sAlb (Y/N)a 1.716
(1.051-2.804) 0.031
sAlb at entrance (g/L) 1.033
(0.510-2.089) 0.929
Age, years 1.039
(1.021-1.057)
< 0.001
Male gender 1.041
(0.541-1.415) 0.586
Body mass index at entrance (Kg/m2)
1.022
(0.966-1.081) 0.452
Diabetes 2.337
(1.408-3.877) 0.001 Hematocrit at entrance
(%)
0.994
(0.955-1.035) 0.774
Positive hepatitis C serology
1.182
(0.289-4.831) 0.816
%Variation in dry weight at the 3rdmonth
0.954
(0.908-1.002) 0.061
Kt/Vb 0.851
(0.328-2.210) 0.741 a Calculated as a percent reduction > 3% at the 3rd month of hemodialysis; b Mean of the first 3 months on hemodialysis. Cox proportional models with progressive inclusion of the independent variables with p values < 0.10 in the univariate analysis Cox proportional models with progressive inclusion of the independent variables with p values < 0.10 in the univariate analysis
Patients belonging to Low sAlb Group of our study were probably those who arrived with a more severe degree of malnutrition/inflammation, conditions associated with
an increased risk of both hospitalization and mortality.17-21
They were older, had a higher proportion of diabetes, and consistent to previous reports,22,23 had a higher prevalence
of seropositivity for hepatitis C. This group should conceivably enclose the major fraction of patients with a poor predialysis care. In contrast, Adequate sAlb Group, which was composed by presumably healthier patients, had a higher proportion of males, a lower fraction of patients older than 65 years, and the cause of their primary renal disease was predominantly unknown. In support to previous studies,24-26 the 17% two-year mortality rate
found for the Low sAlb Group in the Kaplan Meier curve was significantly higher than the 11% found for the remaining cases.
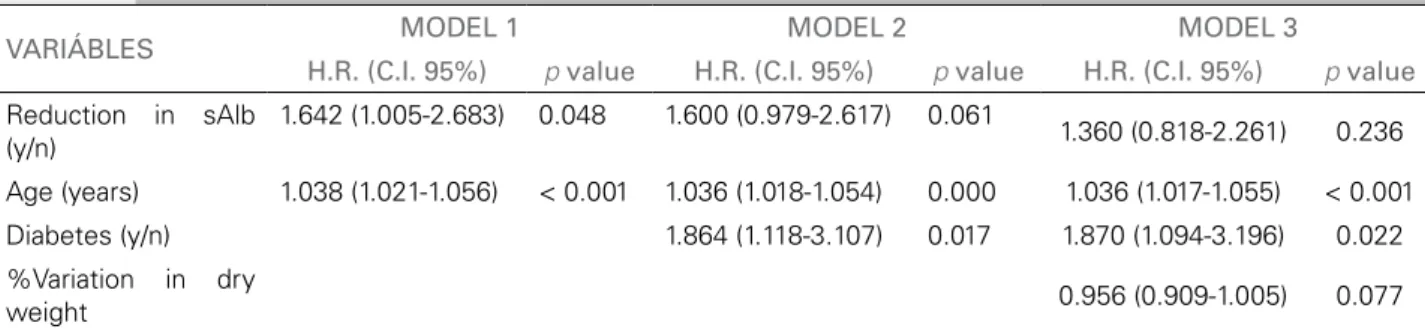
TABLE 5 ADJUSTEDHAZARDRATIO (H.R.) AND 95% CONFIDENCEINTERVAL (C.I.) FORASSOCIATIONOFREDUCTIONIN
SERUMALBUMINWITHMORTALITYINADEQUATESALBGROUP (INITIALSERUMALBUMIN > 38 G/L)
VARIÁBLES MODEL 1 MODEL 2 MODEL 3
H.R. (C.I. 95%) p value H.R. (C.I. 95%) p value H.R. (C.I. 95%) p value
Reduction in sAlb (y/n)
1.642 (1.005-2.683) 0.048 1.600 (0.979-2.617) 0.061
1.360 (0.818-2.261) 0.236
Age (years) 1.038 (1.021-1.056) < 0.001 1.036 (1.018-1.054) 0.000 1.036 (1.017-1.055) < 0.001
Diabetes (y/n) 1.864 (1.118-3.107) 0.017 1.870 (1.094-3.196) 0.022
%Variation in dry
weight 0.956 (0.909-1.005) 0.077
Cox proportional models with progressive inclusion of the independent variables with p values < 0.10 in the univariate analysis.
Figure 4. Risk of death according to the tertiles of the magnitude of the initial 3-month percent change in sAlb. For the elevations in sAlb in the Low sAlb Group (Panel A): no change (reference), mild increase (> 3.0%-9.1%), moderate increase (> 9.1%-17.7%), and high increase (> 17.7%). For the reductions in sAlb in the Adequate sAlb Group (Panel B): no change (reference), mild decrease (> 3.0%-8.3%), moderate decrease (> 8.3%-17.5%), and high decrease (> 17.5%). Adjustments were performed for variables with p < 0.10 in the univariate analysis from tables 2 and 4.
catheter did not seem to affect the changes in sAlb levels in any group, but the selective inclusion of patients who survived the first 3 months on dialysis may have par-tially obviated the impact of catheter use in this regard.
When the association of the changes in sAlb with mortality was controlled for albumin at entrance, demo-graphics, co-morbidities, and dialysis related-variables, provocative results emerged. In Low sAlb Group, the beneficial effect of an increase in sAlb at the first three months on dialysis exhibited a statistically significant as-sociation with mortality until the model 4. Interestingly, sAlb at entrance, age, and elevations in Kt/V, a definitely modifiable variable, also remained as independently asso-ciated with mortality in this group. These results indicate that in Low sAlb Group, the two potentially modifiable risk factors associated with mortality were the sAlb chan-ges at three months and dialysis quality. However, we cannot define whether the early elevation in sAlb, which was associated with a lower mortality risk, was due to improvement of nutrition parameters or could be at least
partially secondary to the correction of the initial fluid overload that was causing albumin dilution.
When looking at the results in Adequate sAlb Group, it was found that the initial association of sAlb reduction in three months with poor prognosis was no longer present after controlling for the varia-bles derived from the univariate analysis. At the end, only age and diabetes were independently associated with mortality in this group. These results suggest that much of the mortality in Adequate sAlb Group was related to underlying characteristics of patients.
Our results confirm that early sAlb changes are inde-ed a marker of long-term prognosis and are consistent with two previous studies that addressed the impact of longitudinal variations in sAlb on mortality in samples predominantly consisting of prevalent HD patients.13,15
more reliably diagnose inflammation, and the evalua-tion of residual kidney funcevalua-tion. However, the data avai-lable for analyses were limited given they were derived from a database. On the other side, the sample size, the use of standardized dialysis practices and the centrally determination of the laboratory measurements can be seen as points that strengthen our conclusions.
In summary, early longitudinal changes in the sAlb levels were able to predict long-term prognosis of HD patients. The ones who exhibited an increase in their sAlb in the first three months on dialysis in spite of an initial low albumin had a better prognosis. In con-trast, those with sAlb within acceptable levels whose sAlb levels dropped had a dismal prognosis.
ACKNOWLEDGMENTS
This study was in part presented at Kidney Week 2011 (November 8-13), Philadelphia, Pennsylvania, USA.
CONFLICT OF INTEREST STATEMENT
FR, EAF, MSFV and ABB are employees of Fresenius Medical Care. The remaining authors have no con-flict of interest.
REFERENCES
1. United States Renal Data System. USRDS 2012 Annual Data Report: Atlas of Chronic Kidney Disease & End-Stage Renal Disease in the United States. Mortality. Bethesda: National Ins-titutes of Health, National Institute of Diabetes and Digestive and Kidney Diseases; 2012. p.259-68.
2. United States Renal Data System. USRDS 2012 Annual Data Report: Atlas of Chronic Kidney Disease & End-Stage Renal Disease in the United States. Cardiovascular disease. Bethesda: National Institutes of Health, National Institute of Diabetes and Digestive and Kidney Diseases; 2012. p. 247-58.
3. Yao Q, Pecoits-Filho R, Lindholm B, Stenvinkel P. Traditional and non-traditional risk factors as contributors to atheroscle-rotic cardiovascular disease in end-stage renal disease. Scand J Urol Nephrol 2004;38:405-16. PMID: 15764253 DOI: http:// dx.doi.org/10.1080/00365590410031715
4. Stenvinkel P, Heimbürger O, Paultre F, Diczfalusy U, Wang T, Berglund L,. Strong association between malnutrition, inflam-mation, and atherosclerosis in chronic renal failure. Kidney Int 1999;55:1899-911. PMID: 10231453
5. Stenvinkel P, Heimbürger O, Lindholm B, Kaysen GA, Bergs-tröm J. Are there two types of malnutrition in chronic renal failure? Evidence for relationships between malnutrition, in-flammation and atherosclerosis (MIA syndrome). Nephrol Dial Transplant 2000;15:953-60.
6. Yeun JY, Levine RA, Mantadilok V, Kaysen GA. C-Reactive protein predicts all-cause and cardiovascular mortality in he-modialysis patients. Am J Kidney Dis 2000;35:469-76. 7. Zimmermann J, Herrlinger S, Pruy A, Metzger T, Wanner C.
In-flammation enhances cardiovascular risk and mortality in hemo-dialysis patients. Kidney Int 1999;55:648-58. PMID:9987089 8. Amaral S, Hwang W, Fivush B, Neu A, Frankenfield D, Furth S.
Serum albumin level and risk for mortality and hospitalization in adolescents on hemodialysis. Clin J Am Soc Nephrol 2008;3:759-67.
9. Kaysen GA, Dubin JA, Müller HG, Mitch WE, Rosales LM, Levin NW. Relationships among inflammation nutrition and physiologic mechanisms establishing albumin levels in hemo-dialysis patients. Kidney Int 2002;61:2240-9. PMID: 12028466 10. Ekart R, Hojs R, Hojs-Fabjan T, Balon BP. Predictive value of
carotid intima media thickness in hemodialysis patients. Artif Organs 2005;29:615-9.
11. Papagianni A, Dovas S, Bantis C, Belechri AM, Kalovoulos M, Dimitriadis C, et al. Carotid atherosclerosis and endothelial cell adhesion molecules as predictors of long-term outcome in chro-nic hemodialysis patients. Am J Nephrol 2008;28:265-74. 12. Dalrymple LS, Johansen KL, Chertow GM, Grimes B, Anand S,
McCulloch CE, et al. Longitudinal measures of serum albumin and prealbumin concentrations in incident dialysis patients: the comprehensive dialysis study. J Ren Nutr 2013;23:91-7. 13. Kalantar-Zadeh K, Kilpatrick RD, Kuwae N, McAllister CJ,
Alcorn H Jr, Kopple JD, et al. Revisiting mortality predictabili-ty of serum albumin in the dialysis population: time dependen-cy, longitudinal changes and population-attributable fraction. Nephrol Dial Transplant 2005;20:1880-8.
14. Lacson E Jr, Wang W, Zebrowski B, Wingard R, Hakim RM. Outcomes associated with intradialytic oral nutritional supple-ments in patients undergoing maintenance hemodialysis: a qua-lity improvement report. Am J Kidney Dis 2012;60:591-600. 15. Pifer TB, McCullough KP, Port FK, Goodkin DA, Maroni BJ,
Held PJ, et al. Mortality risk in hemodialysis patients and chan-ges in nutritional indicators: DOPPS. Kidney Int 2002;62:2238-45. PMID: 12427151
16. Depner T, Beck G, Daugirdas J, Kusek J, Eknoyan G. Lessons from the Hemodialysis (HEMO) Study: an improved measure of the actual hemodialysis dose. Am J Kidney Dis 1999;33:142-9. 17. United States Renal Data System. USRDS 2012 Annual Data
Report: Atlas of Chronic Kidney Disease & End-Stage Renal Disease in the United States. Mortality. Bethesda: National Ins-titutes of Health, National Institute of Diabetes and Digestive and Kidney Diseases; 2012. p.341-52.
18. Bonanni A, Mannucci I, Verzola D, Sofia A, Saffioti S, Gianetta E. Protein-energy wasting and mortality in chronic kidney di-sease. Int J Environ Res Public Health 2011;8:1631-54. 19. Kovesdy CP, Kalantar-Zadeh K. Why is protein-energy wasting
associated with mortality in chronic kidney disease? Semin Ne-phrol 2009;29:3-14.
20. Kovesdy CP, George SM, Anderson JE, Kalantar-Zadeh K. Ou-tcome predictability of biomarkers of protein-energy wasting and inflammation in moderate and advanced chronic kidney disease. Am J Clin Nutr 2009;90:407-14. PMID: 19535427 21. Ikizler TA, Cano NJ, Franch H, Fouque D, Himmelfarb J,
Kalantar-Zadeh K, et al.; International Society of Renal Nu-trition and Metabolism. Prevention and treatment of protein energy wasting in chronic kidney disease patients: a consen-sus statement by the International Society of Renal Nutri-tion and Metabolism. Kidney Int 2013;84:1096-107. PMID: 23698226
22. Tsai HB, Chen PC, Liu CH, Hung PH, Chen MT, Chiang CK, et al. Association of hepatitis C virus infection and malnutri-tion-inflammation complex syndrome in maintenance hemo-dialysis patients. Nephrol Dial Transplant 2012;27:1176-83. 23. Kalantar-Zadeh K, Miller LG, Daar ES. Diagnostic discordance
for hepatitis C virus infection in hemodialysis patients. Am J Kidney Dis 2005;46:290-300. PMID: 16112048
24. Clark LE, Khan I. Outcomes in CKD: what we know and what we need to know. Nephron Clin Pract 2010;114:c95-102. 25. Sesso Rde C, Lopes AA, Thomé FS, Lugon JR, Watanabe Y,
Santos DR. Chronic dialysis in Brazil: report of the Brazilian dialysis census, 2011. J Bras Nefrol 2012;34:272-7.