Printed version ISSN 0001-3765 / Online version ISSN 1678-2690 http://dx.doi.org/10.1590/0001-3765201720170077
www.scielo.br/aabc | www.fb.com/aabcjournal
Leaf area estimation from linear measurements in different ages of
Crotalaria juncea
plants
JULIANA O. DE CARVALHO1
, MARCOS TOEBE2
, FRANCIELI L. TARTAGLIA3
, CIRINEU T. BANDEIRA4
and ANDRÉ L. TAMBARA3
1
Programa de Pós-Graduação em Fisiologia Vegetal, Departamento de Botânica, Universidade Federal de Pelotas, Campus Capão do Leão, 96160-000 Capão do Leão, RS, Brazil 2
Departamento de Ciências Agronômicas e Ambientais, Universidade Federal de Santa Maria, Campus Frederico Westphalen, Linha 7 de Setembro, s/n, BR 386 Km 40, 98400-000 Frederico Westphalen, RS, Brazil 3
Universidade Federal do Pampa, Campus Itaqui, Rua Luiz Joaquim de Sá Britto, s/n, Promorar, 97650-000 Itaqui, RS, Brazil 4
Programa de Pós-Graduação em Agronomia, Departamento de Fitotecnia, Universidade Federal de Santa Maria, Avenida Roraima, 1000, Camobi, 97105-900 Santa Maria, RS, Brazil
Manuscript received on February 3, 2017; accepted for publication on April 10, 2017
ABSTRACT
The goal of this study was to estimate the leaf area of Crotalaria juncea according to the linear dimensions
of leaves from different ages. Two experiments were conducted with C.juncea cultivar IAC-KR1, in the
2014/2015 sowing seasons. At 59, 82, 102, 129 days after sowing (DAS) of the first and 61, 80, 92, 104
DAS of the second experiment, 500 leaves were collected, totaling 4,000 leaves. In each leaf, the linear
dimensions were measured (length, width, length/width ratio and length × width product) and the specific
leaf area was determined through Digimizer and Sigma Scan Pro software, after scanning images. Then, 3,200 leaves were randomly separated to generate mathematical models of leaf area (Y) in function of linear dimension (x), and 800 leaves for the models validation. In C. juncea, the leaf areas determined by Digimizer and Sigma Scan Pro software are identical. The estimation models of leaf area as a function of length × width product showed superior adjustments to those obtained based on the evaluation of only one
linear dimension. The linear model Ŷ=0.7390x (R2=0.9849) of the real leaf area (Y) as a function of length
× width product (x) is adequate to estimate the C. juncea leaf area.
Key words: non-destructive method, image processing, mathematical models, model validation.
Correspondence to: Marcos Toebe E-mail: [email protected]
INTRODUCTION
Crotalaria juncea is a rapid growth leguminous plant, with high biomass production potential under appropriate conditions of rainfall, assisting
in the nitrogen fixation capacity, in the nutrient
cycling and improving the soil fertility (Fontanétti
et al. 2006, EMBRAPA 2014). C. juncea can also
be planted in areas infested with phytonematodes because it helps to reduce the population density by the production of nematicide compounds, and increasing the population of unfavorable microorganisms to nematodes (Valenzuela and Smith 2002, EMBRAPA 2014).
Factors related to leaf area, such as
the plant productivity, which makes the leaf area a key variable in physiological studies involving plant growth, light interception, photosynthetic efficiency, evapotranspiration, and answers to fertilizers and irrigation (Blanco and Folegatti 2005). Thus, the leaf area is used as an indicative of productivity and can be useful for cultural technical evaluations, as in seeding density, irrigation, fertilization, and agrochemicals application (Favarin et al. 2002). In this sense, there are direct and indirect methods of determining leaf area. Most of the direct methods are destructive or expensive
and difficult to maintain electronic meters (Godoy
et al. 2007). Indirect non-destructive methods are simpler and faster, for instance, the utilization of predictive models of real leaf area in a leaves linear dimensions function (Gamiely et al. 1991).
The use of computational resources is recommended to determine the real leaf area by enabling the analysis of the entire leaf area and the leaf area of damaged leaves and, consequently, the functional leaf area (Vieira Junior et al. 2006). According to Adami et al. (2008), the digital image analysis method is accurate and allows the estimation of leaf area in both damaged and
complete leaflets, and it can replace the integrative
method of leaf area (Standard Method LI-Cor®) used in the Crotalaria juncea leaf area modeling by Cardozo et al. (2011). In several agricultural crops, such as corn (Vieira Junior et al. 2006) and acerola (Lucena et al. 2011), the digital image processing was used to determine the real leaf area for later mathematical models generation. These studies have shown good accuracy in the use of images for predicting the real leaf area.
The relationship between the linear dimensions of the leaves (length, width and / or length × width product) and leaf area can be studied through the generation of mathematical models that describe such relationships. These models can be validated and applied in field measurements, at different stages of development and plant growth, in a
non-destructive way, with low cost and high precision. Mathematical models for leaf area estimation
have been developed in different crops, as cotton
(Monteiro et al. 2005), zucchini (Rouphael et al. 2006), eggplant (Rivera et al. 2007), hazelnut (Cristofori et al. 2007), kiwi (Mendoza-de Gyves et al. 2007), orange (Godoy et al. 2007), banana (Zucoloto et al. 2008), coffee (Antunes et al.
2008), small fruits (Fallovo et al. 2008), sunflower
(Maldaner et al. 2009), potato (Busato et al. 2010), crambe (Toebe et al. 2010), rose (Rouphael et al.
2010), Crotalaria juncea (Cardozo et al. 2011),
turnip (Cargnelutti Filho et al. 2012), jatropha (Pompelli et al. 2012), gladiolus (Schawb et al. 2014), canola (Cargnelutti Filho et al. 2015a) and pigeonpea (Cargnelutti Filho et al. 2015b).
Since each species shows characteristic patterns of leaf morphology, it is necessary to
generate specific models of leaf area estimation.
Models must be generated from data obtained from leaves with an elevated range of sizes (Cargnelutti
Filho et al. 2012), collected at different levels of the canopy, different growth and development periods, and under different planting dates, densities and
environmental conditions, ensuring the field conditions representativeness. The generation of leaf area estimation models has been accomplished in Crotalaria juncea by Cardozo et al. (2011). However, the generated models were obtained in one experimental condition and evaluation date, using only 200 leaves, a leaf number considered
insufficient by Pompelli et al. (2012) to generate
mathematical models of leaf area estimation. Therefore, the objective of this study was to estimate the Crotalaria juncea leaf area regarding
the linear dimensions of the leaves from different
ages.
MATERIALS AND METHODS
Two experiments were conducted with the culture
seasons of 2014/2015, at the experimental area of the Universidade Federal do Pampa – campus Itaqui, at 29°09’S latitude, 56°33’W longitude and 74 m of altitude. The regional climate is humid subtropical Cfa, according to Köppen, and the
soil is classified as Plinthosol Haplic (Plintossolo
Háplico - EMBRAPA 2013).
The first sowing time was conducted on 18.10.2014, being held with a base fertilization 25 kg ha-1 N, 100 kg ha-1 P
2O5 and 100 kg ha -1 K
2O.
The area used in the experiment was 256 m2, which was planted with 27 seeds per meter, a spacing of 0.45 m and a total of 60 seeds per m2, with a final population evaluated, at 154 days after sowing, of 43 plants per m2. The second sowing was carried out by throwing the seeds on 23.01.2015, in a used area of 48 m2, with the same fertilization as the
first sowing time and a density three times superior,
using 9 g of seeds per m2, with a density of 180
seeds per m2 and final population evaluated, at 122 days after sowing, of 135 plants per m2. All
crop management were kept constant in both experiments and conducted uniformly throughout the experimental area, except for sowing and the planting system (line system and haul) that were
distinct between the first and second sowing time
experiments, purposely to generate contrasting conditions between experiments.
For the determination of leaf area, a total of 4,000 leaves were randomly collected, with 2,000
leaves from each sowing time, with different sizes,
from full vegetative growth. In the first sowing time, 500 leaves were collected at 59, 82, 102 and 129 days after sowing. In the second time, 500 leaves were collected at 61, 80, 92 and 104 days after sowing. In each leaf, the length (L) and width (W) of the leaf blade was measured with a millimetric ruler. Then, the length width ratio (L/W) and the product of length times width (L × W) were estimated. Subsequently each of the 4,000 leaves leaf area was determined by digital images. For this, the leaves were placed in sequence on the
scanner EPSON, model Perfection V33/V330, and scanned with a resolution of 300 dpi. Then, these digital images were processed with the Digimizer v.4.5.2® (Medcalc Software 2015) and Sigma Scan
Pro v.5.0® (Jandel Scientific 1991) software for
determination of leaf area and comparisons between the leaf area estimated by the two softwares.
From each collection, in each sowing time, 400 leaves were randomly separated for the models generation and 100 leaves for the model validation. Therefore, the total of 4,000 leaves were evaluated (2 sowing dates × 4 dates of collections / sowing dates × 500 leaves per collection), with 3,200 leaves (80% of the collected leaves) used to generate mathematical models and 800 leaves (20% leaves collected) used only to the generated models validation. For the data of the L,W, L / W, L × W and leaf leaves area (Y) of each time used for generation (400 leaves) and models validation (100 leaves) and the total leaves for generation (3,200 leaves) and models validation (800 leaves), the minimum, maximum, mean, median, variance,
standard deviation, variation coefficient, standard
error, asymmetry and kurtosis values were calculated.
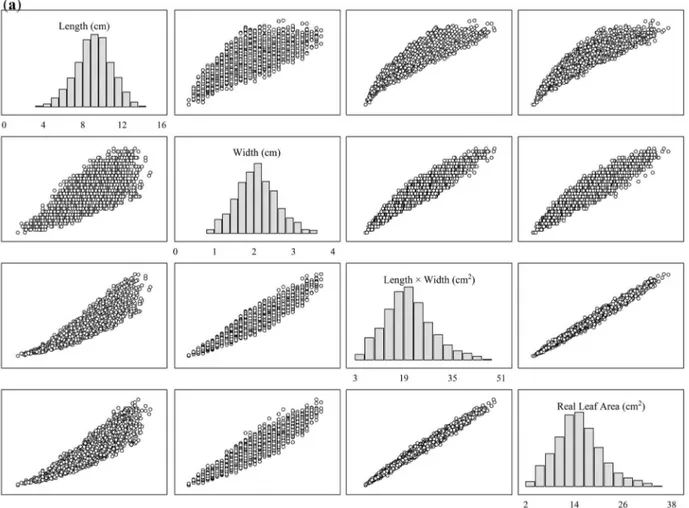
Based on data of L, W, L × W and leaf area (Y), frequency histograms and scatter plots were constructed. Then, the real leaf area (Y) modeling determined by image processing was performed, depending of the function of L or W an /or L ×
W by the following models: linear (Y = a + bx), quadratic (Y = a + bx + cx2) and potency (Y= axb).
In these models, x represents the linear dimension of the leaf (L, W or L × W). For both of the linear and quadratic models, the intercept was zero (linear
coefficient a = 0), considering that when a linear
dimension (L, W or L × W) assumes null value, the estimated leaf area should also be null (Schawb et al. 2014).
In the models where the L × W product was used, the diagnosis of colinearity was previously
= 1/(1 - r2
) (Cristofori et al. 2007) and the tolerance
factor T=1/VIF (Rouphael et al. 2010, Toebe and
Cargnelutti Filho 2013). If the VIF value was higher than 10 or if the T value was smaller than 0.10, then collinearity may have more than a trivial impact on the estimates of the parameters and, consequently, one of them should be excluded from the model, as describedby Cristofori et al. (2007), Rouphael et al. (2010) and Toebe and Cargnelutti Filho (2013).
The nine estimation models validation of leaf area generated in this study, as well as the model proposed by Cardozo et al. (2011), were conducted based on the 800leaf area models estimated values
(Ŷi) and 800 observed values (Yi) of the real leaf
area. In each model, simple linear regression (Ŷi = a + bYi) was adjusted forthe estimated leaf area by the model (dependent variable) in function of the observed leaf area (independent variable). The hypotheses was tested H0: a = 0 versus H1: a
≠ 0 and H0: b = 1 versus H1: b ≠ 1, by means of the Student t-test at 5% of probability. Then, the
linear correlation coefficients of Pearson (r) and
determination (R2) between Ŷ
i and Yi was calculated.
Also, the mean absolute error (MAE) and Willmott d index (Willmott 1981) was calculated for each model, as indicated by Cargnelutti Filho et al. (2012, 2015a, b).
To choose the best estimation models of leaf area for Crotalaria juncea, in function of L, W and/ or L × W of the leaf, the following criteria were
used: linear coefficient not different to zero, angular coefficient not different to one, linear correlation
Pearson coefficients of and determination close to one, mean absolute error close to zero and d index (Willmott 1981) close to one, according to recommendations of Cargnelutti Filho et al. (2012, 2015a, b). Then, after obtaining the best general model based on the 3,200 leaves (linear, quadratic or potency in function of L, W and / or L × W), similar models of this were generated by sowing season and evaluation to verify the similarity of the model in all scenarios of sowing seasons
and evaluation periods. Statistical analyses were performed using the Microsoft Office Excel® application and Statistica 12.0® software (Statsoft 2015).
RESULTS AND DISCUSSION
In the four evaluations conducted in each sowing time, the mean and median values were found to be similar, with only small deviations of asymmetry
and kurtosis, indicating a good fit of the data to
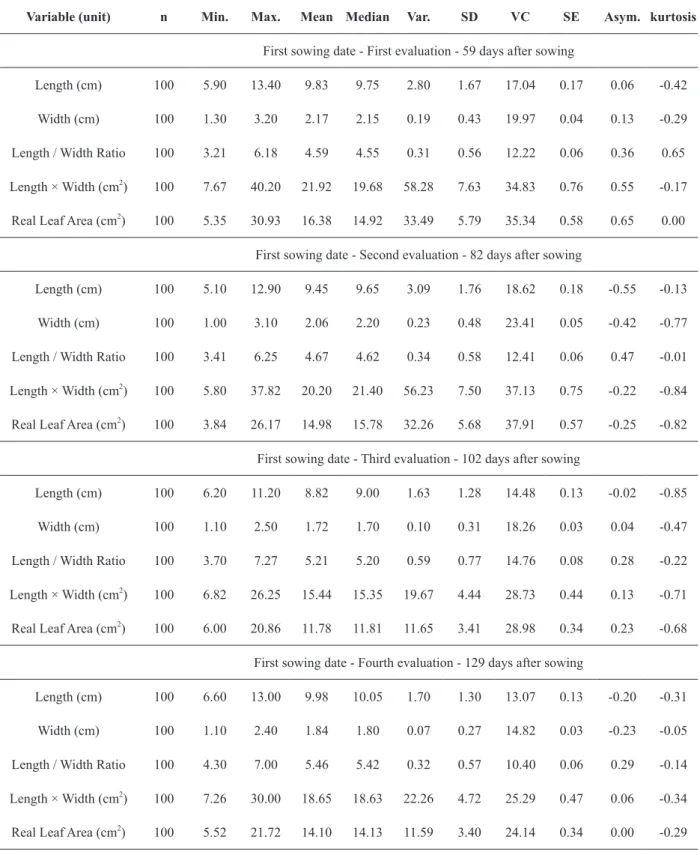
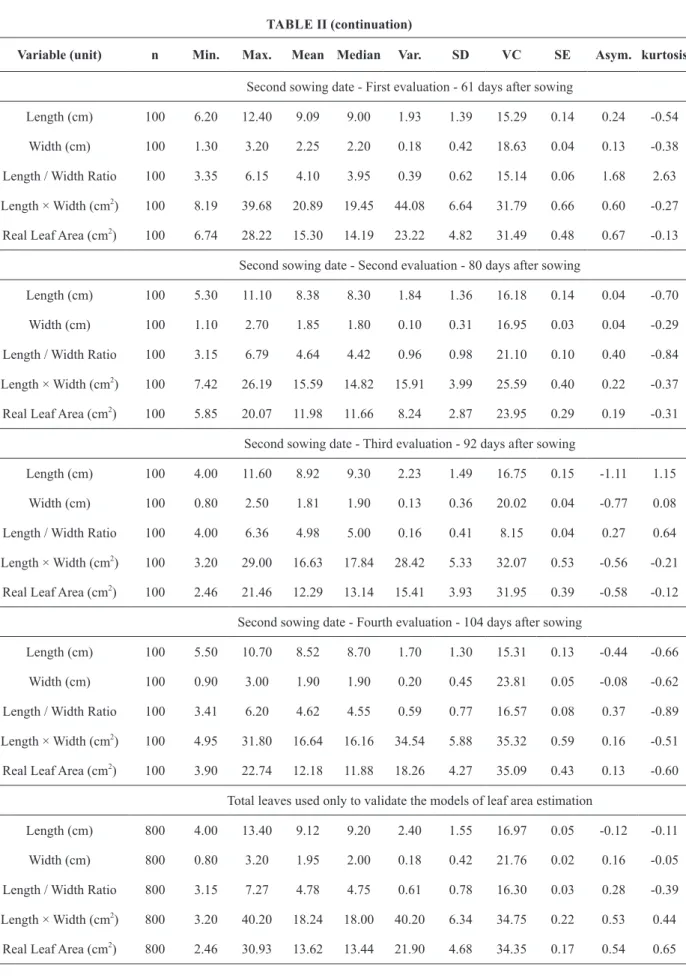
the normal distribution for all variables evaluated for leaves destined to the models generation (Table I) and also to the leaves destined to validate those models (Table II). High amplitude (difference between minimum and maximum values) was
observed for each measured variable (3.40 cm ≤ length ≤ 14.20 cm, 0.80 cm ≤ width ≤ 3.60 cm,
2.72 cm2 ≤ length × width ≤ 47.88 cm2 and 1.75 cm2 ≤ real leaf area ≤ 36.10 cm2) in leaves used for the mathematical generation of models of leaf area estimation (Table I). The amplitude between the minimum and maximum length, width and leaf area values exceeded the values obtained by Cardozo et al. (2011), although the mean of these variables was similar. In studies conducted by Cargnelutti Filho et al. (2012, 2015 a, b) and Toebe
et al. (2010, 2012), there was also a wide difference
in leaf size, which is important to the applicable models generation of assorted leaves sizes.
The mean length / width ratio ranged from 4.06 to 5.41 between evaluations and sowing times in leaves used for models generation (Table I) and between 4.10 and 5.46 for leaves used in models validation (Table II). In all evaluations realized to the models generation (Table I) and validation
(Table II), the variation coefficients values were
higher for the product of length × width and for the leaf area determined by Digimizer and Sigma Scan Pro software, in relation to variation
coefficients obtained for length, width and length/
2012), canola (Cargnelutti Filho et al. 2015a) and pigeonpea (Cargnelutti Filho et al. 2015b) crops, a greater variability of the data in relation to L × W and Y was observed when compared to the linear dimensions of the leaf - lengthwise and widthwise.
The leaves sizes variability, obtained by
samples taken at different growth and development
stages of the crop, in the two sowing dates, considering distinct regions of the canopy of
plants and different densities and seeding systems
contribute to the generation of models with a wide spectrum of using in a crop. The high number of
leaves used for the models generation (n = 3,200
leaves) increases safety on the recommendation of the obtained models, as indicated by Antunes et al.
(2008) and Pompelli et al. (2012). The dispersion diagrams between the independent variables (length, width and length × width) and real leaf area indicate linear and nonlinear association patterns (Figure 1a). There was nonlinear association between L and Y, W and Y, and linear between L × W and Y. As a result, linear and nonlinear models of the potency and quadratic type were generated and tested to estimate the real leaf area in each linear dimension.
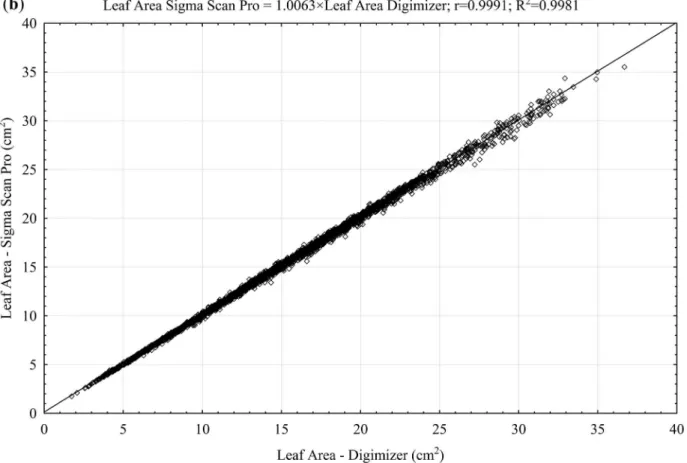
Foliar areas obtained by Digimizer and Sigma Scan Pro software were coincident (Figure 1b
and Table I), with high correlation (r = 0.9991)
and excellent prediction (R2 = 0.9981). The leaf area can be obtained by Sigma Scan Pro software
being estimated by 1.0063 × leaf area obtained by Digimizer software. In this way, for each 1cm2 of leaf area determined by Digimizer software, there is only an overestimation of 0.0063cm2 in case of
using Sigma Scan Pro software and vice versa. Thus, it can be implied that the two softwares result in overlapping leaf area determinations, leaving the researcher to choose the software to be used, considering the cost, accessibility and other relevant items to choose from. In this study, considering the above statements, it was decided to consider the actual leaf area, as being the mean obtained between the two softwares for each of the 3,200 leaves used in the generation and 800 leaves used in the models validation.
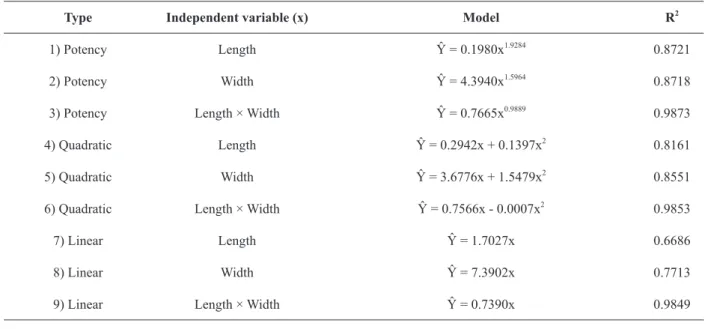
Among the types of tested models, it was verified that the best prediction models for the
potency type (0.8718 ≤ R2 ≤ 0.9873), followed by quadratic (0.8161 ≤ R2 ≤0.9853) and linear type (0.6686 ≤ R2 ≤ 0.9849) (Table III). Among the
independent variables used to estimate the real leaf area, the best prediction is obtained using
models based on the length × width (0.9849 ≤ R2 ≤ 0.9873), followed by models based on the width (0.7713 ≤ R2 ≤ 0.8718) or just the length of the leaves (0.6686 ≤ R2 ≤ 0.8721). In work developed
by Cardozo et al. (2011), it was also found that the best prediction models were based on the length × width. It is noteworthy that both the linear and the quadratic models used in this study were generated
by defining the intersection (through the origin),
TABLE I
Number of leaves (n), minimum (Min.), maximum (Max.), mean, median, variance (Var.), standard deviation (SD), variation coefficient (VC, %), standard error (SE), asymmetry (Asym.) and kurtosis in 3,200 leaves of Crotalaria juncea -
measuring 400 leaves by evaluation in each sowing - used to generate the leaf area (LA) estimation models in function of linear dimensions in the 2014/15 harvest in Itaqui - RS - Brazil.
Variable (unit) n Min. Max. Mean Median Var. SD VC SE Asym. kurtosis
First sowing date - First evaluation - 59 days after sowing
Length (cm) 400 4.80 14.20 9.73 9.50 3.93 1.98 20.37 0.10 0.06 -0.78
Width (cm) 400 0.90 3.60 2.44 2.40 0.35 0.59 24.32 0.03 -0.02 -0.75
Length / Width Ratio 400 2.92 6.85 4.06 4.05 0.25 0.50 12.22 0.02 1.12 3.44 Length × Width (cm2
) 400 4.32 47.88 24.76 22.69 107.35 10.36 41.85 0.52 0.37 -0.88 LA – Digimizer (cm2
) 400 3.53 36.69 18.47 16.72 59.82 7.73 41.87 0.39 0.34 -0.92 LA - Sigma Scan Pro
(cm2
) 400 3.53 35.51 18.29 16.56 58.27 7.63 41.74 0.38 0.34 -0.89
Real LA (cm2) 400 3.53 36.10 18.38 16.63 59.01 7.68 41.79 0.38 0.34 -0.91 First sowing date - Second evaluation - 82 days after sowing
Length (cm) 400 3.40 13.40 9.16 9.40 2.67 1.63 17.85 0.08 -0.47 0.32
Width (cm) 400 0.80 3.40 2.30 2.30 0.30 0.55 23.88 0.03 -0.23 -0.69
Length / Width Ratio 400 2.97 6.42 4.08 4.00 0.39 0.63 15.36 0.03 0.76 0.42 Length × Width (cm2
) 400 2.72 44.22 21.82 22.08 65.14 8.07 36.98 0.40 0.05 -0.61 LA – Digimizer (cm2
) 400 1.74 31.84 16.08 16.40 35.97 6.00 37.30 0.30 -0.04 -0.69 LA - Sigma Scan Pro
(cm2
) 400 1.75 31.74 16.10 16.27 35.88 5.99 37.21 0.30 -0.05 -0.71
Real LA (cm2) 400 1.75 31.79 16.09 16.31 35.92 5.99 37.25 0.30 -0.05 -0.70 First sowing date - Third evaluation - 102 days after sowing
Length (cm) 400 4.90 13.60 9.43 9.40 2.08 1.44 15.28 0.07 0.15 0.54
Width (cm) 400 0.90 2.90 1.94 2.00 0.14 0.37 19.27 0.02 -0.35 -0.03
Length / Width Ratio 400 3.32 7.13 4.98 4.86 0.72 0.85 17.04 0.04 0.54 -0.44 Length × Width (cm2
) 400 4.68 36.54 18.58 18.54 29.68 5.45 29.33 0.27 0.06 -0.05 LA – Digimizer (cm2
) 400 3.06 25.96 13.71 13.66 15.72 3.96 28.91 0.20 0.00 -0.06 LA - Sigma Scan Pro
(cm2
) 400 3.12 26.44 13.91 13.89 16.09 4.01 28.84 0.20 0.00 -0.03
Real LA (cm2
Variable (unit) n Min. Max. Mean Median Var. SD VC SE Asym. kurtosis
First sowing date - Fourth evaluation - 129 days after sowing
Length (cm) 400 5.70 14.60 10.54 10.60 2.27 1.51 14.29 0.08 -0.05 -0.21
Width (cm) 400 0.90 2.80 1.96 2.00 0.08 0.28 14.07 0.01 -0.28 0.54
Length / Width Ratio 400 4.00 7.06 5.41 5.42 0.34 0.59 10.84 0.03 -0.16 0.01 Length × Width (cm2
) 400 5.13 40.88 20.92 20.17 29.36 5.42 25.90 0.27 0.36 0.41 LA – Digimizer (cm2
) 400 4.01 31.85 15.91 15.35 16.42 4.05 25.47 0.20 0.44 0.74 LA - Sigma Scan Pro
(cm2) 400 4.01 32.45 16.22 15.69 17.08 4.13 25.47 0.21 0.42 0.73
Real LA (cm2
) 400 4.01 32.15 16.07 15.56 16.74 4.09 25.47 0.20 0.43 0.73
Second sowing date - First evaluation - 61 days after sowing
Length (cm) 400 5.40 14.20 10.03 10.10 2.37 1.54 15.35 0.08 -0.08 -0.13
Width (cm) 400 1.40 3.50 2.37 2.40 0.16 0.40 16.79 0.02 -0.02 -0.27
Length / Width Ratio 400 3.19 6.43 4.28 4.16 0.33 0.57 13.32 0.03 0.97 1.06 Length × Width (cm2
) 400 7.56 45.44 24.19 23.76 49.46 7.03 29.07 0.35 0.26 -0.35 LA – Digimizer (cm2
) 400 5.44 31.43 17.55 17.15 26.65 5.16 29.42 0.26 0.26 -0.39 LA - Sigma Scan Pro
(cm2) 400 5.53 32.00 17.79 17.39 27.46 5.24 29.46 0.26 0.26 -0.38
Real LA (cm2
) 400 5.49 31.66 17.67 17.27 27.05 5.20 29.44 0.26 0.26 -0.39
Second sowing date - Second evaluation - 80 days after sowing
Length (cm) 400 4.80 13.40 9.30 9.40 2.64 1.63 17.47 0.08 -0.24 -0.06
Width (cm) 400 1.00 3.50 2.25 2.20 0.29 0.53 23.81 0.03 0.03 -0.36
Length / Width Ratio 400 2.92 6.64 4.23 4.18 0.25 0.50 11.79 0.02 0.75 1.51 Length × Width (cm2
) 400 4.80 44.22 21.68 21.34 70.60 8.40 38.76 0.42 0.42 -0.08 LA – Digimizer (cm2
) 400 3.46 32.22 16.10 15.95 35.18 5.93 36.85 0.30 0.37 -0.03 LA - Sigma Scan Pro
(cm2
) 400 3.55 32.71 16.23 16.04 35.76 5.98 36.85 0.30 0.38 -0.03
Real LA (cm2
) 400 3.51 32.47 16.16 16.01 35.46 5.95 36.84 0.30 0.37 -0.03
Variable (unit) n Min. Max. Mean Median Var. SD VC SE Asym. kurtosis
Second sowing date - Third evaluation - 92 days after sowing
Length (cm) 400 3.40 12.80 8.56 8.60 3.45 1.86 21.70 0.09 -0.11 -0.42
Width (cm) 400 0.80 3.00 2.01 2.10 0.22 0.47 23.21 0.02 -0.42 -0.68
Length / Width Ratio 400 3.22 5.94 4.31 4.25 0.34 0.59 13.58 0.03 0.44 -0.53 Length × Width (cm2
) 400 2.72 36.25 17.96 18.37 50.72 7.12 39.66 0.36 0.04 -0.69 LA – Digimizer (cm2
) 400 2.08 26.77 13.05 13.33 25.67 5.07 38.82 0.25 0.03 -0.61 LA - Sigma Scan Pro
(cm2) 400 2.11 27.22 13.29 13.62 26.40 5.14 38.67 0.26 0.02 -0.61
Real LA (cm2
) 400 2.10 27.00 13.17 13.44 26.03 5.10 38.74 0.26 0.03 -0.61
Second sowing date - Fourth evaluation - 104 days after sowing
Length (cm) 400 3.70 13.40 8.52 8.40 4.20 2.05 24.05 0.10 0.04 -0.82
Width (cm) 400 0.90 3.30 2.04 2.10 0.33 0.57 28.00 0.03 -0.05 -0.94
Length / Width Ratio 400 2.95 5.78 4.27 4.29 0.33 0.57 13.38 0.03 0.27 -0.23 Length × Width (cm2
) 400 3.60 44.22 18.38 17.97 76.09 8.72 47.45 0.44 0.33 -0.75 LA – Digimizer (cm2
) 400 2.57 31.96 13.36 13.13 39.08 6.25 46.81 0.31 0.32 -0.74 LA - Sigma Scan Pro
(cm2) 400 2.57 31.76 13.32 13.07 38.56 6.21 46.64 0.31 0.31 -0.75
Real LA (cm2
) 400 2.57 31.86 13.34 13.12 38.82 6.23 46.72 0.31 0.31 -0.75
Total leaf used to generate the models of LA estimation
Length (cm) 3.200 3.40 14.60 9.41 9.50 3.36 1.83 19.49 0.03 -0.19 -0.14
Width (cm) 3.200 0.80 3.60 2.16 2.20 0.27 0.52 23.85 0.01 0.11 -0.21
Length / Width Ratio 3.200 2.92 7.13 4.45 4.30 0.57 0.76 16.97 0.01 0.77 0.26 Length × Width (cm2
) 3.200 2.72 47.88 21.04 20.37 65.60 8.10 38.50 0.14 0.41 0.04 LA – Digimizer (cm2
) 3.200 1.74 36.69 15.53 15.08 35.20 5.93 38.21 0.10 0.40 0.09 LA - Sigma Scan Pro
(cm2
) 3.200 1.75 35.51 15.64 15.25 35.18 5.93 37.92 0.10 0.36 0.02
Real LA (cm2
) 3.200 1.75 36.10 15.59 15.14 35.17 5.93 38.05 0.10 0.38 0.05
TABLE II
Number of leaves (n), minimum (Min.), maximum (Max.), mean, median, variance (Var.), standard deviation (SD), variation coefficient (VC, %), standard error (SE), asymmetry(Asym.) and kurtosis for evaluated variables in 800 leaves
of Crotalaria juncea - measuring 100 leaves by evaluation in each sowing - used only to validate the leaf area estimation
models in terms of linear dimensions in the 2014/15 harvest in Itaqui - RS - Brazil.
Variable (unit) n Min. Max. Mean Median Var. SD VC SE Asym. kurtosis
First sowing date - First evaluation - 59 days after sowing
Length (cm) 100 5.90 13.40 9.83 9.75 2.80 1.67 17.04 0.17 0.06 -0.42
Width (cm) 100 1.30 3.20 2.17 2.15 0.19 0.43 19.97 0.04 0.13 -0.29
Length / Width Ratio 100 3.21 6.18 4.59 4.55 0.31 0.56 12.22 0.06 0.36 0.65 Length × Width (cm2
) 100 7.67 40.20 21.92 19.68 58.28 7.63 34.83 0.76 0.55 -0.17 Real Leaf Area (cm2) 100 5.35 30.93 16.38 14.92 33.49 5.79 35.34 0.58 0.65 0.00
First sowing date - Second evaluation - 82 days after sowing
Length (cm) 100 5.10 12.90 9.45 9.65 3.09 1.76 18.62 0.18 -0.55 -0.13
Width (cm) 100 1.00 3.10 2.06 2.20 0.23 0.48 23.41 0.05 -0.42 -0.77
Length / Width Ratio 100 3.41 6.25 4.67 4.62 0.34 0.58 12.41 0.06 0.47 -0.01 Length × Width (cm2
) 100 5.80 37.82 20.20 21.40 56.23 7.50 37.13 0.75 -0.22 -0.84 Real Leaf Area (cm2) 100 3.84 26.17 14.98 15.78 32.26 5.68 37.91 0.57 -0.25 -0.82
First sowing date - Third evaluation - 102 days after sowing
Length (cm) 100 6.20 11.20 8.82 9.00 1.63 1.28 14.48 0.13 -0.02 -0.85
Width (cm) 100 1.10 2.50 1.72 1.70 0.10 0.31 18.26 0.03 0.04 -0.47
Length / Width Ratio 100 3.70 7.27 5.21 5.20 0.59 0.77 14.76 0.08 0.28 -0.22 Length × Width (cm2
) 100 6.82 26.25 15.44 15.35 19.67 4.44 28.73 0.44 0.13 -0.71 Real Leaf Area (cm2
) 100 6.00 20.86 11.78 11.81 11.65 3.41 28.98 0.34 0.23 -0.68 First sowing date - Fourth evaluation - 129 days after sowing
Length (cm) 100 6.60 13.00 9.98 10.05 1.70 1.30 13.07 0.13 -0.20 -0.31
Width (cm) 100 1.10 2.40 1.84 1.80 0.07 0.27 14.82 0.03 -0.23 -0.05
Length / Width Ratio 100 4.30 7.00 5.46 5.42 0.32 0.57 10.40 0.06 0.29 -0.14 Length × Width (cm2
) 100 7.26 30.00 18.65 18.63 22.26 4.72 25.29 0.47 0.06 -0.34 Real Leaf Area (cm2
Variable (unit) n Min. Max. Mean Median Var. SD VC SE Asym. kurtosis
Second sowing date - First evaluation - 61 days after sowing
Length (cm) 100 6.20 12.40 9.09 9.00 1.93 1.39 15.29 0.14 0.24 -0.54
Width (cm) 100 1.30 3.20 2.25 2.20 0.18 0.42 18.63 0.04 0.13 -0.38
Length / Width Ratio 100 3.35 6.15 4.10 3.95 0.39 0.62 15.14 0.06 1.68 2.63 Length × Width (cm2
) 100 8.19 39.68 20.89 19.45 44.08 6.64 31.79 0.66 0.60 -0.27 Real Leaf Area (cm2
) 100 6.74 28.22 15.30 14.19 23.22 4.82 31.49 0.48 0.67 -0.13 Second sowing date - Second evaluation - 80 days after sowing
Length (cm) 100 5.30 11.10 8.38 8.30 1.84 1.36 16.18 0.14 0.04 -0.70
Width (cm) 100 1.10 2.70 1.85 1.80 0.10 0.31 16.95 0.03 0.04 -0.29
Length / Width Ratio 100 3.15 6.79 4.64 4.42 0.96 0.98 21.10 0.10 0.40 -0.84 Length × Width (cm2
) 100 7.42 26.19 15.59 14.82 15.91 3.99 25.59 0.40 0.22 -0.37 Real Leaf Area (cm2
) 100 5.85 20.07 11.98 11.66 8.24 2.87 23.95 0.29 0.19 -0.31
Second sowing date - Third evaluation - 92 days after sowing
Length (cm) 100 4.00 11.60 8.92 9.30 2.23 1.49 16.75 0.15 -1.11 1.15
Width (cm) 100 0.80 2.50 1.81 1.90 0.13 0.36 20.02 0.04 -0.77 0.08
Length / Width Ratio 100 4.00 6.36 4.98 5.00 0.16 0.41 8.15 0.04 0.27 0.64 Length × Width (cm2
) 100 3.20 29.00 16.63 17.84 28.42 5.33 32.07 0.53 -0.56 -0.21 Real Leaf Area (cm2) 100 2.46 21.46 12.29 13.14 15.41 3.93 31.95 0.39 -0.58 -0.12
Second sowing date - Fourth evaluation - 104 days after sowing
Length (cm) 100 5.50 10.70 8.52 8.70 1.70 1.30 15.31 0.13 -0.44 -0.66
Width (cm) 100 0.90 3.00 1.90 1.90 0.20 0.45 23.81 0.05 -0.08 -0.62
Length / Width Ratio 100 3.41 6.20 4.62 4.55 0.59 0.77 16.57 0.08 0.37 -0.89 Length × Width (cm2) 100 4.95 31.80 16.64 16.16 34.54 5.88 35.32 0.59 0.16 -0.51
Real Leaf Area (cm2
) 100 3.90 22.74 12.18 11.88 18.26 4.27 35.09 0.43 0.13 -0.60 Total leaves used only to validate the models of leaf area estimation
Length (cm) 800 4.00 13.40 9.12 9.20 2.40 1.55 16.97 0.05 -0.12 -0.11
Width (cm) 800 0.80 3.20 1.95 2.00 0.18 0.42 21.76 0.02 0.16 -0.05
Length / Width Ratio 800 3.15 7.27 4.78 4.75 0.61 0.78 16.30 0.03 0.28 -0.39 Length × Width (cm2
) 800 3.20 40.20 18.24 18.00 40.20 6.34 34.75 0.22 0.53 0.44 Real Leaf Area (cm2
) 800 2.46 30.93 13.62 13.44 21.90 4.68 34.35 0.17 0.54 0.65
TABLE III
Potency, quadratic and linear type models for the determination of the real leaf area (Y) - using the length, width and/or the length times width product as independent variables (x) - and the determination coefficient (R2) of each model, based
on 3,200 leaves of Crotalaria juncea. Validation of nine models based on the indicators: linear coefficients
(a), angular (b), linear correlation of Pearson (r) and determination (R2), mean absolute error (MAE) and d index of
Willmott (d), calculated based on observed and estimated 800 leaves leaf area of Crotalaria juncea in the 2014/15 harvest
in Itaqui - RS - Brazil.
Models generated with 3,200 leaves evaluated in four times by two sowing date
Type Independent variable (x) Model R2
1) Potency Length Ŷ = 0.1980x1.9284
0.8721
2) Potency Width Ŷ = 4.3940x1.5964
0.8718
3) Potency Length × Width Ŷ = 0.7665x0.9889
0.9873
4) Quadratic Length Ŷ = 0.2942x + 0.1397x2
0.8161
5) Quadratic Width Ŷ = 3.6776x + 1.5479x2
0.8551
6) Quadratic Length × Width Ŷ = 0.7566x - 0.0007x2 0.9853
7) Linear Length Ŷ = 1.7027x 0.6686
8) Linear Width Ŷ = 7.3902x 0.7713
9) Linear Length × Width Ŷ = 0.7390x 0.9849
Validation of models with 800 leaves evaluated in four times by two sowing date
Type Independent variable (x) a(1) b(2) r(3) R2
MAE d
1) Potency Length 2.467* 0.877* 0.896* 0.804 1.851 0.939
2) Potency Width 1.167* 0.872* 0.912* 0.833 1.577 0.950
3) Potency Length × Width 0.113ns
0.984* 0.990* 0.982 0.497 0.995
4) Quadratic Length 3.198* 0.840* 0.896* 0.804 1.919 0.933
5) Quadratic Width 2.216* 0.816* 0.912* 0.833 1.520 0.951
6) Quadratic Length × Width 0.199* 0.980* 0.990* 0.982 0.494 0.995
7) Linear Length 8.702* 0.501* 0.890* 0.793 2.739 0.815
8) Linear Width 6.096* 0.610* 0.910* 0.830 1.888 0.906
9) Linear Length × Width -0.032ns
0.991ns
0.990* 0.982 0.508 0.995 10) Model by Cardozo
et al. (2011):Y = 0.7160x Length × Width -0.031 ns
0.961 * 0.990 * 0.982 0.852 0.991 (1) *Linear coefficient differs from zero, by t test, at 5% of error probability. ns non-significant. (2) * Angular coefficient differs from
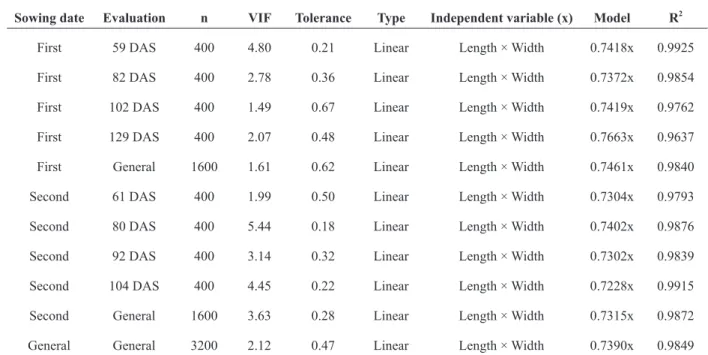
TABLE IV
Number of leaves (n), variance inflation factor (VIF), tolerance, and linear models for the determination of the real leaf area (Y) using the length times width product as independent variables (x) - and the determination coefficient (R2) of each
model, based on sowing dates and ages (Days after sowing – DAS) of Crotalaria juncea. Validation of models isbased on
the indicators: linear coefficients (a), angular (b), linear correlation of Pearson (r) and determination (R2), mean absolute
error (MAE) and d index of Willmott (d), calculated based on observed and estimated 800 leaves of Crotalaria juncea leaf
area on the 2014/15 harvest in Itaqui - RS - Brazil.
Sowing date Evaluation n VIF Tolerance Type Independent variable (x) Model R2
First 59 DAS 400 4.80 0.21 Linear Length × Width 0.7418x 0.9925
First 82 DAS 400 2.78 0.36 Linear Length × Width 0.7372x 0.9854
First 102 DAS 400 1.49 0.67 Linear Length × Width 0.7419x 0.9762
First 129 DAS 400 2.07 0.48 Linear Length × Width 0.7663x 0.9637
First General 1600 1.61 0.62 Linear Length × Width 0.7461x 0.9840
Second 61 DAS 400 1.99 0.50 Linear Length × Width 0.7304x 0.9793
Second 80 DAS 400 5.44 0.18 Linear Length × Width 0.7402x 0.9876
Second 92 DAS 400 3.14 0.32 Linear Length × Width 0.7302x 0.9839
Second 104 DAS 400 4.45 0.22 Linear Length × Width 0.7228x 0.9915
Second General 1600 3.63 0.28 Linear Length × Width 0.7315x 0.9872
General General 3200 2.12 0.47 Linear Length × Width 0.7390x 0.9849
Validation of models with 800 leaves evaluated in four times by two sowing date
Sowing date Evaluation a(1) b(2) r(3) R2
MAE d
First 59 DAS -0.032ns
0.995 ns
0.990* 0.982 0.502 0.995
First 82 DAS -0.031ns
0.989 * 0.990* 0.982 0.514 0.995
First 102 DAS -0.032 ns 0.995 ns 0.990* 0.982 0.502 0.995
First 129 DAS -0.033 ns
1.028 * 0.990* 0.982 0.591 0.994
First General -0.032 ns
1.001 ns
0.990* 0.982 0.501 0.995
Second 61 DAS -0.031ns
0.980 * 0.990* 0.982 0.547 0.994
Second 80 DAS -0.032 ns
0.993 ns
0.990* 0.982 0.505 0.995
Second 92 DAS -0.031 ns
0.980 * 0.990* 0.982 0.548 0.994
Second 104 DAS -0.031 ns
0.970 * 0.990* 0.982 0.604 0.993
Second General -0.031 ns
0.981 * 0.990* 0.982 0.540 0.994
General General -0.032 ns
0.991ns
0.990* 0.982 0.508 0.995
(1) *Linear coefficient differs from zero, by t test, at 5% of error probability. ns non-significant. (2) * Angular coefficient differs from
(2014), this procedure is the most appropriate from a biological point of view.
The potency type models showed the best settings for the estimation of leaf area in function
of L (R2 = 0.8721) and W (R2 = 0.8718), when
compared to the quadratic and linear models (Table III). In agricultural species such as pigeonpea
(Cargnelutti Filho et al. 2015b), sunflower (Aquino
et al. 2011), gladiolus (Schawb et al. 2014) and snap bean (Toebe et al. 2012), the potency model was also the most suitable for estimation of leaf area based on only one of the linear dimensions, according to the results obtained in this work. Based on L × W, the three models of leaf area estimation (linear, quadratic and potency) showed
similar adjustments. Thus, the linear models (Ŷ =
0.7390x and R2 = 0.9849), quadratic (Ŷ = 0.7566x
– 0.0007x2 and R2 = 0.9853) and potency (Ŷ =
0.7665x0.9889 and R2 = 0.9873) of leaf area (Y) in the
product length × width (x) function are the most
recommended to estimate the Crotalaria juncea
leaf area, based on the coefficient of determination. The variance inflation factor (Cristofori et al. 2007)
and the tolerance factor (Rouphael et al. 2010, Toebe and Cargnelutti Filho 2013) indicated low collinearity between L × W in each evaluation and sowing season, as well as in the general with 3,200 leaves (Table IV). Therefore, the leaf area of
Crotalaria juncea can be estimated as a function of the product of L × W.
In the models validation using the 800 randomly separated leaves, the potency type model
showed the best fit to estimate the leaf area of the length or width function, with linear coefficients closer to zero, angular coefficients closer to one,
higher scores of correlation coefficient, higher scores of determination coefficient and higher scores of Willmott d index, as well as the lowest mean absolute error relative to quadratic and linear
models (Table III). However, the angular coefficients differ from one and the linear coefficients differ
from zero among the 800 estimated values of leaf
area by the models and 800 observed real leaf area values, indicating that these potency type models based on a single dimension are not suitable for the leaf area estimation, being even higher than the linear and quadratic models.
The leaf area estimation models from the length × width measurement showed higher
adjustments, which was confirmed by the validation
(Table III). Thus, the mean absolute error (0.494
≤ MAE ≤ 0.508) of validation model based on
the L × W was smaller than when only L or W was used, indicating that the leaf area estimative is the most accurate using the L × W. Therefore, the three models generated from L × W showed
higher values of Pearson correlation coefficients, determination coefficients and d index of Willmott
closer to one (Table III). Among the three models generated based on L × W, the most outstanding
model was the linear type (Ŷ = 0.7390x and R2 = 0.9849), since its linear coefficient did not differ from zero (a = -0.032ns) and the angular coefficient (b = 0.991ns) was not statistically different from one.
This means that if the real leaf area value is zero, the leaf area estimated value will also be close to
zero (a = -0.032ns) and the measure in which the real
leaf area increases by a unit, the leaf area estimated by the model will also increase approximately one
unit (b = 0.991ns). It was also verified that even if
a model were generated from a single collection or sowing season, it would present good predictive capacity, with validation indicators close to those
verified with the model generated with all 3,200
leaves (Table IV). Already the model proposed
by Cardozo et al. (2011), Ŷ = 0.7160x had a good
performance in the validation process (Table III), although the angular coefficient has differed by one, indicating a small underestimation of leaf area based on the validation data of the present study.
Figure 2a - Relationship of leaf area and leaf area estimated by linear model Ŷ = 0.7390x (R2 = 0.9849) in 800 leaves of Crotalaria juncea used in the validation, being x the length × width product of each leaf.
real leaf area. In previous studies of the culture (Cardozo et al. 2011) and in other crops such as potatoes (Busato et al. 2010), crambe (Toebe et al. 2010) and cowpea (Lima et al. 2008), the generated models based on the product of two linear dimensions also showed a better leaf area prediction. In pigeonpea, the linear model based on L × W should be adopted by the simplicity and applicability (Cargnelutti Filho et al. 2015a). In this sense, Monteiro et al. (2005) concludes that the cotton leaf area can be estimated with good accuracy and excellent precision from the L × W product.
The real (Y) and estimated leaf area by linear
model Ŷ = 0.7390x (R2 = 0.9849) among the 800
leaves used for the validation showed a linear relationship (Figure 2a). According to Antunes et al. (2008) and Pompelli et al. (2012), even though the models generated with a linear dimension appeared
to be good fits, in general these models showed
biased estimates, particularly in cases of small and large leaves, with errors not adjusting to a normal distribution. In the present study, it was found that the use of the linear model for estimation of leaf area (Y) in function of the L × W product showed well distributed residue without trends biased in small and large leaves (Figure 2b). Therefore, by
presenting a linear coefficient not different from zero, angular coefficient not differing from one,
high correlation and determination coefficients and still low mean absolute error value and high value of d of Willmott and residue well distributed,
it is recommended to use the model Ŷ = 0.7390x
in function of the product of the length times the width (x) for estimating the Crotalaria juncea real leaf area (Y).
CONCLUSIONS
The Crotalaria juncea leaf areas determined in Digimizer and Sigma Scan Pro software are the same, and it is the researcher’s criterion to choose
which software to use to determine the real leaf area for processing digital images. In Crotalaria juncea, the leaf area estimation models in function of the length times width product have higher adjustments to those obtained based on the evaluation of only one linear dimension (length or width), regardless the model type considered (potency, quadratic
or linear). The linear model Ŷ = 0.7390x (R2 =
0.9849) of the real leaf area (Y) in function of the length times width (x) product is suitable for the estimation of Crotalaria juncea leaf area, attending all the employed validation criteria.
ACKNOWLEDGMENTS
We thank to the scholarship students and volunteers for their help in conducting experimental and data collection. To the Conselho Nacional de Desenvolvimento Científico e Tecnológico (CNPq), to the Fundação de Amparo à Pesquisa do Estado do Rio Grande do Sul (FAPERGS), to the Programa de Educação Tutorial and the Fundação Universidade Federal do Pampa (UNIPAMPA) by
scholarships and financial support. To the company
Piraí Sementes® for granting Crotalaria juncea
seeds to research purposes.
REFERENCES
ADAMI M, HASTENREITER FA, FLUMIGNAN DL AND FARIA RT. 2008. Estimativa de área de folíolos de soja usando imagens digitais e dimensões foliares. Bragantia 67: 1053-1058.
ANTUNES WC, POMPELLI MF, CARRETERO DM AND DAMATTA FM. 2008. Allometric models for non-destructive leaf area estimation in coffee (Coffea arabica
and Coffea canephora). Ann Appl Biol 153: 33-40. AQUINO LA, SANTOS JÚNIOR VC, GUERRA JVS AND
COSTA MM. 2011. Estimativa da área foliar do girassol por método não destrutivo. Bragantia 70: 832-836. BLANCO FF AND FOLEGATTI MV. 2005. Estimation of
leaf area for greenhouse cucumber by linear measurements under salinity and grafting. Sci Agr 62: 305-309.
CARDOZO NP, PARREIRA MC, AMARAL CL, ALVES PLCA AND BIANCO S. 2011. Estimativa da área foliar de Crotalaria juncea L. a partir de dimensões lineares do limbo foliar. Biosci J 27: 902-907.
CARGNELUTTI FILHO A, TOEBE M, ALVES BM AND BURIN C. 2015a. Estimação da área foliar de feijão guandu por dimensões foliares. Cienc Rural 45: 1-8. CARGNELUTTI FILHO A, TOEBE M, ALVES BM,
BURIN C AND KLEINPAUL JA. 2015b. Estimação da área foliar de canola por dimensões foliares. Bragantia 74: 139-148.
CARGNELUTTI FILHO A, TOEBE M, BURIN C, FICK AL AND CASAROTTO G. 2012. Estimativa da área foliar de nabo forrageiro em função de dimensões foliares. Bragantia 71: 47-51.
C R I S TO F O R I V, R O U P H A E L Y, M E N D O Z A-D E GYVES E AND BIGNAMI C. 2007. A simple model for estimating leaf area of hazelnut from linear measurements. Sci Hortic 113: 221-225.
EMBRAPA. 2013. Sistema brasileiro de classificação de solos. Brasília: EMBRAPA, 353 p.
EMBRAPA. 2014. Adubação verde e plantas de cobertura no Brasil: fundamentos e prática. Brasília: EMBRAPA, 507 p.
FALLOVO C, CRISTOFORI V, MENDOZA-DE GYVES E, RIVERA CM, REA R, FANASCA S, BIGNAMI C, SASSINE Y AND ROUPHAEL Y. 2008. Leaf area estimation model for small fruits from linear measurements. HortScience 43: 2263-2267.
FAVARIN JL, DOURADO NETO D, GARCÍA AG,NOVA NAV AND FAVARIN MGGV. 2002. Equações para a estimativa do índice de área foliar do cafeeiro. Pesqui Agropecu Bras 37: 769-773.
FONTANÉTTI A, CARVALHO GJ, GOMES LAA, ALMEIDA K, MORAES SRG AND TEIXEIRA CM. 2006. Adubação verde na produção orgânica de alface americana e repolho. Hortic Bras 24: 146-150.
GAMIELY S, RANDEL WM, MILLS HA AND SMITTLE DA. 1991. A rapid and nondestructive method for estimating leaf area of onions. HortScience 26: 206. GODOY LJG, YANAGIWARA RS, VILLAS BÔAS RLV,
BACKES C AND LIMA CP. 2007. Análise da imagem digital para estimativa da área foliar em plantas de laranja “Pêra”. Rev Bras Frutic 29: 420-424.
JANDEL SCIENTIFIC. 1991. User’s manual. California, 280 p. LIMA CJGS, OLIVEIRA FA, MEDEIROS JF, OLIVEIRA
MKT AND OLIVEIRA FILHO AF. 2008. Modelos matemáticos para estimativa de área foliar de feijão caupi. Rev Caatinga 21: 120-127.
LUCENA RRM, BATISTA TMV, DOMBROSKI JLD, LOPES WAR AND RODRIGUES GSO. 2011. Medição de área foliar de aceroleira. Rev Caatinga 24: 40-45.
MALDANER IC, HELDWEIN AB, LOOSE LH, LUCAS DDP, GUSE FI AND BERTOLUZZI MP. 2009. Modelos de determinação não-destrutiva da área foliar em girassol. Cienc Rural 39: 1356-1361.
MEDCALC SOFTWARE. 2015. Digimizer image analysis software manual. Belgium.
M E N D O Z A - D E G Y V E S E , R O U P H A E L Y, CRISTOFORI V AND ROSANA MIRA F. 2007. A non-destructive, simple and accurate model for estimating the individual leaf area of kiwi (Actinidia deliciosa). Fruits 62: 171-176.
MONTEIRO JEBA, SENTELHAS PC, CHIAVEGATO EJ, GUISELINI C, SANTIAGO AV AND PRELA A. 2005. Estimação da área foliar do algodoeiro por meio de dimensões e massa das folhas. Bragantia 64: 15-24.
POMPELLI MF, ANTUNES WC, FERREIRA DTRG, CAVALCANTE PGS, WANDERLEY-FILHO HCL AND ENDRES L. 2012. Allometric models for non-destructive leaf area estimation of Jatropha curcas. Biomass and Bioenergy 36: 77-85.
RIVERA CM, ROUPHAEL Y, CARDARELLI M AND COLLA G. 2007. A simple and accurate equation for estimating individual leaf area of eggplant from linear measurements. Europ J Hort Sci 72: 228-230.
R O U P H A E L Y, M O U N E I M N E A H , I S M A I L A , MENDOZA-DE GYVES E, RIVERA CM AND COLLA G. 2010. Modeling individual leaf area of rose (Rosa hybrida L.) based on leaf length and width measurement. Photosynthetica 48: 9-15.
R O U P H A E L Y, R I V E R A C M, C A R D A R E L L I M, FANASCA S AND COLLA G. 2006. Leaf area estimation from linear measurements in zucchini plants of different ages. J Hort Sci Biotechnol 81: 238-241.
SCHWAB NT, STRECK NA, REHBEIN A, RIBEIRO BSMR, ULHMANN LO, LANGNER JA AND BECKER CC. 2014. Dimensões lineares da folha e seu uso na determinação do perfil vertical foliar de gladíolo. Bragantia 73: 97-105.
STATSOFT. 2015. Statistica 12.0 Software. Tucksa: USA. TOEBE M, BRUM B, LOPES SJ, CARGNELUTTI FILHO
A AND SILVEIRA TS. 2010. Estimativa da área foliar de
Crambe abyssinica por discos foliares e por fotos digitais. Cienc Rural 40: 475-478.
TOEBE M AND CARGNELUTTI FILHO A. 2013. Multicollinearity in path analysis of maize (Zea mays L.). J Cereal Sci 57: 453-462.
VALENZUELA H AND SMITH J. 2002. ‘Tropic sun’ sunnhemp. Hawaii: Cooperative Extension Service, College of Tropical Agriculture and Human Resources. 3 p. (Sustainable Agriculture Green Manure Crops, August 2002, SA-GM-11).
VIEIRA JÚNIOR PA, DOURADO NETO D, CICERO SM, CASTRO JORGE LA, MANFRON PA AND MARTIN TN. 2006. Estimativa da área foliar em
milho através de análise de imagens. Rev Bras Milho Sorgo 5: 58-66.
WILLMOTT CJ. 1981. On the validation of models. Phys Geography 2: 184-194.