Seismic Vulnerability Analysis in 3D City Models (3DCM)
Paula REDWEIK1, Paula TEVES COSTA1, Inês VILAS BOAS2, Teresa SANTOS3
1 Instituto Dom Luiz, Faculdade de Ciências, Universidade de Lisboa, Lisbon, Portugal, [email protected],
2 Dep. Engenharia Geográfica Geofísica e Energia, Faculdade de Ciências da Universidade de Lisboa, Lisbon, Portugal,
3 CICS.NOVA - Centro Interdisciplinar de Ciências Sociais, Faculdade de Ciências Sociais e Humanas, Universidade Nova
de Lisboa, Lisbon, Portugal, [email protected]
Abstract: Lisbon is a city with high seismic risk, having been hit in the past by strong earthquakes. That’s the reason why several seismic vulnerability studies have been made devoted to the buildings of the capital, aiming the creation of different scenarios that depend on the magnitude and source location of the earthquake. The results of these studies have been presented as maps resulting from crossing information contained in 2D layers and presented in a GIS environment.
3D City Models (3DCM) intend to associate a database of a city to a rigorous geospatial representation and close to the visible reality in an urban environment, combining geometry and semantics. As such, they may include tools that convey attribute analysis at different levels, allowing the generation of new knowledge on a phenomenon or its effects, not only at the statistical level but also in terms of visual impact on the object. In this project it is intended to extend into the third dimension a seismic vulnerability study of the buildings of Lisbon held in 2D and explore the gains of spatial analysis in 3D representations. The various parameters that contribute to assess seismic vulnerability of buildings may be analyzed individually or simultaneously. The application of this tool will be demonstrated in a pilot area of Lisbon.
Keywords: Buildings vulnerability, 3D-GIS, seismic risk, 3D models
1. Introduction
The vulnerability of an urban area sets the inherent weakness of a city to certain aspects susceptible to cause damage due to social and biophysical characteristics or even due to urban morphology (Rashed and Weeks, 2003). The vulnerability analysis is required to determine the urban risk, which in turn indicates the degree of potential loss at each site due to a specific hazard and arises as the product of the probability with which the hazardous phenomenon happens with certain magnitude by the degree of vulnerability (risk = hazard x vulnerability). Thus, the vulnerability, unlike the risk is i ndependent of the degree to which the dangerous event itself occurs, depending, instead, on the context in which it occurs, and the physical and social conditions in each local (Rashed and Weeks, 2003).
The use of 3D City Models (3DCM) as support for risk management follows the conclusion advocated by some authors, that the 3D graphical views represent a communication tool even more effective than 2D maps already commonly used in studies of vulnerability, hazard and risk. 3D views significantly reduce the cognitive effort necessary to interpret data and analysis results, thereby improving the efficiency of the decision-making process (Kemec et al., 2009). In addition, showing citizens the urban environment from a perspective close to everyday reality awakens them to risk awareness, which may have positive consequences (alert for taking preventive measures) or negative consequences (alarmism, depreciation of certain property, localized increase of insurance premiums).
One of the urban elements that mostly influences the degree of seismic vulnerability of a city is the building stock (typology, design, age and conservation state of the buildings), although urban infrastructure, both above and underground, are as much or more vulnerable, considering the 'cascading effects' associated with them that will ultimately affect structures that originally were not directly destroyed by the earthquake. A common feature of these elements, buildings and infrastructure, is their three-dimensional geometric development.
For a 3DCM to suit certain goals, a set of constraints must be defined a priori, such as the concrete objective of the model and the public that will explore it, the geospatial extension of the model, the elements to be included in the model and the level of detail/accuracy of the representation of these elements (LOD - level of detail). Dependent on these conditions, it follows the acquisition phase of the geometric data and attributes to be associated with the elements, which must be in accordance to the objective. After the critical stage of geometric and semantics modelling of elements and attributes, using geometric primitives and data models either established or adapted to the objective in question, it comes the model exploitation phase, which may involve not only passive viewing and navigation in the model, but also the user's interaction, which has to be made possible, such as the ability to perform spatial analysis to gain new knowledge from the modelled data.
In this work it is intended to generate a 3DCM for the study of the seismic vulnerability of the buildings in Lisbon analysing its advantages, exemplifying in a pilot area. The project's conditioning parameters are set in the following section. The methodology is presented in Section 3, while Section 4 summarizes the results obtained and the respective analysis. Section 5 gathers some final conclusions.
2. Project definition
In the following, the constraints of the project and the aspects considered in their definition are presented. Objective of the 3DCM: The model is intended to enable a seismic vulnerability study of the buildings of a city.
Target audience: Experts, elected officials, planners, civil protection agents, those involved in emergency response.
Extension of 3DCM: Area of the Municipality of Lisbon. Although the prototype is applied to a pilot zone, the study is not confined to that zone, extending throughout the city.
Elements to include: Elements at risk to consider in the study and framing elements: - Ground;
- Buildings with spatial and vulnerability attributes;
- Streets with spatial attributes. Underground roads (in tunnels) will not be considered.
follow: two of spatial nature of the area to study (extension of urban area, population density), two of spatial nature of the hazardous event (spatial dispersion; affected area), three of temporal nature of the hazard (speed of onset, duration, frequency) and finally a single criterion that is related to the penetration of the inner space of the building caused by the event (for example, floods and avalanches invade the interior of buildings with external material; earthquakes, by itself, do not). While the scale values to be assigned to the first seven criteria go from 1 to 5, the eighth criterion is of binary nature, having only values of 0 (non-penetrating) or 1 ((non-penetrating). The meaning of the values of the scale of 1 to 5 is different for each of the criteria and is explained in Tables 1, 2 and 4. Note that the classification of Tables 1 and 2 comes from Kemec et al. (2009) and refers to the geographical reality of Turkey concerning the two parameters, here assumed valid also for Portugal, but eventually needing calibration. In Tables 3 and 4, the values assigned to each criterion in the decision tree for the present case - Lisbon and seismic hazard - can be seen. Table 3 refers to criteria dependent on the study area while Table 4 refers to criteria describing the hazard under study.
Table 1:Scale for criterion Urban Area Extension (from Kemec et al., 2009)
Classes for Urban Area Extension (em ha)
Attribute value
726 < area <= 4516 1
4516 < area <= 5089 2
5089 < area <= 8880 3
8880 < area <= 33940 4
33940 < area <= 199632 5
Table 2:Scale of criterion Population Density (from Kemec et al., 2009)
Classes of population density (per/ha)
Attribute value
0.65 < dens <= 4.47 5
4.47 < dens <= 5.30 4
5.30 < dens <= 9.12 3
9.12 < dens <= 26.74 2
26.74 < dens <= 108.05 1
Table 3: Values assigned to decision criteria dependent from study area
Criterion Symbol Value for Lisbon Attribute value
Urban Area Extension aue 10000 ha 4
Population Density p 54.77 per/ha 1
Table 4: Values assigned to decision criteria dependent from hazard in question (earthquake in Lisbon)
Criterion Symbol Scale description Attribute value
Frequency f Frequent (5) to Rare (1) 2
Duration d Long (5) to Short (1) 1
Speed of set on so Slow (5) to Rapid (1) 1
Spatial Dispersion sd Large (5) to Small (1) 3
Affected Area ae Extense (5) to Limited (1) 3
Penetration inside i Penetrating (1), Non penetrating (0) 0
The decision rule is based on the intensity value Ivcalculated by equation (1), which is first applied to the
values of the listed attributes and then normalized, Ivnorm (equation 2), resulting in the value D (equation 3)
which defines the LOD (D) to be applied in the 3DCM for the study. Being the attributes scale of each
values indicate a pervasive situation which requires little spatial detail, while lower values indicate one intense situation that requires modelling with high spatial detail (Kemec et al., 2009). The orientation of the scale for population density, with lower values for higher densities causes lower values of Iv, indicating a need
for more detail in the most densely populated areas enabling, in this way, a more detailed analysis of risk.
= [!"#$%&%'
( ) +
"*,-./0 ) 1 2 3 4
56/%7
1 8] (1)
9 :;<>= ?@ABC "DEGIJDEFDFDEG.HEG.H) 3 K (2) L = 9 :;<>+ MNO (3)
The values obtained in the present case are Iv= 7.083,Ivnorm = 1, resulting in D = 1. That means, for the study
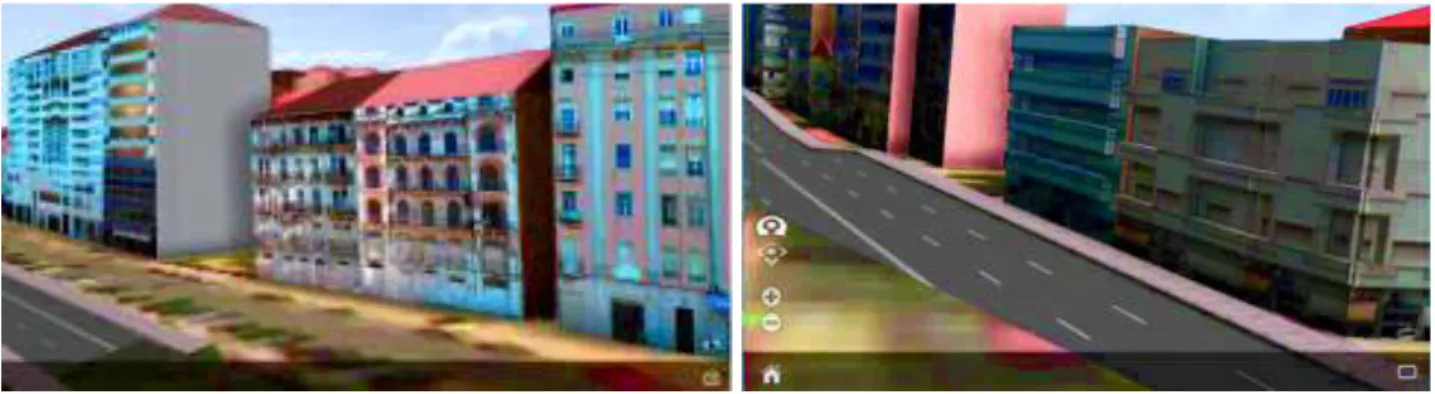
of the seismic vulnerability of the buildings for the complete city of Lisbon, a 3DCM with LOD 1 would be appropriate. If the study area was much less, for example, limited to a parish of medium size, the attribute for the criterion aue would be 1, keeping all other equal, and the resulting D value would be equal to 3, meaning greater detail. In fact, in LOD1, buildings are represented only by geometric blocks (prisms) with the corresponding height but no details whereas in LOD 3 roofs are already modelled with the actual shape and the openings in facades (windows, balconies) are also shaped as well as all associated facilities such as outdoor stairways, lifts accessories on the roof, etc.. In this project, we chose to use LOD1, as recommended, for the full extent improving to LOD2 in the pilot area (Figure 1).
Figure 1– Buildings in the pilot area modelled in LOD2 using CityEngine (ESRI)
Figure 2– Buildings modelled in LOD3 in the pilot area
LOD 3, as recommended for small areas, was also tested (Figure 2) but the modelling was considered to be too time expensive for the kind of study and would exponentially increase the dimensions of the 3D scene hampering the dynamic exploration of the model on the web.
3. Methodology
3.1 Input data
obtained from Dias (2013). For the pilot area attributes such as ‘roof type’ as well as facade textures were also included which came from aerial image analysis and field work.
3.2 Processing
All information was processed in a GIS environment where a spatial database (geodatabase) has been created in ArcMap (ESRI), relating the attributes to each considered unit of study: the building. The used reference system was ETRS89-PT-TM06. Vulnerability was calculated for two probable seismic scenarios as well as the probabilities for each building to suffer damage of several grades in each scenario. To achieve this, the same routines used in Teves-Costa and Barreira (2012) were applied to the present data resulting in a higher resolution vulnerability study at building scale. The geodatabase was then imported into CityEngine (ESRI) to continue with the three-dimensional modelling in LOD2 of the pilot zone. After importing the GDEM Aster to materialize the ground of the area, CGA (Computer Generated Architecture) rules were developed and applied to the buildings’ footprints in order to achieve a geometrical 3D model. They were given the respective height, the roof according to each roof type, appropriate generic textures were applied to the roof and individual textures to the facades, which had also been previously photographically acquired in fieldwork and processed in the office. Also the streets were subjected to 3D modelling of the roadways and sidewalks with assignment of appropriate textures. The next step was creating one 3D information layer for each response to a given type of query performed on several seismic scenarios. In each response layer the buildings appear coloured according to the probability of damage occurrence of a certain grade. Also for this representation a CGA rule was developed for each layer. All layers were then exported together in WebScene format (ESRI extension '.3ws') and can be provided and explored by the users in a web environment by following a link shared with them. The WebScene of the pilot area will be hosted in the ArcGIS Online platform (ESRI) where it can be explored via a CityEngine WebViewer. The 3D model of the whole area of Lisbon cannot be domiciled in the ArcGIS Online platform, due to its dimension, so other solutions are ongoing for delivering and exploring large amounts of 3D data via web.
4. Results
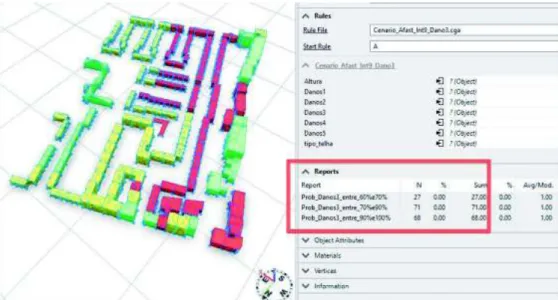
The choice of the three-phase methodology presented - processing the input data in Geodatabase ESRI, 3D geometry modelling in CityEngine and representation in separate layers of answers to appropriate queries - allows providing relevant information in cases where the component responsible for exploring the results in the web has view capabilities but cannot perform queries by attributes or spatial analysis. In CityEngine environment one can not only view information in isolated or combined layers, but also prepare automatic result reports through CGA rules (Figure 3).
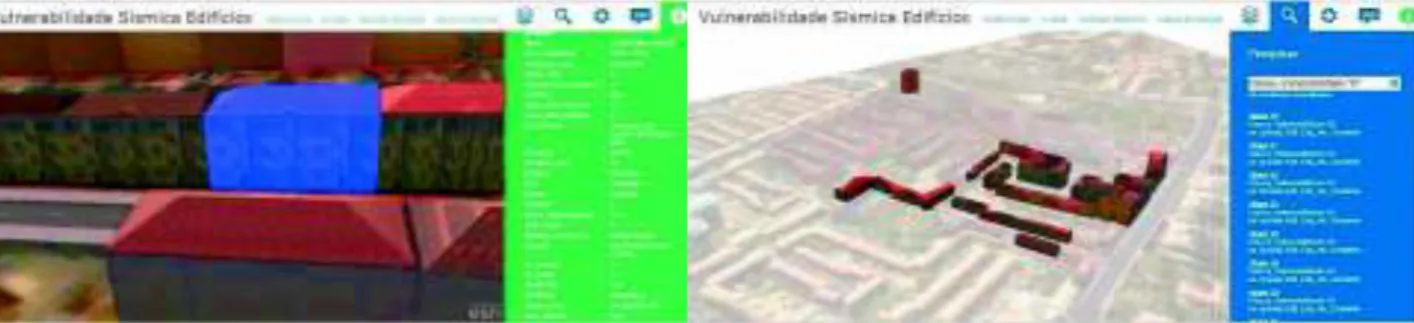
In the web environment, information can indeed be explored by the user, without having to acquire ESRI software, and queries by attributes are possible. However, reports on the data are not available in the web viewer. Here too, new strategies are being developed to enable access to information not only by viewing coloured results but also with the ability to perform calculations and counts on them. Figures 4 to 7 show some examples of results of the interactive exploration of the 3D model for the seismic vulnerability of the pilot area. Each building can be queried individually (in blue in Figure 4) yielding all the corresponding attributes existing in the geodatabase. The whole area can be searched for the buildings of a certain vulnerability class, which appear highlighted (Figure 5). Direct comparisons can be made between the real and the classified buildings according to the probability of damage on a certain earthquake scenario (Figure 6) or between two different earthquake scenarios (Figure 7).
Figure 4 – Query of attributes by building; selected building in blue and list of its attributes on the left
Figure 5 – Buildings in the pilot area with class D vulnerability
Figure 6– Layer comparison: (top) far origin earthquake scenario, intensity 9, probability of damage degree 3; (down) realistic textured 3DCM
Figure 7 – Layer comparison between two different earthquake scenarios of the same intensity for damage degree 3: (top) probability for a far source earthquake; (down) probability for a near source earthquake
5. Conclusion
Figure 8- Similar basic information represented in 2D and 3D: (top) Building typology spatial distribution in Lisbon (left) and in the pilot zone (right) (Teves-Costa and Barreira, 2012); (down) Part of pilot zone (left) same area classified
according to construction epoch (right)
Although LOD1 is recommended for large areas, LOD2 gives the buildings more recognition value that can be an advantage in emergency decision making. The 3D representation of the same basic data is richer and more comprehensive comparing to 2D (Figure 8). Associations of analysis results to geometric properties of the buildings are easier as well as comparisons between several scenarios. The reference to reality is more evident in 3D. In the context of a merely visual simulation of the effects of an earthquake, the results could be presented in an even more realistic way by procedurally modelling the buildings (Holzer, 2016), so that they show damages according to the calculated damage degree (Figure 9). Although suitable, it remains questionable if it should be applied to this kind of study, fearing that it might be too graphic for the public of interest.
Figure 9 –Procedurally modelled damaged building (Holzer, 2016)
Acknowledgments
This communication was partially supported by the project FCT UID/GEO/50019/2013 - Instituto Dom Luiz.
References
CityGML (2016). http://www.opengeospatial.org/standards/citygml , last visited February, 2016
Dias, P. (2013). Elaboration of Lisbon landfill maps using LiDAR and aerial photogrammetry. MSc. Thesis, Faculdade de Ciências, Universidade de Lisboa (in Portuguese).
ESRI (2016). http://www.esri.com , last visited February, 2016.
Kemec, S., Zlatanova, S., Duzgun, H. (2009). Selecting 3d urban visualisation models for disaster management: a rule-based approach. The International Emergency Management Society Annual Conference, Istambul – Turquia, 99-110.
Rashed, T., Weeks, J. (2003). Assessing vulnerability to earthquake hazards through spatial multicriteria analysis of urban areas. International Journal of Geographical Information Science, 17(6), 547-576 DOI: 10.1080/1365881031000114071.
Santos, T., Rodrigues, A. M., Ramalhete, F. (2015). Assessing patterns of urban transmutation through 3D geographical modelling and using historical micro-dataset. Computational Science and Its Applications -- ICCSA 2015, Volume: Part I, 32-44, Springer International Publishing. ISBN 978-3-319-21404-7.
Teves-Costa, P., Barreira, E. (2012). Damage scenarios in Lisbon using RISK-UE approach, 15th World Conference on Earthquake Engineering, Lisboa – Portugal, 10 pp.