1 23
International Journal of Disaster Risk
Science
ISSN 2095-0055
Int J Disaster Risk Sci
DOI 10.1007/s13753-017-0141-x
3D City Models as a Visual Support Tool
for the Analysis of Buildings Seismic
Vulnerability: The Case of Lisbon
1 23
A R T I C L E
3D City Models as a Visual Support Tool for the Analysis
of Buildings Seismic Vulnerability: The Case of Lisbon
Paula Redweik1• Paula Teves-Costa1•Ineˆs Vilas-Boas2• Teresa Santos3
ÓThe Author(s) 2017. This article is an open access publication Abstract 3D city models associate a database of a city to a rigorous geospatial representation that is close to the visi-ble reality by combining appearance, geometry, and semantics. As such, these models may include tools that convey attribute analysis, not only at the statistical level but also in terms of visual appearance of the objects, thus allowing the generation of new knowledge about a phe-nomenon or its effects. Lisbon is a city with a moderate level of seismic risk, and has been hit in the past by strong earthquakes. Several seismic vulnerability studies of buildings have been carried out in Lisbon. These studies generate different scenarios that consider the magnitude and source location of potential earthquakes. The results of these studies were presented as maps obtained from crossing information contained in 2D layers and presented in a GIS environment. In the present study a seismic vul-nerability assessment of Lisbon’s buildings held in 2D is extended to the third dimension, which refines the resolu-tion and the set of parameters and explores the gains of spatial analysis in 3D representations. The numerous parameters that contribute to assess seismic vulnerability of buildings may be analyzed individually or simultaneously as well as in multiple seismic scenarios. Although covering all residential buildings in Lisbon, the application of the 3D
city model is demonstrated with more detail in three pilot areas.
Keywords 3D-GIS3D models Building vulnerabilityLisbonSeismic scenarios
1 Introduction
The inherent weakness of a city to certain aspects of its environment that are susceptible to damage defines its vulnerability. This risk exposure is due to both social and physical characteristics as well as to urban morphology and infrastructure (Rashed and Weeks 2003). Vulnerability analysis is required to determine the level of this urban risk, which in turn indicates the degree of potential loss at each site due to a specific hazard. Risk arises as the product of the probability with which the hazardous phenomenon of a certain magnitude occurs multiplied by the degree of vulnerability (risk=hazard9vulnerability). Thus vul-nerability, unlike risk, is independent of the degree of hazard. It depends, instead, on the context in which the hazard occurs and includes both physical and social con-ditions (Rashed and Weeks 2003).
For a certain hazard, situational awareness is one of the most important factors in decision making (Zlatanova 2008), either before an event, based on planning simula-tions and preventive measures, or immediately after a disaster event through effective emergency management. Also later during the disaster recovery phase, when the verification and recording of damage and planning of mitigation solutions is most important, situation awareness is an absolute requisite.
Each type of hazard affects urban areas and their structures differently. When dealing with the phenomenon & Paula Redweik
1 Instituto Dom Luiz, Faculdade de Cieˆncias, Universidade de
Lisboa, 1749-016 Campo Grande, Lisbon, Portugal
2 ESRI Portugal, R. Julieta Ferra˜o 10, 1600-131 Lisbon,
Portugal
3 CICS.NOVA – Centro Interdisciplinar de Cieˆncias Sociais,
Faculdade de Cieˆncias Sociais e Humanas, Universidade Nova de Lisboa, Av. de Berna, 1069-061 Lisbon, Portugal
of seismicity, urban vulnerability depends on many factors that have a dynamic character in space and time. Variables that affect vulnerability to seismic events can be generally classified as physical (soil geology, topography, ground cover, type of construction, and so on) and social factors (average household income, average age of inhabitants, and other parameters). In most cases, both physical and social factors are likely to be represented in 2D maps, which can be used for spatial analysis in Geographic Information Systems (GIS) as presented, for instance, in Teves-Costa and Barreira (2012) for the city of Lisbon and in Rezaie and Panahi (2015) for the city of Tehran.
Development of 3D city models (3DCM) in this study, as support for urban risk management, follows the con-clusion drawn by several authors (Kemec et al.2009,2010; Zlatanova 2008): 3D graphical representations embody a means of communication that is even more effective than the 2D maps already commonly used in studies of vul-nerability, hazard, and risk. 3D views significantly reduce the cognitive effort necessary to interpret data and analysis results, which improves the efficiency of the decision-making process by national and municipal authorities (Kemec et al.2009). Showing citizens the urban environ-ment from a perspective close to everyday reality increases risk awareness, which may have positive (alert for taking preventive measures) or negative (alarmism, depreciation of certain property, localized increase of insurance premi-ums) consequences. Kemec et al. (2010) developed a 3D city model to support risk management in case of an earthquake. This model elaborated the most suitable data resolution and representation detail for such an application from the point of view of the developer, but left the exploitation of the model for further development.
One of the urban elements that most influences the degree of seismic vulnerability of a city is the quality of the building stock (typology, design, age, and conservation state of the buildings). Urban infrastructure, both above and below ground, is as much or more vulnerable than buildings, since the cascading effects associated with damaged infrastructure will ultimately affect structures that originally were not directly destroyed by the earthquake. An interesting study about the seismic vulnerability of interconnected infrastructure is presented by Poljansek et al. (2010). A common property of these elements, buildings and infrastructure, is their three-dimensional geometric development. The present study focuses on the vulnerability of residential building stock, which is deter-mined at building scale according to the RISK-UE LM1 methodology (Milutinovic and Trendafiloski 2003), and relies on the 3D representation of variables, results and seismic scenarios using a specially generated 3DCM.
In order to create a 3DCM to suit a certain goal, a set of constraints must be defined. In addition to the Level of
Detail (LoD) that defines the level of accuracy with which the elements should be represented in the 3DCM, the classes of elements to include in 3DCM, and the geospatial extension of the model also must be defined. All of these factors must be subordinated to the concrete objective of the model and to the target public that will explore it. Dependent on these preconditions, the geometric data and attributes are collected in accordance with the objective. The geometric and semantic modeling of elements is the next step; this level of model construction uses geometric primitives and data models either established or adapted to the objective in question. The process comes to an end with the model exploitation phase. This phase may involve passive viewing and navigation in the model, but also can incorporate the user’s interaction, such as the ability to perform spatial analysis and to compare several scenarios, which has to be made possible in order to gain new knowledge from the geometrically and semantically mod-eled data.
The seismic vulnerability of residential buildings in Lisbon was calculated and several seismic scenarios were analyzed. The advantages of the use of 3DCM are exem-plified in three pilot areas chosen for their different char-acteristics. In this article, the methodology and the study’s conditioning parameters are presented and the results obtained as well as the corresponding analysis are dis-cussed. As tools, ArcGIS Desktop 10.3 (ESRI 2017), ArcGIS Pro (ESRI2017), CityEngine 2015.1 (ESRI2017), CityEngine Web Viewer (ArcGIS 2017), and Portal for ArcGIS Server (ESRI 2017) from Environmental Systems Research Institute (ESRI) were used as well as Matlab R2015 from Mathworks.1
2 Definition of the 3D City Model in the Study
The constraints of the study and the aspects considered in their definition are as follows:
1. Objective of the 3DCM: The model is intended to enable development of a seismic vulnerability study of the buildings of a city that shows the geometry of the buildings, their geographic position, and their relation-ship to their immediate neighborhood, as well as to construct a database that includes seismic vulnerabil-ity-defining parameters at building scale;
2. Target audience: Experts, elected officials, planners, civil protection agents, and those individuals and agencies involved in emergency response; eventually common citizens should be considered as target audience in the context of risk awareness campaigns;
3. Extension of 3DCM: Area of the municipality of Lisbon (85 km2). Three pilot areas (about 0.25 km2 each) are addressed with more detail;
4. Elements to include: Elements at risk to consider in the study and framing elements are: (a) ground; (b) build-ings with spatial and vulnerability attributes; and (c) streets with spatial attributes. Underground roads (in tunnels) are not considered; and
5. Level of detail: To define the level of detail it is necessary to consider several aspects that will be addressed in the paragraphs that follow.
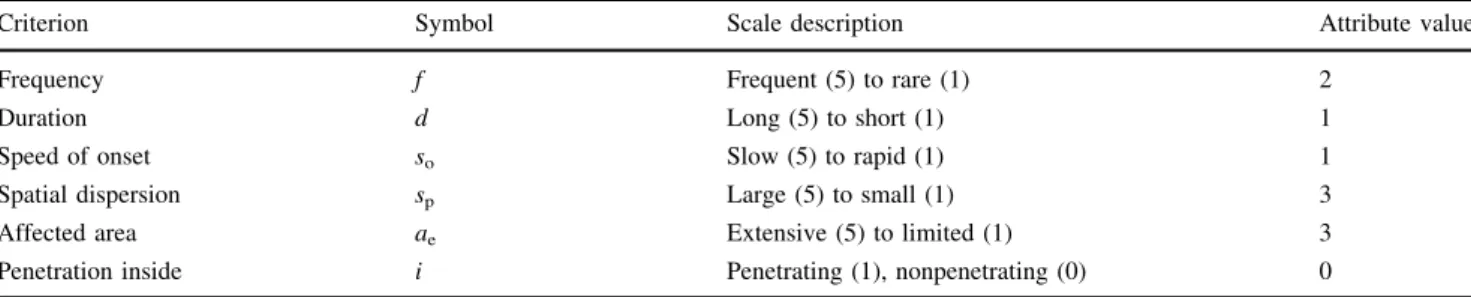
The authors adopted the scale and detail levels of CityGML (2017) that have been widely implemented in the field of 3D modeling. CityGML is an open standard of the Open Geospatial Consortium (OGC) for 3DCM encoding in which five levels of detail are defined, from LoD0 to LoD4 in ascending order of spatial detail and geometric precision of the data. To choose the adequate LoD for this study, we employed the hierarchical decision rule utilized by Kemec et al. (2009) in the scope of disaster manage-ment. This rule decides the level to use based on eight decision-making criteria to which values on a scale are assigned, according to the characteristics of the study area and the hazard to be addressed. The criteria are grouped in an Analytic Hierarchy Process (AHP) decision tree: two elements of a spatial nature of the area under study (ex-tension of urban area; population density), two aspects of the spatial nature of the hazardous event (spatial disper-sion; affected area), three characteristics of the temporal nature of the hazard (speed of onset; duration; frequency), and a single criterion that is related to the penetration into a building’s interior space of hazardous material caused by the event under investigation. For example, floods and avalanches invade the interior of buildings with external material; earthquakes, by themselves, according to the referenced authors, do not. The interpretation of the indoor penetration criterion may be questionable, since shock waves produced by earthquakes do invade a building’s interior rupturing walls and leave debris behind. On the other hand, this fact is independent of the existence of windows or doors and of the configuration of interior walls in the 3D model. So we adopted the interpretation of the cited authors, since the consideration of indoor penetration only influences the decision of modeling openings and interiors, which is not important in the present case.
Although the scale to be assigned to the first seven criteria goes from 1 to 5, the eighth criterion is of binary nature, having only values of 0 (nonpenetrating) or 1 (penetrating). The meaning of the values of the scale of 1–5 is different for each of the criteria and is explained in Tables1and2.
The classes for ‘‘extension of urban area’’ (aue) and
‘‘population density’’ (p) were defined according to a study on urban regions based on the 2001 census data for Por-tugal from the Instituto Nacional de Estatı´stica (INE 2004)—National Statistics Institute. Although no similar study was available for the 2011 census, we assumed that eventual evolution occurred in the urban centers on what concerns area and population would not be much reflected in the coarse classification needed for this work. The area and population density of urban centers were classified in geometric intervals. Lisbon presents an area of 8500 ha and a population density of 66.43 persons/ha, so the respective values for attribute aue is 4 and for attribute p is 1. The
values assigned to each criterion describing the hazard under study for the present case—Lisbon and seismic hazard—can be seen in Table2.
The decision rule requires the calculation of the inten-sity valueIvby Eq.1. This was first applied to the attribute
values shown in Table2, and then normalized by Eq.2 to obtainIvnorm. Equation3calculates results for the value of
D, which defines the LoD (D) to be applied in our study’s 3DCM. Except for population density, the attributes scale of each criterion is defined incrementally according to the degree of predominance. The logic behind this definition is that higher Iv values indicate a pervasive situation that
requires little spatial detail, while lower Ivvalues indicate
one intense situation that requires models with more spatial detail (Kemec et al.2009). The orientation of the scale for population density, with lower values for higher densities leading to lower values ofIvin this case, indicates a need
for more model detail in densely populated areas.
Iv¼
s0þdþf
3
þ
sdþae
2
2
aueþp
2
ð1Þ
Ivnorm ¼round
Iv Ivmax
Ivmin Ivmax
4 ð2Þ
D¼Ivnormþi=2 ð3Þ
The values obtained in the present case areIv=7.083, Ivnorm =1, resulting inD=1. That means, for the study of
the seismic vulnerability of the buildings for the whole city
Table 1 Classes and scale for criteriaaueandp
Urban extension (ha) aue Population density (pers/ha) p
of Lisbon, a 3DCM with LoD1 would be appropriate. For a smaller area, for example, limited to a parish of medium size, the attribute for the criterion aue would be 1 and,
keeping the values for all other attributes, the resulting D value would be equal to 3, meaning that much more detail is required. In LoD1, buildings are represented only by geometric blocks (prisms) with the corresponding height, but no other details. Whereas in LoD3 roofs are already modeled with their actual shape, the openings in facades (windows, balconies) are also shaped, as well as all associated facilities such as outdoor stairways, elevator accessories on the roof, and so on. As recommended by the decision rule, LoD1 was used in this study for the whole city, although with some improvements, and, for the pilot areas, the representation was consistent with LoD2 with some models in LoD3/4.
3 Methodology
In this section the workflow of the study is presented as well as the sources for input data. Further, the used method for calculating the vulnerability index for each building and the respective damage degree in several seismic scenarios is presented. Finally, the 3D modeling of the buildings with several appearances and the constraints and advantages of web publishing are addressed.
3.1 Workflow
Figure1shows the implemented workflow. Input data for each study unit, the residential building, were gathered in a shapefile (ESRI2017) linked to the respective 2D footprint in ArcGIS/ArcMap (ESRI2017). New fields of the attri-bute table were calculated as simple functions of the input attributes or retrieved from ArcMap functions, such as building height or terrain slope. Matlab scripts were developed for the calculation of all the additional fields corresponding to parameters of vulnerability. Results were directly saved in the shapefile yielding a global
vulnerability file with all attributes of the buildings, from which an extract was taken to calculate the damage degree according to several seismic scenarios. This operation was also performed through a Matlab script. The shapefiles with the damage degrees for each building footprint in each scenario were entered in CityEngine (ESRI2017) in order to generate the 3D city model. The 3D scenarios produced were first organized and then published on the Web or placed on a server to be exploited by target audience.
3.2 Input Data
Data for this study had several origins. From the building database of the municipality of Lisbon from 2009 acquired for a previous project from the Caˆmara Municipal de Lis-boa (CML)2 we obtained the 2D buildings’ footprints, addresses, and the number of floors above ground for each
Table 2 Values assigned to decision criteria dependent on Lisbon earthquake hazard
Criterion Symbol Scale description Attribute value
Frequency f Frequent (5) to rare (1) 2
Duration d Long (5) to short (1) 1
Speed of onset so Slow (5) to rapid (1) 1
Spatial dispersion sp Large (5) to small (1) 3
Affected area ae Extensive (5) to limited (1) 3
Penetration inside i Penetrating (1), nonpenetrating (0) 0
MatLab Shapefile with
input data fields
ArcMap
Calculated fields
MatLab
Vulnerability fields
Global shapefile Global shapefile
extract ArcMap
Shapefile with damage degree
for seismic scenarios CityEngine
3D city model for vulnerability
analysis
Web scenes
CityEngine WebViewer
Fig. 1 Workflow for the 3D city modeling
building. To characterize the buildings by construction type and construction epoch, geolocated data from the Por-tuguese 2011 census were acquired from the Instituto Nacional de Estatı´stica (INE2011). Aerial photographs of Lisbon from several epochs (1947, 1978, and 2004) were analyzed to confirm, by photo interpretation, the classifi-cation from the census regarding the construction epoch of individual buildings. Photographs from 1947 were flown by the British Royal Air Force (RAF) and belong to sets acquired from Centro de Informac¸a˜o Geoespacial do Exe´rcito (CIGeoE)3for previous projects. The aerial pho-tographs from 1978 were flown by the Forc¸a Ae´rea Por-tuguesa (FAP) and the ones from 2004 were flown by ERFOTO. They are also part of sets acquired for previous projects from the Direc¸a˜o Geral do Territo´rio (DGT).4 Landform data were obtained from a 5 m grid Digital Terrain Model (DTM) created from the contours of the 1:25,000 military topographic map from CIGeoE. Terrain geology classification was based on Almeida (1986). Geolocated information about abandoned buildings in the city of Lisbon originating from Santos et al. (2015) was also added. From Dias (2013), a 2.5D landfill map of Lisbon was attached to the input dataset. This data source identifies landfills created between 1944 and 2006. For the pilot areas, attributes such as roof type and relative position in the neighborhood came from aerial image interactive analysis. Facade textures were also included; these data were photographically obtained in field work.
3.3 Building Vulnerability Indices
For each building, seismic vulnerability was calculated following methodology LM1 of the RISK-UE project (Milutinovic and Trendafiloski2003) that considers a total vulnerability index, VI, calculated by Eq.4. In order to
assign the most probable vulnerability index (VI *
) to a certain building, the pair type of construction/epoch of construction was used. This procedure took into consider-ation the classificconsider-ation assigned by Sousa (2006) for the building stock in Lisbon adapting the classes to those of RISK-UE. In addition, the regional vulnerability factor for Lisbon (DVR) was assumed to be 0.08 (Teves-Costa et al.
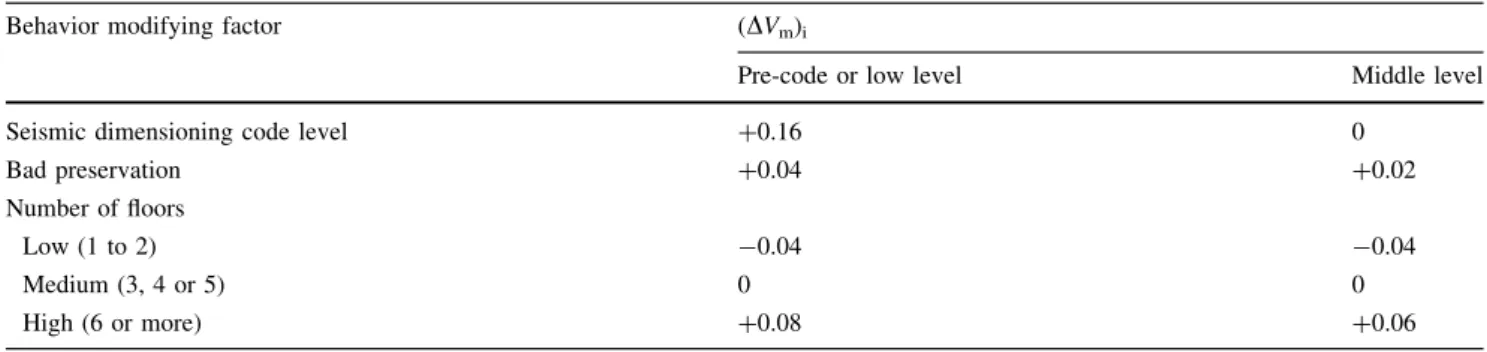
2011) and several behavior-modifying factors for each building (DVm)were considered according to the available
data, which are described in Tables3and4. The building
typology classification used in the present study is shown in Table5.
VI ¼VIþDVRþDVm ð4Þ
Additionally, as a new parameter, the consistency of the soil under the buildings was considered. Taking into con-sideration the existence of several landfills in Lisbon (Dias 2013), numerical simulations were performed to compute the transfer functions of these deposits (Teves-Costa et al. 2012, 2014) in order to estimate their potential effect on building seismic response (Bakir et al.2002; Navarro et al. 2012). From the computations it was observed that the effects of these superficial deposits are only significant when the deposits are more than 10 m thick and, due to their natural frequencies, for buildings with more than five floors. RISK-UE methodology proposes factors between
?0.02 and?0.04 to take into account the settlement of the building on less favorable soil conditions (Milutinovic and Trendafiloski 2003). Consequently, a behavior modifying factor of?0.02 was assumed for buildings with more than five floors built on landfills that were more than 10 m thick.
3.4 Damage Degree
In order to simulate damage scenarios for an earthquake, it is necessary to estimate how building stock reacts according to the total vulnerability index assigned to each building, VI, for a certain seismic intensity, I. An
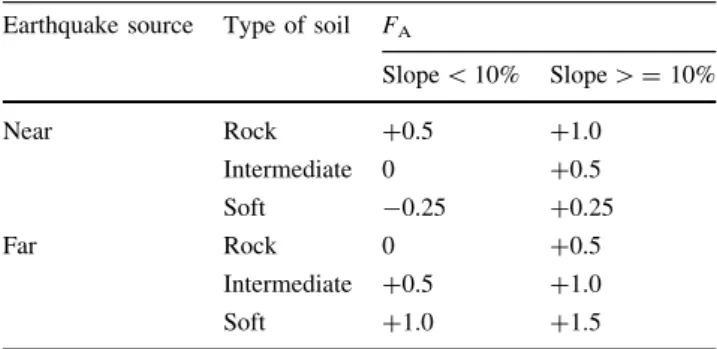
aggra-vation factor, FA, dependent on the location of the
earth-quake source and on the geology/lithology of the soil was also introduced. In this study two types of earthquakes were considered according to the most frequent epicenter locations in the seismic history of Lisbon: (1) the far source, corresponding to earthquakes with an origin at the Gorringe Ridge area in the Atlantic Ocean (about 270 km southeast from Lisbon); and (2) the near source corre-sponding to earthquakes originating in the Lower Tagus Valley fault system (the strongest of which had its epi-center about 40 km from Lisbon). The soils of Lisbon were classified in three types: rock, intermediate, and soft soil. The topography of the city is characterized by a relatively flat central zone, mostly located between 70 and 120 m high, which occupies about 64% of the city’s area. The downtown area, located in the south-southeast, is sur-rounded by several small hills whose altitude can reach 110 m. In addition, the city has a flat waterfront area and a forest area (not urbanized) located at an elevation that reaches 228 m height occupying about 11% of the city’s area (Monsanto Forest Park). A slope map, based on the digital terrain model, shows that only 5% of the total area of the city has slopes higher than 10% (Teves-Costa et al. 2011). Taking into account that the local conditions (soil
type and topography) can modify the characteristics of the seismic ground shaking (Borcherdt1970; Idriss1990), thus affecting the observed macroseismic intensity
(Giammarinaro et al. 2005; Fritsche et al. 2009; Navarro et al. 2009), an aggravating factor was introduced in the mean damage degree equation used in RISK-UE (Miluti-novic and Trendafiloski 2003). This aggravating factor, presented in Table6, varies from-0.25 to?1.5, depend-ing on the earthquake source, takdepend-ing into account the combined effect of the topography and the geology (Teves-Costa et al. 2011). The mean damage degree formula, modified from Milutinovic and Trendafiloski (2003), is presented in Eq.5
lD¼2:5 1þtanh
Iþ6:25VI 13:1þFA
2:3
ð5Þ
The values for the resulting mean damage degree have been rounded in order to agree with the classification presented by Gru¨nthal (1998) in theEuropean macroseis-mic scale(EMS98), which describes 5 damage degrees for buildings ranging from 1 (light damage) to 5 (total col-lapse). This macroseismic scale was chosen due to the fact
Table 3 Behavior modifying factors for masonry buildings.Source: Milutinovic and Trendafiloski (2003)
Behavior modifying factor Parameters (DVm)i
Preservation Good -0.04
Bad ?0.04
Number of floors Low (1–2) -0.02 Medium (3, 4, or 5) ?0.02 High (6 or more) ?0.06 Building position in block Middlea -0.04
Corner ?0.04
Headerb ?0.06
aThe building has two adjacent buildings
bThe building has one adjacent building (three free sides)
Table 4 Behavior modifying factors for buildings of reinforced concrete (RC).Source: Milutinovic and Trendafiloski (2003) Behavior modifying factor (DVm)i
Pre-code or low level Middle level
Seismic dimensioning code level ?0.16 0
Bad preservation ?0.04 ?0.02
Number of floors
Low (1 to 2) -0.04 -0.04
Medium (3, 4 or 5) 0 0
High (6 or more) ?0.08 ?0.06
Table 5 Seismic vulnerability according to the pair construction typology/construction epoch
Sousa (2006) European projectRisk-UE
Construction typology Construction epoch Class Designation Seismic vulnerability index (Vi*)
Adobe, Stone A M2 0.840
Other (Metalic) E S1 0.363
Masonry without RC floor Before 1919 B M1.1 0.873
1919–1960 B M1.2 0.740
1961–1980 C M3.4 0.616
1981–2011 D M4 0.451
Masonry with RC floor Before 1919–1980 C M3.4 0.616
1980–2011 D M4 0.451
Reinforced concrete 1919–1960 C RC1 0.442
\8Fl
1961–1980 C RC1 0.442
[8Fl
1961–1980 D RC2 0.386
that its use is recommended by the European seismological commission (ESC)5to evaluate the damages in European earthquakes. Besides, the building classification used in RISK-UE is also based on this scale.
3.5 3D Modeling and Web Publishing
The database containing all the buildings with attributes, the respective vulnerability index, and the damage degree calculated for two different macro seismic intensities (VII and IX) for each earthquake source considered (far and near) was imported into CityEngine 2015.1 (ESRI2017) to proceed with the 3D modeling and analysis of the results. Table7shows an overview of the database fields indicat-ing which values were input and which were calculated. Additional fields could be introduced, for instance, to include the probability that a building would suffer damage of a certain degree or higher as a function of the seismic intensity (fragility of the building). In this case, five addi-tional fields (one for each degree of the scale from 1 to 5) could be calculated for each seismic scenario. Although feasible, fragility was not explored in this study since probability values are not adequate for visual representation.
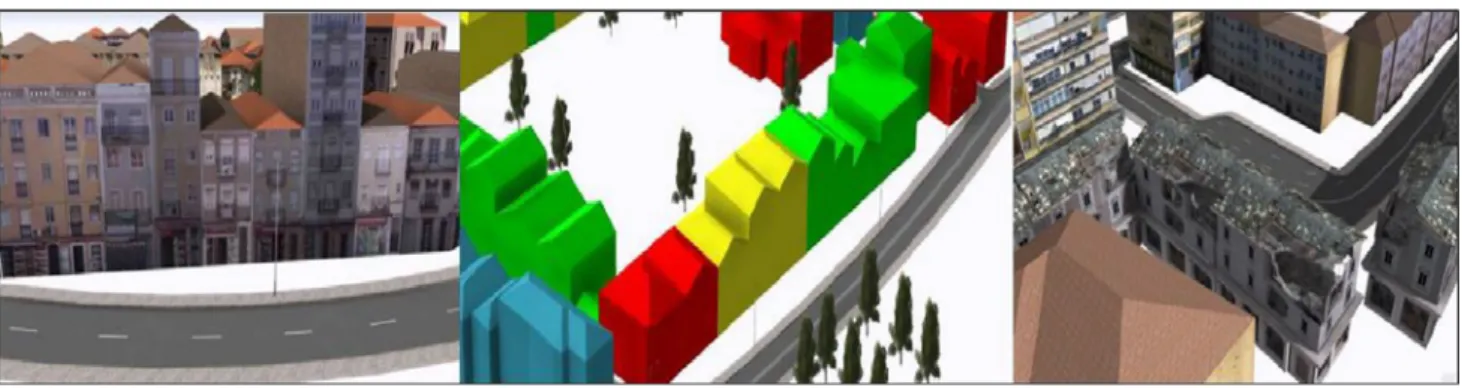
The 3D modeling was done by means of several Com-puter Generated Architecture (CGA) rules. These were implemented to automatically build the 3D geometry of each building from the footprint and respective geometric attributes (building height, roof type), and to provide each building with an appearance, which could vary between actual texture, symbolic colored texture, or damage real-istic texture, according to the type of possible question addressed by the model (Fig.2). In the last two alterna-tives, the color or aspect of the building depends on the respective seismic attributes, such as damage degree or vulnerability index class.
Since the intention of the study was to produce layers that could be exploited through the Web by stakeholders,
the query dynamic is limited to the capacities of the used Web viewers. It was not possible to publish only one 3D scene with several appearances for each object, since appearances are not queryable (not included as attributes in the database). Therefore, several 3D scenes had to be created for each study area in order to answer the most common demands of the target audience. This audience can be grouped in three categories:
1. Experts, elected officials, and planners, who consult the 3D model as analysts, want to know, for instance, how many masonry buildings exist in a certain city district or how old is the building stock. For this kind of questions, a layer with the 3DCM of the district with actual texture appearance is sufficient. This layer contains the attributes of the buildings independent of seismic scenarios. Other questions, such as ‘‘how vulnerable is the neighborhood?’’ or ‘‘how does the urban morphology (directly observable in the 3D model) influence the earthquake scenario?’’ are best answered in color symbolized layers: the first query is dealt with according to vulnerability classes and the second inquiry is answered using the damage degree scale. Experts can also use color symbolized layers to test the sensitivity of damage scenarios to vulnerability parameters.
2. Civil protection agents and those involved in emer-gency response, who will consult the 3D model as a simulation tool for planning actions in advance of a seismic event or immediately after. This group will analyze the damage scenarios with color symbology and, perhaps, compare them with the actual texture model for orientation; and
3. Citizens in the frame of awareness campaigns, who are likely to explore the model looking for an intuitive answer to questions such as ‘‘what will happen to my building or my neighborhood in case of an earth-quake?’’ or ‘‘how high is the vulnerability level on the site where I live?’’ This group tends to look for the ‘‘big picture’’ and is not searching for attributes and it is this general public that is the target for the damage realistic textured layer that is addressed later in this work.
The 3D model with actual texture and the set of damage scenarios is published on the Web and presented as sepa-rate layers for the user to choose. Because of the dimension of the models, the pilot areas are published in ArcGIS online, accessible in a CityEngine Web Viewer with sev-eral possibilities of visualization, navigation, querying, and comparison of layers. This mode also allows some inter-action between the user and the model by means of localized comments. The whole city, on the contrary, is published via a local server through a Portal for the ArcGIS
Table 6 Aggravation factorFAaccording to earthquake origin, soil
type, and slope
Earthquake source Type of soil FA
Slope\10% Slope[=10%
Near Rock ?0.5 ?1.0
Intermediate 0 ?0.5 Soft -0.25 ?0.25
Far Rock 0 ?0.5
Intermediate ?0.5 ?1.0 Soft ?1.0 ?1.5
Server that provides access to a large amount of data, but does not possess the same ability (as the CityEngine Web Viewer) to explore the model and the information layers. Both alternatives can be accessed via the Web through a link shared with the stakeholder, without the need of any software installation.
Queries are introduced in the Web Viewer as attribute searches in the database, for instance, Type_Const: Masonry. As an answer, all the buildings with construction
type Masonry will be highlighted in the 3D viewer and a count of occurrences will be shown (Fig.3). In addition, a list of the buildings matching the search criterion is also shown.
Once the layer is on the 3D viewer, all building attri-butes are accessible by selecting one of the buildings either in the 3D viewer or in the list; the user can analyze the eventual relation between damage degree and construction epoch by highlighting the buildings from a particular epoch
Table 7 Vulnerability database fields
Field name Description of attribute Origin
COD_SIG Code in the database of the municipality of Lisbon Input
BGRI11 Code in INE database Input
ID Building identifier Input
Freguesia Parish Input
Morada Street Input
Nr Polı´cia Number Input
Nr Pisos Number of floors Input
Int Pisos Floor interval Input
Altura Edi Building height Input
Tipo Const Construction type Input
E´ po Const Construction epoch Input
Classe Vul Building vulnerability class based on pair type/epoch of construction Calculated Ind Vuln Building vulnerability index based on pair type/epoch of construction Calculated
Tipo telha Roof type Input
Era Geology of the soil—age Input
Perı´odo Geology of the soil—period Input
E´ poca Geology of the soil—epoch Input
Co´digo Code for soil type identification Input
Categ Solo Soil type Input
Descric¸a˜o Description of soil type Input
F Agrav Af Aggravation factor for far source earthquake Calculated F Agrav Pr Aggravation factor for near source earthquake Calculated
Decl Grau Slope (in degrees) Calculated
Decl Perc Slope (in percentage) Calculated
Aterro Landfill depth Input
Solo Alter Significance of landfill Calculated
Estado Abandoned or inhabited Input
Manutenc¸a˜o Maintenance state Input
Ind Fund Foundation vulnerability index Calculated
F Regional Regional vulnerability factor Input
Ind Pcode Seismic dimensioning code Input
Ind Pisos Floors vulnerability index Calculated
Ind Manut Maintenance vulnerability index Calculated
Ind Pos Position in block vulnerability index Calculated
VI Total vulnerability index Calculated
uNearVII Mean damage degree (near source-intensity VII) Calculated uNearIX Mean damage degree (near source-intensity IX) Calculated uFarVII Mean damage degree (far source-intensity VII) Calculated
in a layer where they are colored according to the damage scale. Although in the studied example only four seismic scenarios were simulated corresponding to four different layers, a number of other scenarios can be produced for other intensities and earthquake sources as long as the respective values for the aggravation factor,FA, are esti-mated and introduced into the scripts.
4 Results
After applying the proposed methodology to the gathered data, a 3D seismic vulnerability model was built for the whole city of Lisbon and for three smaller areas. Some examples of how new knowledge can be retrieved from the built models are presented in this section.
4.1 Estimated Damage for Residential Buildings in Lisbon
At a city scale, because the 3D model is explored by users for acquaintance with the general situation or analysis of vertical morphology distribution, the realism of textures was not considered a priority. Generic facade textures were arbitrarily assigned to the buildings in the layer corre-sponding to the actual situation of the whole city (Fig.4). Due to the extension of the model it had to be processed in another software, ArcGIS Pro, using imported CGA rules that had been programmed in CityEngine. Unfortunately, this software, although able to cope with more data, does not offer the same graphic quality as CityEngine.
Four seismic scenarios were simulated: two near sour-ces—intensity VII and IX and two far soursour-ces—intensity
Fig. 2 Appearance of buildings in 3D model according to query context: actual texture (left); colored symbology (middle); damage realistic texture (right)
Fig. 3 CityEngine web viewer layout example: result of the query ‘‘Type of construction: Masonry—Alvenaria (in Portuguese)’’ for the pilot area Alvalade; (left) highlighted buildings in 3D scene matching
VII and IX. The probable damage degree, according to the total vulnerability index of each of the 52,374 habitation buildings in Lisbon municipality, was computed and rep-resented visually. In the layers corresponding to seismic scenarios, buildings conserved the 3D geometry but were assigned a solid color appearance that matched the respective damage degree. A discrete color scale with 6 steps was adopted, corresponding to the EMS98 damage degrees: blue (degree 1), green (degree 2), yellow (degree
3), red (degree 4), dark red (degree 5—total collapse), and light blue for no damage.
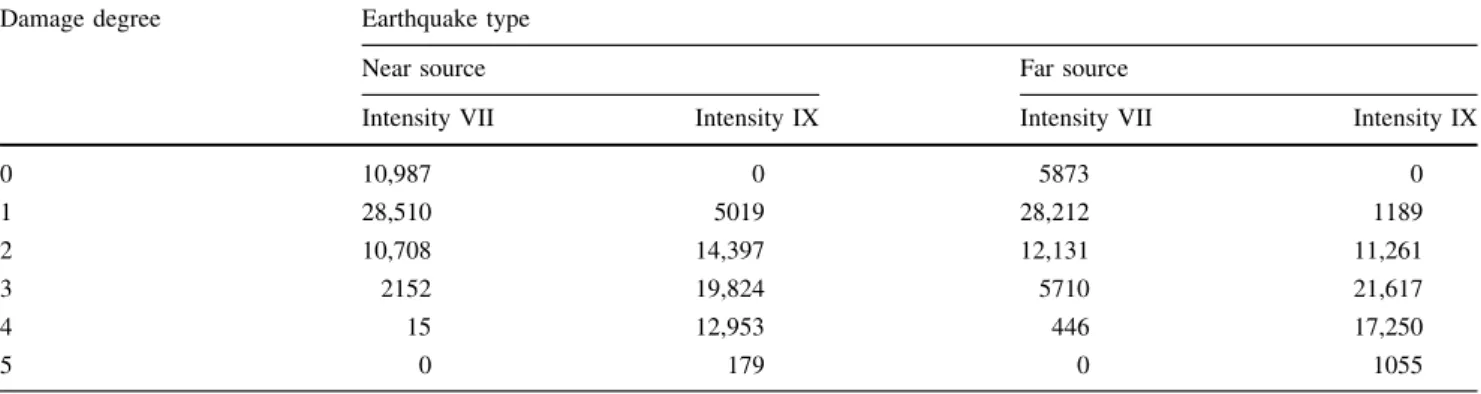
Figure5 shows the resulting spatial distribution of damage for the scenarios considered. A good general panoramic of the areas expected to be more affected can be obtained from these scenarios. Intensity IX from a far source earthquake corresponds to the situation that occur-red in 1755. The model shows that the most affected areas then would also be the most affected now, with a total collapse of most buildings in downtown and a large sur-rounding area experiencing damage degree 4. Table8 shows the number of affected buildings according to damage degree and seismic scenario.
4.2 Deeper Analysis in Pilot Areas
Pilot areas were chosen for detailed modeling and inclusion of additional behavior-modifying factors. The selected areas are representative of city districts in their construc-tion epoch, soil geology, and urban morphology. Due to the 1755 earthquake that devastated the city, there are only a few structures that date from before the eighteenth century.
Fig. 4 3D model of Lisbon with actual situation appearance (generic facade textures)
X
I
y
t
i
s
n
e
t
n
I
I
I
V
y
t
i
s
n
e
t
n
I
Near source
Far source
So the three areas chosen include only residential buildings later than 1755: (1) Ajuda, built mainly during the eigh-teenth century and standing on rock; (2) Grac¸a, constructed in the late eighteenth and early nineteenth centuries and resting on an intermediate soil; and (3) Alvalade, erected from the mid twentieth century and laying on soft soil. The location of the areas in the geological map and an illus-tration of their actual state 3D model layer are shown in Fig.6.
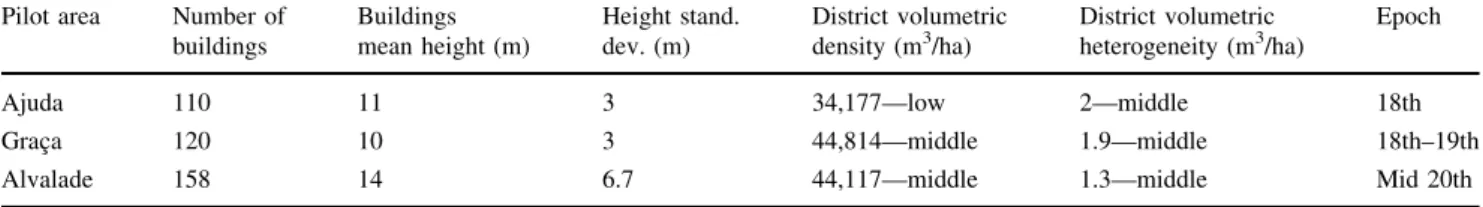
The three areas are characterized in Table9 and, from an urban morphological point of view, they are not dra-matically different. The volumetric density and the
volumetric heterogeneity are indicators of the built mass in a district. Lower density values indicate urban plans where public spaces are significantly present and lower hetero-geneity values reveal more homogeneous buildings in the district area (Santos et al. 2015).
In Fig.7, we show an example of the analysis that can be done with the 3D city model. The figure displays two scenarios with the color symbology for the Ajuda and Grac¸a areas. The color is automatically assigned to each building according to its estimated damage degree. The same seismic intensity produced by two different sources is considered. It is very clear from this representation that,
Table 8 Number of buildings and damage degree for the four seismic scenarios
Damage degree Earthquake type
Near source Far source
Intensity VII Intensity IX Intensity VII Intensity IX
0 10,987 0 5873 0
1 28,510 5019 28,212 1189
2 10,708 14,397 12,131 11,261
3 2152 19,824 5710 21,617
4 15 12,953 446 17,250
5 0 179 0 1055
according to the vulnerability model employed, the two areas react differently to the same type of earthquake. Ajuda suffers more damage (more total collapses) than Grac¸a for a near source, but the situation reverses when the earthquake has origin in a far source.
The reason lies in the amplification effect of the dif-ferent types of soil, which varies according to the source as expressed by the aggravation factor, FA (Table 6). This
indicates clearly that the vulnerability index of the build-ings is not the only conditioner of their damage degree. Higher buildings and those isolated or in a header or corner position in the block are more affected by the earthquake (see Fig.7, near source in Ajuda and far source in Grac¸a). Identifying the most susceptible buildings is easy by comparing, in the Web Viewer, the layers actual state versus seismic scenario (Fig.8). The respective attributes also can be queried, an interesting option, for instance, for a stakeholder who needs to invest in seismic improvement measures or for insurance companies. As an example, comparing the vulnerability attributes of the highlighted building in Fig.8 with those of the left adjacent building, one concludes that the position in block contributed the most to collapse of the highlighted building and non-col-lapse of the left building, since the other attributes
(construction epoch, typology, soil, slope, and so on) are very similar. On the other hand, the corner building in yellow (degree 3), appearing on the right of the seismic scenario, has the same unfavorable position in block. Here are typology (masonry with reinforced concrete floor) and construction epoch (1961–1970) determinant for the esti-mation of a smaller damage degree.
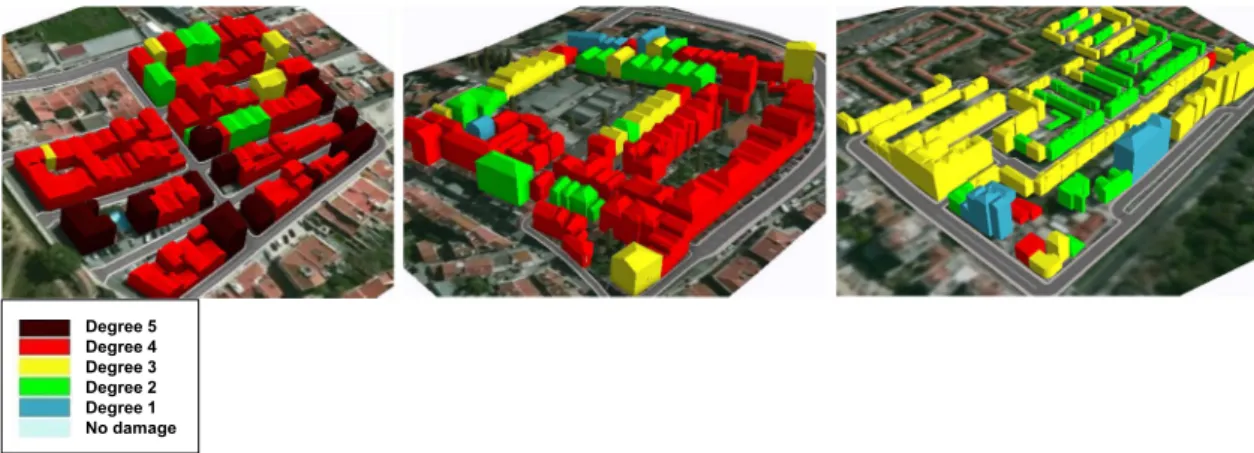
Table10summarizes the results obtained in the seismic simulations for the three pilot areas in terms of percentage of damaged buildings with the indicated damage degree. Bold numbers correspond to the predominant damage degree in the area. Alvalade, the area with more recent structures, seems to behave better than the others, espe-cially in the near source scenarios. The comparison between the 3D models conveys this information very efficiently as demonstrated in Fig.9, where all three areas are juxtaposed visually. It is evident that the situation is significantly less severe in Alvalade than in the other two areas without the need of statistical interpretation.
4.3 The Damage Realistic Models
Color scale symbology is a valuable tool for a prompt interpretation of results. A nonexpert intuitively recognizes
Table 9 Urban morphologic characteristics of the pilot areas
Pilot area Number of buildings
Buildings mean height (m)
Height stand. dev. (m)
District volumetric density (m3/ha)
District volumetric heterogeneity (m3/ha)
Epoch
Ajuda 110 11 3 34,177—low 2—middle 18th
Grac¸a 120 10 3 44,814—middle 1.9—middle 18th–19th
Alvalade 158 14 6.7 44,117—middle 1.3—middle Mid 20th
Intensity IX
Ajuda Graça
Near source
Far source
Degree 5 Degree 4 Degree 3 Degree 2 Degree 1 No damage
increasing danger in red color shades. Nevertheless, the meaning of the indicated damage degree for the structures cannot be transmitted to the user by the color scale alone. Color just indicates the relative severity of damage; it does not describe what really happens to the building. In this study, an effort was made to transmit the real meaning of a certain damage degree in the 3D seismic scenarios simulation.
The meaning of the damage scale is well described in EMS98 (Gru¨nthal 1998) for masonry and for reinforced concrete buildings, including a pictorial description (Fig.10). The scale is meant to be used for damage clas-sification during field surveys after an earthquake. We took advantage of the possibilities of 3D city modeling software to build fictional cities, which has been extensively used in the computer game industry. Particularly important is the
Fig. 8 Identification of a building with potential damage degree 5 (total collapse) in case of a near source earthquake with intensity IX (left). Attribute analysis of the same building (right)
Table 10 Percentage of buildings per damage degree for all seismic scenarios in all pilot areas
Pilot Area Ajuda Grac¸a Alvalade
Type of soil/ground Rock Intermediate Soft
Predominant construction epoch Before 1919 Before 1919 1946–1960
Predominant construction typology Masonry w/o RC floor Masonry w/o RC floor RC
Near (%) Far (%) Near (%) Far (%) Near (%) Far (%)
Macro seismic intensity VII
Damage degree
0 0 0 0 0 6 0
1 12 12 34 22 93 37
2 52 75 54 50 1 58
3 36 13 12 28 0 5
4 0 0 0 0 0 0
5 0 0 0 0 0 0
Macro seismic intensity IX
Damage degree
0 0 0 0 0 0 0
1 0 6 4 0 5 0
2 7 5 17 6 34 3
3 5 2 13 15 58 27
4 75 85 66 67 3 70
5 13 2 0 12 0 0
work of Christian Holzer, who developed procedural models of buildings with interactively or randomly changing damage in order to set up a war game scenario (ESRI2017). We developed damaged building models that adapted to the footprint dimensions and attributes height and number of floors simultaneously. The damage degree associated to the footprint defines the kind of model to apply in a particular scenario.
For this experiment, only models for damage degree 3 and 4 were developed. These models follow distinct con-cepts for showing damage: (1) changing the building appearance for degree 3; and (2) changing the building geometry for degree 4. Models for degree 1 and 2 can be obtained on the same way as for degree 3: a model that maintains the original building geometry, including the roof, is assigned a texture showing the typical damages for each degree (cracks on the facade, broken windows, holes in the roof, and so on). We decided to divide building facades into the respective number of floors, and to apply a certain texture to the ground floor and repeat a second texture for each of the upper floors. Since the damage models are used as symbols that apply to all footprints with the damage degree in question, the textures originate from photographs of one or two typical buildings in the district that are edited in image processing software to include the damages (Fig.11left). Priority was placed on the appear-ance of the damage for each degree as described in EMS98, not on the resemblance with the actual facade. Neverthe-less, for damage degrees up to 3, it would be possible to associate each footprint in the model database with a set of damaged facade textures created from its actual facade. But without an automated routine, this procedure would be very time and memory consuming when dealing with a large area.
The procedural model for damage degree 4 follows a completely different approach and resorts to 3D models of
structural elements (slab, beam, window, door, intact wall, damaged wall, and so on) that are inserted in the building 3D model as implicit geometry objects. The developed procedure is adapted from Holzer’s code, available as an example inside CityEngine 2015.1 (ESRI 2017) work-space. The adaption consisted in choosing the relevant elements for a seismic scenario, since the original related to a war game scenario. Adaptations included use of reason-able textures for the walls, which were taken from a typical building in the study area, and directing the procedure to pick the attributes of the actual footprint (dimensions, height, roof type, and number of floors). In general, the adapted Holzer’s CGA rule works as follows: each foot-print with damage degree 4 is first extruded by the original height and divided in floors, according to the original attribute ‘‘number of floors.’’ This division is made at solid model level, not only at facade surface level. Then the walls in each floor are built alternating damaged with nondamaged parts originating from the structural elements 3D models. Also the interior of each floor gets a floor texture, and damaged or nondamaged 3D beams are included. Damage is offset in the front facade from floor to floor in order to create the impression of damage continuity between floors (Fig.11 right). The proof of concept was successful and the developed procedure creates automati-cally a damaged 3D city landscape according to calculated parameters for the footprints. We were guided by the damage degree pictures in Fig.10originating from EMS98 (Gru¨nthal 1998). The procedure can be adapted to other seismic damage, for instance typical damage usually observed in soft floors. A rule deciding which of these models (appearance or geometry change) to use according to the damage degree associated to the footprint was applied in order to generate a damage realistic layer (Fig.12).
Degree 5 Degree 4 Degree 3 Degree 2 Degree 1 No damage
Since these models must contain interior spaces (floors, some interior walls, beams), the respective layer is much heavier than the layers containing only color symbology or facades. Nevertheless, a representation like this can be very useful in supporting seismic risk prevention awareness campaigns on TV and in the internet. Common citizens who never experienced an earthquake are more likely to
react to 3D scenes of their simulated damaged neighbor-hood and be ready for taking preventive measures, than to colored maps with scientific results or pictures of earth-quake damage occurred elsewhere. Also local authorities can be moved by these simulations to invest, for instance, in retrofitting measures in the most vulnerable buildings of their jurisdiction.
Damage
Degree
Description of Damages (examples)
e
t
e
r
c
n
o
C
d
e
c
r
o
f
n
i
e
R
y
r
n
o
s
a
M
0
Absence of damage1
Hair-line cracks in very few walls.Fall of small pieces of plaster only.
Fall of loose stones from upper parts of
buildings in very few cases.
Fine cracks in plaster over frame members or in walls at the base. Fine cracks in partitions and infills.
2
Cracks in many walls. Fall of fairly large pieces of plaster. Partial collapse of chimneys.Cracks in columns and beams of frames and in structural walls. Cracks in partition and infill walls; fall of brittle cladding and plaster. Falling mortar from the joints of wall panels.
3
Large and extensive cracks in most walls. Roof tiles detach. Chimneys fracture at the roof line; failure of individual nonstructural elements (partitions, gable walls).Cracks in columns and beam columns, joints of frames at the base and at joints of coupled walls. Chipping of concrete cover, buckling of reinforced rods. Large cracks in partition and infill walls, failure of individual infill panels.
4
Serious failure of walls; partial structuralfailure of roofs and floors.
Large cracks in structural elements with compression, failure of concrete and fracture of rebars; bond failure of beam reinforced bars; tilting of columns. Collapse of a few columns or of a single upper floor.
5
Total or near total collapse.Collapse of ground floor or parts (e.g. wings) of buildings.
5 Conclusion
Studies on the seismic vulnerability of city buildings can profit from the use of 3DCM especially when city data-bases are detailed to the scale of a building. LoD1 is suf-ficient for modeling extended areas, as in the case of the whole municipality of Lisbon, but LoD2 gives the build-ings more recognition value, which can be an advantage in emergency decision making. LoD2 was used in this study for three pilot areas. The whole methodology could be applied to other cities if the regional vulnerability factor and the aggravation factor are defined.
3D scenarios organized as shown in this work, with an actual state layer that contains geometric models of the buildings with actual facades, and several layers that show the result of seismic simulations, can be easily published on the Web or through a local server. These models can be shared through a Web link with stakeholders for further analysis without the need for software installation.
ArcGIS 10.3 and CityEngine 2015.1 together with the CityEngine Web Viewer have fulfilled all requirements for a study of this nature as long as the area dimensions and the complexity of the models stay limited. For the whole municipality, the solution required us to program CGA
rules in CityEngine, to import those rules in ArcGIS Pro in order to generate the 3D scenarios, and later to export the layers to a local server managed through Portal for ArcGIS. Open source alternatives were not tested.
Attributes of each object are accessible in every layer and include building attributes (address, number of floors, roof type, construction epoch, construction type, and so on), soil attributes (geology, lithology, landfill depth, among others), and vulnerability modifying factors (maintenance state, position in block, and so on). The total vulnerability index of each object is accessible. Simple queries can be made to all the attributes existing in the database, which is relevant for stakeholders who are interested in analyzing the seismic behavior patterns of buildings.
The visual analysis of seismic simulation results is very simplified through the maintenance of building geometry and the application of color symbology to the objects, which uses the estimated damage degree in the EMS98 scale as proposed in this work. The relation between seis-mic scenario and real objects is easily obtained through comparison in the Web viewer between the scenario and the actual state layer. This operation (swipe view) is a standard in the CityEngine Web Viewer.
Fig. 11 Models textured according to damage degrees 3 (left) and 4 (right)
Since calculations for some fields in the database are performed by means of external scripts, simulations in the model to test its sensitivity to the parameters can be easily done. Each change in the vulnerability parameters and/or aggravation factors will influence the outcome of the damage scenario. When applied to urban regions where recent earthquakes have occurred and for which damages are photo documented, our method can be used as a tool for calibrating the vulnerability model by comparing the sim-ulated damage degree with the damage that actually occurred.
Finally, damage realistic 3D scenarios, originally designed for fictional game environments and adapted here for eventual reality, are striking tools that transform the text and visual description of the EMS98 damage scale into a believable 3D damage scene. This technique may be relevant in awareness campaigns at several levels, includ-ing use to impress ordinary citizens, local authorities, and national politicians with the importance of preparation for potential future emergencies.
Acknowledgements This work was partially supported by the Pro-ject FCT UID/GEO/50019/2013—Instituto Dom Luiz.
Open Access This article is distributed under the terms of the Creative Commons Attribution 4.0 International License (http://crea tivecommons.org/licenses/by/4.0/), which permits unrestricted use, distribution, and reproduction in any medium, provided you give appropriate credit to the original author(s) and the source, provide a link to the Creative Commons license, and indicate if changes were made.
References
Almeida, F.M. 1986. Geological map of Lisbon Council 1:10,000, Servic¸os Geolo´gicos de Portugal, Lisbon (in Portuguese). ArcGIS. 2017. Web site.http://doc.arcgis.com/en/arcgis-online/refer
ence/about-cityengine-web-viewer.htm. Accessed 7 Sept 2017. Bakir, S., H. Sukuoglu, and T. Yilmaz. 2002. An overview of local
site effects and the associated building damage in Adapazari during the 17 August 1999 Izmit earthquake. Bulletin of the Seismological Society of America92(1): 509–526.
Borcherdt, R. 1970. Effects of local geology on ground motion near San Francisco Bay. Bulletin of the Seismological Society of America60(1): 29–61.
CityGML. 2017. Web site.http://www.opengeospatial.org/standards/ citygml. Accessed 7 Sept 2017.
Dias, P. 2013. Elaboration of a Lisbon landfill map using LiDAR and aerial photogrammetry. (Elaborac¸a˜o de uma carta de aterros da cidade de Lisboa por LiDAR e Fotogrametria ae´rea). MSc. thesis. Faculdade de Cieˆncias, Universidade de Lisboa, Lisbon, Portugal. http://repositorio.ul.pt/bitstream/10451/9878/1/ ulfc105777_tm_Pedro_Dias.pdf. Accessed 7 Sept 2017 (in Por-tuguese with English abstract).
ESRI (Environmental Systems Research Institute). 2017. Web site.
http://www.esri.com/products. Accessed 7 Sept 2017.
Fritsche, S., D. Fah, B. Steiner, and D. Giardini. 2009. Damage field and site effects: Multidisciplinary studies of the 1964 earthquake series in Central Switzerland.Natural Hazards48(2): 203–227.
Giammarinaro, S., A. Tertulliani, G. Galli, and M. Leta. 2005. Investigation of surface geology and intensity variability in the Palermo, Italy, urban area after the 6 September 2002 earth-quake.Bulletin of the Seismological Society of America95(6): 2318–2327.
Gru¨nthal, G. 1998. European macroseismic scale 1998.Luxembourg: Centre Europe´en de Ge´odynamique et de Se´ismologie. http:// www.franceseisme.fr/EMS98_Original_english.pdf. Accessed 7 Sept 2017.
Idriss, I.M. 1990. Influence of local site conditions on earthquake ground motions. In Proceedings of the 4th US National Conference on Earthquake Engineering, 20–24 May, Palm Springs, California, U.S.A., 55–57.
INE (Instituto Nacional de Estatı´stica / National Statistics Institute). 2004. Urban system: Areas of influence and functional marginality: Central region (Sistema urbano: a´reas de influeˆncia e marginalidade funcional: regia˜o Centro). Lisbon: Instituto Nacional de Estatı´stica. http://www.ine.pt/xportal/xmain?xpid= INE&xpgid=ine_publicacoes&PUBLICACOESpub_boui= 11355196&PUBLICACOEStema=55481&PUBLICACOES modo=2. Accessed 12 Sept 2017 (in Portuguese).
INE (Instituto Nacional de Estatı´stica / National Statistics Institute). 2011. Census 2011.http://mapas.ine.pt/map.phtml. Accessed 7 Sept 2017.
Kemec, S., S. Zlatanova, and S. Duzgun. 2009. Selecting 3d urban visualisation models for disaster management: A rule-based approach. In Proceedings of the International Emergency Management Society Annual Conference, 9–11 June, Istanbul, Turkey,99–110.
Kemec, S., S. Zlatanova, and S. Duzgun. 2010. A framework for defining a 3D model in support of risk management. In Geographic information and cartography for risk and crisis management, ed. M. Konecny, S. Zlatanova, and T. Bandrova, 69–82. New York: Springer.
Milutinovic, Z., and G. Trendafiloski. 2003. WP04: Vulnerability of current buildings. RISK-UE Project of the EC: An advanced Approach to Earthquake Risk Scenarios with Applications to Different European Towns. EVK4-CT-2000-00014. https:// www.dropbox.com/s/nu7rvvt7t7ii1lv/Milutinovic%26Trendafi loski2003_RISK-UE_WP4.pdf?dl=0. Accessed 7 Sept 2017. Navarro, M., A. Garcı´a-Jerez, F.J. Alcala´, F. Vidal, C. Aranda, and T.
Enomoto. 2012. Analysis of site effects, building response and damage distribution observed due the 2011 Lorca, Spain, earthquake. InProceedings of the 15th World Conference on Earthquake Engineering, 24–28 September, Lisbon, Portugal. Navarro, M., F. Vidal, T. Enomoto, F. Alcala, A. Garcı´a- Jerez, N.
Abeki, and F. Luzo´n. 2009. Correlation between site effects and damage distribution observed during moderate earthquakes in SE Spain. In Proceedings of the 8th International Workshop on Seismic Microzoning and Risk Reduction, 15–18 March, Alme-ria, Spain, University of Almerı´a.http://www.ual.es/Congresos/ 8IWSMRR. Accessed 12 Sept 2017.
Poljansek, K., F. Bono, and E. Gutie´rrez. 2010. GIS-based method to assess seismic vulnerability of interconnected infrastructure—A case of EU gas and electricity networks. JRC Scientific and Technical Reports, European Commission. EUR 24275 EN— 2010.
Rashed, T., and J. Weeks. 2003. Assessing vulnerability to earthquake hazards through spatial multicriteria analysis of urban areas. International Journal of Geographical Information Science 17(6): 547–576.
Santos, T., A.M. Rodrigues, and F. Ramalhete. 2015. Assessing patterns of urban transmutation through 3D geographical mod-elling and using historical micro-datasets. In Computational Science and Its Applications—ICCSA 2015, ed. O. Gervasi, B. Murgante, S. Misra, M.L. Gavrilova, A.M.A.C. Rocha, C.M. Torre, D. Taniar, and B.O. Apduhan, Part I, 32–44. Cham: Springer.
Sousa, M. 2006. Seismic risk in continental Portugal (Risco Sı´smico em Portugal Continental). Ph.D. thesis. Instituto Superior Te´cnico, Universidade de Lisboa, Lisbon, Portugal (in Por-tuguese with English Abstract).
Teves-Costa, P., and E. Barreira. 2012. Damage scenarios in Lisbon using RISK-UE approach. In Proceedings of the 15th World Conference on Earthquake Engineering, 24–28 September, Lisbon, Portugal.
Teves-Costa, P., I.M. Almeida, and I.N. Rodrigues. 2012. Distribution of peak and spectral frequencies in Lisbon. Application of
geological and geotechnical data. InProceedings of the 15th World Conference on Earthquake Engineering, 24–28 Septem-ber, Lisbon, Portugal.
Teves-Costa, P., I.M. Almeida, I. Rodrigues, R. Matildes, and C. Pinto. 2014. Geotechnical characterization and seismic response of shallow geological formations in downtown Lisbon.Annals of Geophysics57(4): S0436.
Teves-Costa, P., E. Barreira, and R. Omira. 2011. Synthesis map of seismic risk (Mapa sı´ntese de risco sı´smico). Deliverable IE23. Project ‘‘Evaluation of natural and technological risks in the city of Lisbon’’ (Avaliac¸a˜o de riscos naturais e tecnolo´gicos na cidade de Lisboa), Fundac¸a˜o da Faculdade de Cieˆncias da Universidade de Lisboa (in Portuguese).