A Work Project, presented as part of the requirements for the Award of a Masters Degree in Economics from the NOVA – School of Business and Economics.
SOCIAL TARIFFS FOR WATER AND WASTE SERVICES IN
MAINLAND PORTUGAL:
AN IMPACT ANALYSIS
Inês Maria Valadas Gonçalves #500
A Project carried out on the ERSAR Field Lab, under the supervision of: Professor Susana Peralta
2
ABSTRACT
This paper proposes to quantify the effect of social tariffs (ST) in the Portuguese water and waste sector (WWS). It calculates the amount of subsidy implicit in ST schemes, characterising the existing tariffs in 2011 and producing a synthetic tariff scene where
the regulator’s recommendation is respected. This is the first time such an exercise is
undertaken and it is very relevant in a context of deep economic crisis. Results suggest that there are fewer beneficiaries than what income eligibility criteria would imply and
that putting the regulator’s recommendation in practice would considerably raise
subsidy amounts, potentially leading to a severe increase in non-subsidised user tariffs to allow for break-even.
Keywords: Social Tariffs; Water and Waste Services; Tariff Guidelines; Tariff Structure.
1. INTRODUCTION
The issue of economic affordability and access to water and waste services (WWS) has been widely explored in economic literature.1 Nevertheless, few studies have been conducted that aim at quantifying the impact of the subsidisation mechanisms in place. In Portugal, some preliminary studies have been performed, but a comprehensive review is still lacking.2 As the country undergoes a severe economic crisis that is forcing families into increasing budgetary constraints, this matter is highly relevant. In 2009 and 2010, the Portuguese Water and Waste Services Regulation Authority (ERSAR) issued two recommendations focusing on the design of WWS tariffs, Recommendation no. 1/2009 (R1/09) and Recommendation no. 2/2010.3 These documents intended to constitute a benchmark for defining tariffs and contribute to
1 See Section 4. and References for a detailed list of sources.
2 In 2009, ERSAR gathered information regarding the existence of social tariffs in Portuguese municipalities. The data were used to assess the implications of applying ERSAR’s tariff guidelines on
3
harmonise pricing schemes, attaining reasonable, clear and affordable prices. However, they are “soft law” mechanisms and do not have the required binding power to ensure
compliance. As such, even with an incresing adherence to what is advocated in those recommendations, there continues to exist a considerable degree of heterogeneity among municipalities. This diversity raises several obstacles. It misleads end-users, does not reflect in many cases the true cost of providing the service, be it because it is too expensive or too cheap, and creates situations of unaffordable prices, as well as situations of lack of cost recovery by the operators. Moreover, despite ERSAR’s effort to disseminate easily interpretable and readily available information, clients are constrained in their ability to understand this inter-municipal variability.
This project addresses social tariffs (ST) and assesses their impact on operators’
revenues. The reference year is 2011 and the municipality is the relevant unit of analysis. All the 278 municipalities of mainland Portugal are covered, of which approximately 50% administer ST.
On the one hand, a comparison between the no-social-tariff scenario and the ST that are currently offered is presented. On the other, the ST that would be applied if all operators followed R1/09 are compared against the setting without ST. These exercises are then used to infer the amount of cross-subsidisation that ensures operators are neutral to the application of ST. Hence, the paper is an important tool for policy-makers, regulators, operators and clients, so that future amendments to legislation can be developed more consistently within the Portuguese reality.
4
The rest of the paper is organised as follows: Section 2 briefly describes the Portuguese WWS sector, introducing the regulation authority and its role; Section 3 defines ST, presents and discusses R1/09, and bounds the scope of the study; Section 4 makes a short literature review and summarises the key implications; Section 5 is devoted to data collection, shortcomings and strategies used to surmount them; Section 6 lays down the methodology followed to perform the abovementioned comparisons; Section 7 presents the empirical results for water provision and highlights the main findings; and finally, Section 8 concludes, drawing upon the most relevant policy implications. Additionally, this project features a separate Appendix volume, where data, auxiliary computations, methodological aspects and results are discussed in greater depth.
2. WATER AND WASTE SERVICES IN PORTUGAL
2.1. The Sector
The Portuguese WWS sector is very heterogeneous, with its 357 economically regulated providers following different management models, operating on diverse geographic scales and employing differing quantity and quality levels of both human and physical resources.4 This diversity has contributed to hamper the enforcement of a single modus operandum, delaying the achievement of the sector’s policy goals and ultimately conceding WWS providers a considerable degree of discretion, namely in tariff setting. Table 1 summarizes the different tariff structures applied in Portuguese municipalities. Even when tariff structures coincide, it is virtually impossible to find two identical price lists, leading ERSAR to conclude that the tariff dispersion in Portugal is worrying (see Table 2). Moreover, in some municipalities WWS are not charged, which compromises
5
the sustainability of their provision.5
Table 1 Water tariff structures (% municipalities)
Charging Structure
Fixed charge only 0.6%
Variable charge only 10.7%
Fixed + variable charge 88.6%
Volumetric componenti
Increasing Block Tariff 84.1%
Full Progressive Tariff 14.9%
Number of blocks
≤3 10.9%
4 29.0%
5 38.9%
≥5 21.1%
Source: Martins et al. (2012)
i An increasing block tariff is a multi-part tariff where the volumetric component changes in steps as consumption increases. By contrast, in a full progressive tariff the price of the last block is applied to the total consumption volume.
Table 2 WWS monthly charges for an average Portuguese household consuming 10m3 of water/month
WWS Water Provision Wastewater Treatment Undifferentiated Waste Management
Average 19.11€ 9.80€ 5.69€ 3.62€
Max 40.52€ 20.38€ 20.10€ 12.75€
Min 2.53€ 1.50€ 0.00€ 0.00€
Diff (Max-Min) 37.99€ 18.88€ 20.10€ 12.75€
Source: ERSAR (2012)
In 1993, the sector was divided into two components: bulk and retail service, corresponding to the separation between gross (i.e., multi-municipal) and retail provision activities, the former being transfered to the central Government.6
WWS present important distinguishing features, highlighted in the next subsections.
2.1.1. Water
The water sector comprises two complementary activities: water provision and wastewater collection and treatment. It is a typical network industry, where the natural monopoly is the dominant market structure. Nevertheless, water is different from the remaining utilities such as electricity, gas or telecommunications, given (i) the regional
5 In 2011, 17 operators did not charge wastewater treatment, waste collection was not billed by another 15 and 6 municipalities failed to cash in any of these services. See ERSAR (2012).
6
scale of the monopoly, resulting in a large number of providers (ii) high transportation costs, (iii) service fragmentation and (iv) lack of an integrated provision system.
Water is a necessity with very low substitutability with other goods, leading to fairly low income and price demand elasticities.7 Tellingly, water services are recognised as a human right and play a crucial role in all sectors of economic activity.8
As regards retail services, municipalities are responsible for choosing the management model that best suits local needs, according to the subsidiarity principle.9 Broadly speaking, there are three management models: direct management, indirect management through municipalised services and delegation to private entities in the form of concessions. Despite the growth of private players in the sector, direct management continues to be the most widespread form of organisation.10
Whatever the type of management chosen, water services must fulfil public service obligations. These include universal access (UA), affordability, equity, quality of service and transparency, which can sometimes be conflicting, but are necessary to
ensure the protection of clients’ rights.11 UA is especially important for the present
analysis, as it implies that certain groups of users must be put on exception conditions. ST are one of the mechanisms used to achieve this purpose, as they imply redistribution towards low-income individuals.
2.1.2. Waste
The waste sector does not constitute a network industry. Thus, there is no typical
7 For estimates based on Portuguese data, see Martins & Fortunato (2005) and Monteiro (2010).
8 On the 28th July 2010, the United Nations General Assembly approved Resolution 64/292 recognizing the right to safe and clean drinking water and sanitation as a human right.
9 The subsidiarity principle states that decisions should be taken at the lowest practical level. Specifically, it implies that central government should rely on local authorities to perform local tasks and intervene only when these are not capable of effectively handling local issues. Definition following Article 5 of the Treaty of the European Union. See http://europa.eu/legislation_summaries/glossary/subsidiarity_en.htm. 10 See Tables 1A and 1B in Appendix 1.
7
monopoly case, although the economies of scale due to high initial investment costs and the operation of treatment plants favour a non-competitive market environment for efficiency reasons. At the retail level, the sector comprises waste collection and transportation and is mainly directly secured by municipalities.12
Waste services demand is relatively more price-sensitive than water, but still displays considerable rigidity, which decreases with the availability of recycling opportunities.13 The sector has been growing in importance, as waste production is inherent to all economic activity and is intrinsically connected to the population’s quality of life.14 Tariffs, similarly to what happens for water, present a wide regional variation in end-user charges. The fact that waste collection is charged according to water consumption, used as a proxy for the waste produced by the household, hinders the application of adequate prices.15
2.2. ERSAR
ERSAR is the Portuguese regulatory agency for drinking water supply, wastewater management and municipal waste management. It is also the national authority for drinking water quality control.16
Its activity is limited to a light form of benchmarking regulation, known in the literature as Sunshine Regulation (SR).17 SR consists of the comparison and public disclosure of performance indicators for the regulated service providers. This form of regulation is not coercive and rests on pressuring the operators by a virtual form of competition:
12 See Table 1C in Appendix 1.
13 See Morris & Holthausen Jr. (1994) and Podolsky & Spiegel (1998).
14 See Johnstone & Labonne (2004) for an examination of the determinants of household solid waste generation rates using OECD-country data.
15 On the (in)efficiency of providing water and waste services together, see Simões et al. (2012).
16 Decree-Law no. 277/2009 of October 2nd. The existence of a sector specific regulation for waste is an atypical situation by international standards. See, for instance, Simões et al. (2010).
8
ERSAR is not empowered to impose fines. Despite these limitations, the Portuguese regulatory experience is quite positive, even if the causality between regulation and service enhancing is certainly debatable.18
Due to its “soft law” attributions, ERSAR is constrained in tariff setting and cannot
intervene directly in prices, though it may be called to issue an opinion. R1/09, aimed at a more harmonised, rational and transparent tariff scene is simply a set of guidelines, but assessing its appropriateness remains a valid contribution to gauge the adherence to what it advocates and identify opportunities for rectification.
3. OBJECT OF STUDY
3.1. The Concept of Social Tariffs
In the context of this project, a social tariff is broadly defined as a reduced price targeted at vulnerable domestic clients. ERSAR separates these from family tariffs, which are also a means of providing social support.19
ST eligibility may depend on multiple criteria, such as age or employment status, or simply on an income criterion as implied by R1/09: “drinking water supply, urban wastewater and municipal waste management tariffs should be reduced for household
users whose household gross income does not exceed a certain value determined by the
operator, and shall not exceed twice the annual value of the minimum monthly wage.”20 Note that R1/09 does not establish a specific income threshold, nor does it let it depend on the size or composition of the household. Implications are discussed below. A
18 Between 1993 and 2009, drinking water quality control in Portugal has exploded from 50% to 98%. See ERSAR (2010c). See also Marques & Simões (2008) on the appropriateness of SR to Portugal. 19 For benchmarking purposes, neither the UK nor France have distinct support mechanisms for the poor and larger families. See the British Water Services Regulation Authority (OFWAT) website: http://www. ofwat.gov.uk/consumerissues/problemspayingbill/watersure/ and the official site of the French Administration: http://vosdroits.service-public.fr/ F1557.xhtml, respectively.
9
possible amendment would involve resorting to equivalence scales.21
This analysis assumes that all municipalities adopt the threshold of twice the annual value of the minimum monthly wage (MMW), i.e., an annual gross income for tax purposes of 13580€.22 Though arguably unrealistic, this assumption is used for simplicity and allows for producing as encompassing an analysis as possible.
The social discounts currently applied are largely arbitrary and display the same
heterogeneity found in general user tariffs. On the contrary, R1/09 suggests that “the
recommended reduction (…), in the case of water services, must be achieved through the exemption of fixed tariffs and the application of the first block of the variable tariffs
to the user’s total consumption, up to a monthly limit of 15m³ and, in the case of
municipal waste management services, through exemption of their fixed tariff.”23
Importantly, the recommendation advocates a consistent criterion across regions, but not a uniform tariff structure, since the large price disparities may result from differing levels of water stress, population density, and even budget and political priorities. Even so, the text of R1/09 leaves room for improvement. The exemption of the fixed tariff is blind with regards to household composition. Since water consumption is essentially conditional on the number of users rather than on income profiles, this exemption proportionately benefits smaller households.24
Moreover, extending the reduced price up to 15m3/month is likely to subsidise wasteful consumption. Actually, for a subsample of 77 Portuguese municipalities, the average
21 Equivalence scales would be a nice instrument in bridging the concepts of social and family tariffs.
Some examples include the “Oxford Scale”, which assigns a value of 1 to the first household member, 0.7
to each additional adult and 0.5 to each child, the “OECD-modified Scale”, where the household head is assigned a value of 1, each additional adult is worth 0.5 and each additional child 0.3, and the “Square Root Scale”, which divides household income by the square root of household size. See OECD’s website on social and welfare issues: http://www.oecd.org/social/familiesandchildren/.
22The MMW for 2011 was 485€, which was transformed into an annual figure by multiplying by 14 months and then doubling the resulting value:485×14×2=13580€. This amount includes transfers. 23 ERSAR (2009).
10
monthly water consumption of current beneficiary households is close to 7m3 (with a median below 6m3) per month, whereas that of a general domestic household is 10m3.25 Finally, the income eligibility threshold could be adjusted for municipal purchasing power, demographic and employment profiles. In the U.K., for example, where the regulatory system for water services is one of the most advanced in the world, there are two complementary social support mechanisms – WaterSure (the vulnerable groups’
tariff, which is mandatory) and company social tariffs. They are designed to take in clients with a diversified set of characteristics that may constrain their ability to afford water bills, such as clients entitled to a jobseeker’s allowance, housing tax credit or suffering from medical conditions requiring significant additional use of water
(psoriasis, Crohn’s disease, ulcerative colitis), and call for the active participation of
providers in defining the rules, which must be approved and monitored by the regulator.26
3.2. Scope of Analysis
This subsection limits the scope of the study and discusses the implications.
Firstly, the analysis focuses on 2011 tariffs. Even if WWS are subject to 6% VAT, VAT-free tariffs are used, because neither municipal price lists nor ERSAR’s tariff
library include VAT.
Secondly, the paper addresses domestic end-users. As such, cross-subsidisation occurs only between domestic consumers, abstracting from the potential cross subsidy between industrial, institutional and domestic users.
25 The water consumption summary statistics for this sample are an average of 6.69m3/month, the mode is 4.73m3/month and the median is 5.62m3/month. See Table 2A in Appendix 2. Conversely, an average monthly water consumption of 10m3 is usually attributed by ERSAR to the representative Portuguese household. See ERSAR (2012).
26 See DEFRA – the British Government Department for Environment, Food and Rural Affairs (2012)
11
Thirdly, it is assumed that providers are indifferent to applying ST as this does not affect profits, because of cross-subsidisation. Specifically, provision cost is not considered and revenues change only in composition, not value.27
Fourthly, the activities studied are water provision (WP), wastewater treatment (WT) and undifferentiated waste management (UWM). Due to space constraints, the main text presents an in-depth analysis for WP, the service that gathers the greatest relative importance, with the corresponding output for WT and UWM being deferred to the Appendix volume. Results focus on monthly consumption profiles of 5 and 10m3 with a special emphasis on the former, as 5m3 is closest to actual average subsidised use of 7m3. These profiles are meant to be compatible with ERSAR’s database, which uses the
three monthly consumption profiles of 5, 10 and 15m3. Importantly, it is assumed that price changes implied by the introduction of ST do not affect WWS demand.28
Finally, only operators that have submitted tariff information to ERSAR and operate on retail service are considered, i.e., 338 out of the 357 economically regulated operators. This translates into the total 278 municipalities for WP and WT and only 258 for UWM.
4. LITERATURE REVIEW
The literature distinguishes between water and waste services, since, as described previously, the two sectors present important differences.
There is mixed evidence on the impact of management and regulation of WWS utilities on the efficiency of provision. For the water sector, Aubert & Reynaud (2005) study 211 Wisconsin water utilities under various regulatory regimes using a stochastic cost frontier approach and show that efficiency can be partly explained by the regulatory
12
framework. Marques (2006) shows that the regulatory strategy adopted in Portugal can effectively provide incentives for service enhancement. This result is corroborated in Marques & Simões (2008), who follow the evolution of waste utilities’ performance indicators, and show a progressive improvement in the market.29 However, Marques & Simões (2009a and 2009b), using the non-parametric technique of data envelopment analysis (DEA), show that there is significant inefficiency in the Portuguese waste sector (bulk segment). Simões et al. (2010) and Simões & Marques (2011) further
conclude that the operational environment is a key determinant of utilities’ efficiency.30
On efficient water pricing, Renzetti (1992, 1999) uses data from Vancouver, and Ontario, Canada, to show that inefficient under-pricing induces wasteful over-consumption and results in welfare losses which are estimated at approximately 4% for Vancouver. Garcia & Reynaud (2004) evaluate the pricing of water utilities in the Bordeaux area and show that marginal-cost pricing is efficient (as in Chambouleyron (2004)), but find significant differences between optimal and observed pricing schemes, while concluding for a negligible impact of moving towards efficient prices.
Cremer et al. (2001) and Cremer & Gahvari (2002) study redistribution through non-linear prices. While, ideally, redistribution should be made through income taxes, they provide a theoretical framework where ST may be appropriate. The argument builds on preference separability and implies that people with a lower (higher) than average valuation of the public sector must face an above-(below)-marginal-cost price for the public good.
In what concerns affordability and the equity aspects of provision, Reynaud (2006)
29 The hypothesis that improved performance is not due to the regulatory framework cannot be discarded, though.
30 The methodological approaches include a non-parametric DEA bootstrap model and the parametric
13
finds that opening the water sector to private capital does not improve the situation of the worse-off households. García-Valiñas et al. (2010) use data on southern Spain and discuss the appropriateness of the traditional affordability indicators, suggesting a revision of these measures based on basic water amounts. Sawkins & Dickie (2005) provide a critique of the various financial support mechanisms currently available to households in Great Britain, relating their findings to the social inclusion agenda of the government. They stress the importance of affordability benchmarks and clear policies towards the mitigation of affordability problems.
The reference which is closest to the present analysis is a recent paper by Martins et al. (2012) which computes Essential Minimum Quantities (EMQCs) and shows that water charges are not a disproportionate burden for the average household. However, when considering the 20% poorest households, there are affordability problems in an important number of municipalities, providing evidence for socio-economic inequity that favours the better-off households. The exercise proposed in this work project, while disregarding EMQCs and the properties of specific tariff structures in place, improves upon Martins et al. in a number of directions: (i) it takes into account municipal social tariffs, (ii) assesses the appropriateness of the regulator’s recommendation that deals
with social concerns in water provision, and (iii) provides a rough measure of the take-up rate in WP ST.31
5. DATA: SOURCES, PROBLEMS AND OVERCOMING STRATEGIES
This project uses data from four sources: ERSAR, the National Statistics Institute (INE), the Portuguese Tax Authority (TA), and data collected and produced by the author.
14
Each is described in turn.
ERSAR‘s 2011 tariff library (in Microsoft Excel® form) stores general domestic
end-user tariffs for three monthly consumption profiles (5, 10 and 15m3) calculated by providers for each municipality and service (WP, WT and UWM). Fixed and volumetric components and total service fees are presented separately. The database does not include ST, but it does indicate whether the municipality offers social and/or family tariffs. This information was the basis of the no-social-tariff baseline, described in the next section.
The main problem with these data is that the charges are presented as final computations instead of formulas, not allowing for calculating ST through editing. For instance, the 10m3 WP variable charge for Sever do Vouga reads a value of 6.1155€ instead of , the formula combining the prices for the first two
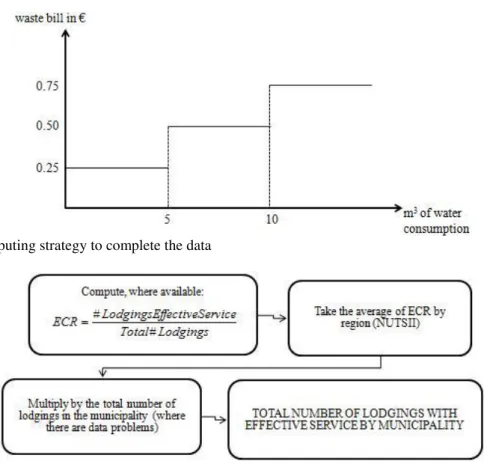
consumption blocks. Importantly, the 0.4878€ and 0.7353€ values did not show up anywhere on the database, which forced the author to consult a large number of municipal regulations and edicts. As a side-product, it was possible to identify (i) several discrepancies between the database and the published price lists that were subsequently partially corrected by ERSAR, and (ii) tariffs with similar structures not always interpreted similarly, introducing some inconsistency in the data. An expressive example is that of waste tariffs, which commonly have a semi-fixed structure according to water consumption blocks, as illustrated in Graphic 1. While in some cases 0.25€ is
introduced as the fixed charge for 5m3, in others it is interpreted as a variable charge. This poses a problem in computing R1/09 ST, because the recommendation advocates the exemption of the fixed component of the tariff.
15
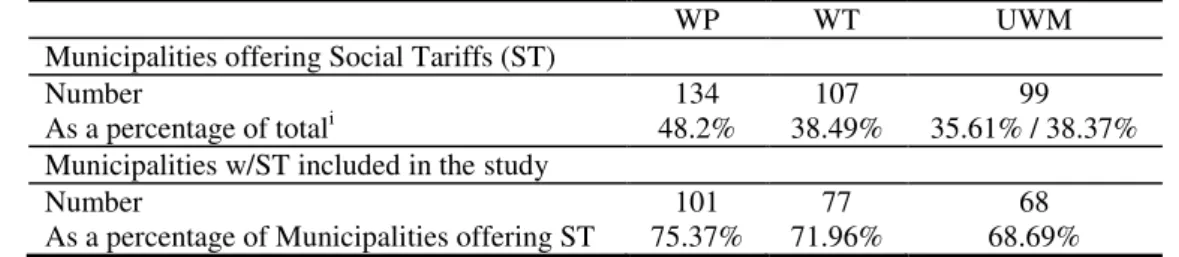
with effective service, taken as the proxy for the total number of clients. 32However, the available data feature non-integer lodging numbers, which were rounded where reasonable and discarded otherwise (e.g. 5.16 in Góis). Percentages above 100% were also ignored, adding up to missing information cases. These situations (roughly 15% of the observations) were handled by defining an Effective Connection Rate (ECR) indicator, taking its average by region (NUTSII) and multiplying by the total number of lodgings in the municipality, as summarised in Figure 1.33
Graphic 1 Illustrative municipal waste tariff
Figure 1 Imputing strategy to complete the data
The total number of lodgings per municipality was taken from INE’s 2011 Census
data.34 Micro data from the 2011 Household Budgetary Survey (HBS) were also used.35
32 These lodgings might possibly include non-domestic users (e.g. small family businesses). However, such cases would be residual and ERSAR considers this to be the best available estimate.
33 Alternative strategies included taking the average by region and typology of the area of intervention
(mainly urban, somewhat urban and mainly rural, according to ERSAR’s classification) and activity. The
16
The estimation of the number of potential beneficiaries according to R1/09 was achieved by combining the HBS with data from the Portuguese TA. The TA provided, for 2010, the gross total declared taxable income and the number of tax forms per municipality, in 5000€ brackets.36 The HBS, in turn, has household-level data, allowing for a full characterisation of the income distribution. However, the survey is representative only at the NUTSII level, forcing the assumption of a homogeneous distribution in the municipalities within a given NUTSII. Therefore, potential beneficiaries were computed as:37
,
Where stands for potential users in municipality , stand for the percentages of households with total gross income for tax purposes in the first three TA income brackets of [0, 5[, [5, 10[ and [10, 15[ thousand €, is the HBS fraction of
households within the [10000, 15000€[ bracket whose gross income does not exceed
13580€/year, and is the municipal number of households with effective service, i.e.,
the total number of clients per municipality. The subscript stands for the NUTSII region to which municipality belongs.38
Finally, data on ST were mostly collected by the author. ERSAR’s database contains a binary variable for each municipal WWS service stating whether a ST exists. For those with ST, it was necessary to check the original provider price lists and documents stating eligibility criteria. Some of these were available at ERSAR, others (50%) were obtained via a municipal survey that also collected information on the actual number of
35 Data obtained via the INE/FCT/GPEARI Protocol.
36 Data requested by ERSAR for the development of the present work project.
17
social users and social consumption profiles.39 Some municipalities failed to discriminate between social and family tariffs or to clarify the social tariff structure in place, and were therefore discarded from the sample. As such, the municipalities included are not the same for each activity. Table 3 provides some summary measures.40 R1/09 social tariffs also had to be computed. This involved taking the general user
charges provided by ERSAR and adapting them to R1/09’s text as quoted in section 3.1.
This was done for all municipalities studied, irrespective of the actual application of ST.
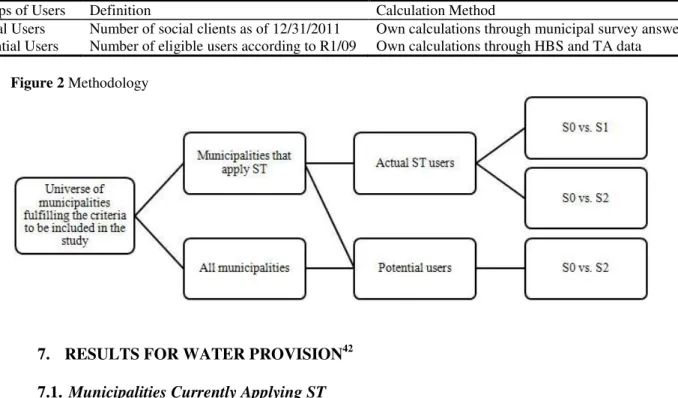
Table 3 Municipalities offering social tariffs
WP WT UWM
Municipalities offering Social Tariffs (ST)
Number 134 107 99
As a percentage of totali 48.2% 38.49% 35.61% / 38.37% Municipalities w/ST included in the study
Number 101 77 68
As a percentage of Municipalities offering ST 75.37% 71.96% 68.69%
i For UWM, the first figure refers to the total number of municipalities in mainland Portugal (278), while the second was computed taking into account only those that fulfill the requirements to be included in this study (258).
6. METHODOLOGY
In order to perform the comparisons between no-social-tariffs and applied ST, and between no-social-tariffs and R1/09 ST, three distinct tariff scenarios were set and two groups of users defined, according to Tables 4 and 5.41
The methodological approach was then to consider two clusters of municipalities. On the one hand, the focus was only on those municipalities currently applying ST. For these, using the number of actual users, the comparison is made between S0 and S1 and
between S0 and S2. This allows for assessing R1/09’s impact in terms of prices. Next,
taking the potential number of beneficiaries, S0 is again set against S2. This enables a
39 A copy of this questionnaire can be found in Appendix 4. 40 A detailed list can be found in Table 5A in Appendix 5.
18
complete evaluation of the prospective effect of applying R1/09 in those municipalities. On the other hand, all municipalities are analysed and S0 is compared with S2 using potential users. Figure 2 presents this methodology in tree form. The next section dissects the results.
Table 4 Tariff Scenarios
Tariff Scenarios Description Calculation Method
S0 or Baseline No social tariffs Obtained directly through ERSAR’s tariff library
S1 Actual ST Own calculations through municipal surveys S2 R1/09 ST Own calculations following R1/09’s text
Table 5 Groups of Users
Groups of Users Definition Calculation Method
Actual Users Number of social clients as of 12/31/2011 Own calculations through municipal survey answers Potential Users Number of eligible users according to R1/09 Own calculations through HBS and TA data
Figure 2 Methodology
7. RESULTS FOR WATER PROVISION42
7.1. Municipalities Currently Applying ST
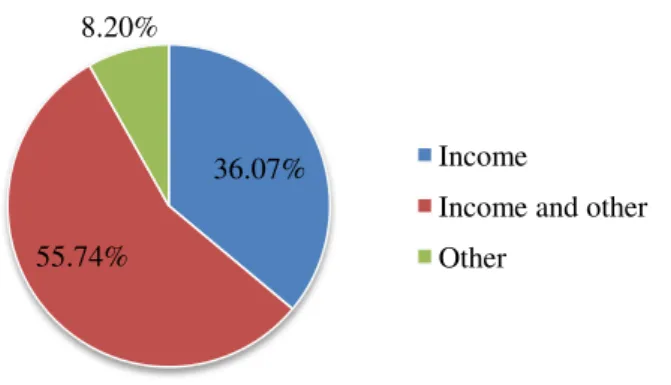
In the municipalities currently applying ST, eligibility criteria are quite diverse. However, most municipalities do follow income criteria, as shown in Figure 3.
In the vein of R1/09, about 36% of the ST analysed require solely an income criterion, but approximately 48% of these do adjust the criterion to household composition. Likewise, where the criteria include income and other characteristics (ca. 56% of the
19
cases), 62% are household adjusted. This provides yet another reason for amending R1/09 as proposed in section 3.1.
The criteria classified as “Other” include inter alia age, employment status, permanent
residential location and retirement. Yet, it is rather rare to find a municipality where the only ST scheme applied falls into this category (4 out of 103 cases). More frequently,
“Other” ST schemes are offered in tandem with income-based ST.
Figure 3 Eligibility criteria in municipalities currently applying ST
The quantification exercise (Table 6) shows that moving towards R1/09 prices while keeping the eligibility criteria constant increases total subsidisation by 7.91% and 54.87% for the 5 and 10m3 consumption profiles, respectively.43 However, taking the number of potential users into account introduces forty-eight-fold and fifty-eight-fold increases in the figure for the two consumption profiles relative to the baseline.44
Indeed, the thorough application of the upper bound definition of R1/09 covers a much wider universe of clients than what is implied by municipal criteria. This stems from a combination of inadequate take-up, possibly due to lack of ST awareness, and an adopted income threshold which may be too generous, since it implies that potential users are more than half the total number of domestic clients, forcing the remaining to
43Output measures’ definitions and formulas are presented in Appendix 6.1.
44 The differences between 5 and 10m3 are mainly due to the fact that, for 5m3, ST essentially involve the exemption from fixed tariffs, as in most municipalities the 1st consumption block extends until 5 or 6m3, implying identical volumetric charges in S0 and S2. By contrast, for 10m3 there is a combined effect of fixed and volumetric price reductions.
36.07%
55.74% 8.20%
Income
20
an over 60% bill accrual, on average, in order to finance the consumption of those deemed most vulnerable. These two problems are very severe. Table 7 estimates, for a restricted sample of municipalities that apply municipal-specific definitions of R1/09, the dimension of insufficient take-up. Importantly, none of these municipalities has chosen the upper bound definition adopted in this paper, setting instead lower eligibility limits. Operators need to be mindful of this, as social support schemes cannot sustainably be designed for the majority of clients.
Table 6 Average values for water provision output measuresi
Municipalities currently applying ST (101) All municipalities (278) Actual Users Potential Users Potential Users
Number of users 254.90 1.31 10254.11 1.23 9014.03 1.43
Percentage of users (%) 2.83 1.41 57.98 0.12 59.87 0.11
S0 vs. S1 S0 vs. S2 S0 vs. S2 S0 vs. S2
5m3 10m3 5m3 10m3 5m3 10m3 5m3 10m3
Total subsidy volume (€) 687.74 1.85 760.72 2.05 742.11 1.75 1178.16 1.63 33285.66 1.51 52197.23 1.53 27104.73 1.87 42496.35 1.85
Subsidy per beneficiary (€) 2.18 0.58 2.80 0.67 2.72 0.60 4.36 0.49 2.68 0.61 4.31 0.50 0.68 2.40 3.80 0.57
Bill accrual per non
beneficiary (€) 0.06 1.66 0.07 1.94 0.06 1.45 0.11 1.38 3.74 0.65 6.02 0.53 0.76 3.64 5.77 0.64
Percent bill accrual per non
beneficiary (%) 1.60 1.67 0.94 1.88 1.35 1.62 1.37 1.56 69.10 0.50 65.80 0.43 68.85 0.57 65.46 0.47 i Coefficients of variation are presented in italic.
Table 7 Take-up rate in selected municipalities, with (P) calculated from (1) (in section 5.) adapted to municipal-specific eligibility thresholds
Municipality Actual Users (A) Potential Users (P) Take-up Rate (A)/(P)
Alijó 0 4892 0.00%
Cartaxo 239 2151 11.11%
Coimbra 19 17739 0.11%
Esposende 139 4392 3.16%
Fundão 558 4584 12.17%
Leiria 81 10052 0.81%
Portalegre 54 2177 2.48%
Santarém 27 5890 0.46%
Tomar 34 6423 0.53%
Torres Vedras 573 14173 4.04%
Vila Nova de Famalicão 47 8299 0.57%
Vouzela 2 1245 0.16%
21
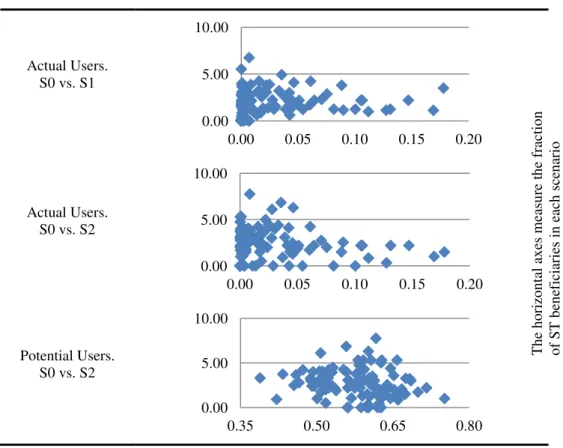
dispersion unchanged. Table 8 shows scatter plots for the amount of per capita subsidy (5m3/month) in the three scenarios concerning this first cluster of municipalities.
Despite this inter-municipal variability, on average, each beneficiary is granted a per capita subsidy that does not change radically across the scenarios (Table 6). This situation contrasts with that of general domestic users, for whom, as previously discussed, the introduction of R1/09 carries important consequences.
Table 8 Subsidy per beneficiary (€) for 5m3 in the municipalities currently applying ST
Actual Users. S0 vs. S1
Actual Users. S0 vs. S2
Potential Users. S0 vs. S2
7.2. All Municipalities
Extending the analysis to the whole set of mainland Portugal municipalities, the figures become even more evident (Table 6 above).
Logically, the number of users is the main determinant of total subsidy volumes per municipality.45 Underlying tariff properties also have a say. High fixed tariffs determine
45 See Appendix 7. for some regression attempts at explaining the determinants of water subsidisation. 0.00
5.00 10.00
0.00 0.05 0.10 0.15 0.20
0.00 5.00 10.00
0.00 0.05 0.10 0.15 0.20
0.00 5.00 10.00
0.35 0.50 0.65 0.80
22
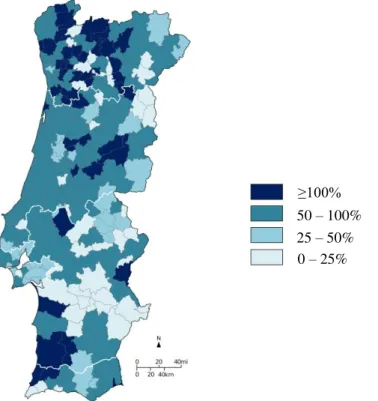
a greater subsidy, since the inexistence of the fixed component results in closer subsidised and non-subsidised bills. Naturally, high total baseline tariffs also lead to greater subsidisation. Like in the previous framework, general users would experience a heavy bill accrual if R1/09 were applied under the circumstances treated in the paper. Figure 4 shows a map of mainland Portugal with the percent bill accrual per municipality for 5m3/month. The Norte region concentrates the highest increments for non ST users (amounting to two-fold increases in WP bills), while the Alentejo stands out as the lightest region, where the percentage of operators that do not charge the fixed component of WP is highest (35.59%). Once again, this reflects general user tariff differences, so that the problem of tariff, and therefore, accrual dispersion, remains.
Figure 4 Percent bill accrual for non beneficiaries (all municipalities, potential users, S0 vs. S2, 5m3)
In a real world setting, it is nevertheless expected that (i) the number of ST beneficiaries would be necessarily smaller, either because of reduced take-up or due to municipal eligibility thresholds below the 13580€ assumed in the paper, resulting in a lower accrual for remaining users, and (ii) the burden would likely be alleviated through
0 – 25% 25 – 50% 50 – 100%
23
sharing with non-domestic clients.
8. CONCLUSION
This project paves the way to a deeper assessment of the functioning of social support mechanisms in the Portuguese WWS sector. As a first attempt at quantifying the amounts of cross-subsidization from “general” to “low-income” households implied by the thoroughly application of R1/09, it leaves important practical questions unaddressed. The most important is the homogeneous eligibility criterion used, when R1/09 allows each operator to set a different limit. This could be refined, e.g., using municipal purchasing power indexes and revising the estimation of potential users accordingly. Also, it would be interesting to evaluate the combined effect of R1/09 and Recommendation no. 2/2010, the latter explicitly tackling the tariff calculation criteria aiming at decreasing the current tariff heterogeneity. Furthermore, a caveat that will hopefully be coped with in the future has to do with the cost-side of WWS provision. An approach taking into account costs would be better prepared to discuss the appropriateness of applied prices. Nevertheless, this project remains an important doorway for studying WWS social support policies in Portugal.
24
REFERENCES
A. PUBLISHED ARTICLES
[1] Aubert, C., & Reynaud, A. 2005. “The impact of regulation on cost efficiency: an empirical analysis of Wisconsin water utilities.”Journal of Productivity Analysis, 23(3): 383-409.
[2] Chambouleyron, A. 2004. “Optimal water metering and pricing.” Water resources management, 18(4): 305-319.
[3] Cremer, H., Gasmi, F., Grimaud, A., & Laffont, J. J. 2001. “Universal service: an economic perspective.”Annals of Public and Cooperative Economics, 72(1): 5-43.
[4] Cremer, H., & Gahvari, F. 2002. “Nonlinear pricing, redistribution, and optimal tax
policy.”Journal of Public Economic Theory, 4(2): 139-161.
[5] Fankhauser, S., & Tepic, S.2007. “Can poor consumers pay for energy and water? An affordability analysis for transition countries.”Energy Policy, 35(2): 1038-1049.
[6] Garcia, S., & Reynaud, A. 2004. “Estimating the benefits of efficient water pricing in France.”Resource and energy economics, 26(1): 1-25.
[7] García-Valiñas, M. D. L. Á., Martínez-Espiñeira, R., & González-Gómez, F. 2010. “Measuring
Water Affordability: A Proposal for Urban Centres in Developed Countries.”Water Resources Development, 26(3): 441-458.
[8] Johnstone, N., & Labonne, J.2004. “Generation of household solid waste in OECD countries: an empirical analysis using macroeconomic data.”Land Economics, 80(4): 529-538.
[9] Mansur, E. T., & Olmstead, S. M.2011. “The value of scarce water: Measuring the inefficiency of municipal regulations.”Journal of Urban Economics, 71(3): 332-246.
[10] Marques, R. C.2006. “A yardstick competition model for Portuguese water and sewerage services
regulation.”Utilities Policy, 14(3): 175-184.
[11] Marques, R. C., & Simões, P. 2008. “Does the sunshine regulatory approach work?: Governance and regulation model of the urban waste services in Portugal.”Resources, Conservation and Recycling, 52(8): 1040-1049.
[12] Marques, R. C., & Simões, P. 2009a. “Incentive regulation and performance measurement of the Portuguese solid waste management services.”Waste Management & Research, 27(2): 188-196. [13] Marques, R. C., & Simões, P. 2009b. “Performance evaluation of Portuguese solid waste
services.”Engenharia Sanitária e Ambiental, 14(2): 285-294.
[14] Marques, R.C., Simões, P., & Pires, J. S. 2010. “Performance Benchmarking in Utility Regulation: the Worldwide Experience.” Polish Journal of Environmental Studies, 20(1): 125-132.
[15] Martins, R., & Fortunato, A.2005. “Residential water demand under block rates: a Portuguese case study.” Grupo de Estudos Monetários e Financeiros da Faculdade de Economia da Universidade de Coimbra, 9.
[16] Martins, R., Cruz, L., Barata, E., & Quintal, C. 2012. “Assessing Social Concerns in Water Tariffs.” Water Policy, forthcoming.
[17] Monteiro, H. 2010. “Residential Water Demand in Portugal: checking for efficiency-based
justifications for increasing block tariffs.” ISCTE-IUL, Business Research Unit (BRU-IUL), No. ercwp0110.
[18]Morris, G. E., & Holthausen Jr, D. M.1994. “The economics of household solid waste generation and disposal.”Journal of environmental economics and management, 26(3): 215-234.
[19] Podolsky, M. J., & Spiegel, M. 1998. “Municipal Waste Disposal. Unit Pricing and Recycling Opportunities.”Public Works Management & Policy, 3(1).
[20] Renzetti, S.1992. “Evaluating the welfare effects of reforming municipal water prices.”Journal of Environmental Economics and Management, 22(2): 147-163.
[21] Renzetti, S. 1999. Municipal water supply and sewage treatment: costs, prices, and distortions. Canadian Journal of Economics, 32(3): 688-704.
[22]Reynaud, A. 2006. “Assessing the impact of public regulation and private participation on water affordability for poor households: An empirical investigation of the French case.” Working Paper
University of Toulouse.
[23] Sawkins, J. W., & Dickie, V. A.2005. “Affordability of Household Water and Sewerage Services in Great Britain.”Fiscal Studies, 26(2): 225-244.
[24] Simões, P., De Witte, K., & Marques, R. C. 2010. “Regulatory structures and operational environment in the Portuguese waste sector.”Waste management, 30(6): 1130-1137.
25
performance? A parametric study on the waste sector.”Resources, Conservation and Recycling, 55(7): 695-702.
[26] Simões, P., Carvalho, P., & Marques, R.C. 2012. “Market Structure of Urban Solid Waste. Different Models, Different Results.” Center for Management Studies (CEG-IST), Technical University of Lisbon, Working Paper No. 02/12.
[27] Strathman, J. G., Rufolo, A. M., & Mildner, G. C. 1995. “The demand for solid waste
disposal.”Land Economics, 71(1): 57-64.
B. BOOKS
[1] Komives, K. 2005. Water, Electricity, And the Poor: Who Benefits from Utility Subsidies?. Washington, D.C.: The International Bank for Reconstruction and Development / The World Bank. [2] Marques, R. C. 2010. Regulation of Water and Wastewater Services: An International Comparison.
IWA Publishing.
[3] Smets, H. 2012. La Part Fixe Dans la Tarification de l'Eau des Ménages: Un Plaidoyer Pour Plus d'Équité. France: Academie de l'Eau.
C. INSTITUTIONAL PUBLICATIONS
[1] DEFRA. 2012. “Company Social Tariffs: Guidance to water and sewerage undertakers and Water
Services Regulation Authority under Section 44 of the Flood and Water Management Act 2010.”
[2] ERSAR. 2009. “Recomendação IRAR no. 01/2009: Formação de Tarifários Aplicáveis aos Utilizadores Finais dos Serviços Públicos de Abastecimento de Água para Consumo Humano, de Saneamento de Águas Residuais Urbanas e de Gestão de Resíduos Urbanos (“Recomendação Tarifária”).”
[3] ERSAR. 2010a. “Recomendação ERSAR no. 02/2010: Formação de Tarifários Aplicáveis aos Utilizadores Finais dos Serviços Públicos de Abastecimento de Água para Consumo Humano, de Saneamento de Águas Residuais Urbanas e de Gestão de Resíduos Urbanos (“Critérios de Cálculo”).”
[4] ERSAR. 2010b. “RASARP 2010: Volume 1: Caracterização do Sector.”
[5] ERSAR. 2010c. “Qualidade da Água Para Consumo Humano em Portugal Referente ao Ano de
2009.” Press release of September 30th 2010.
[6] ERSAR & LNEC. 2011. “Guia de Avaliação da Qualidade dos Serviços de Águas e Resíduos Prestados aos Utilizadores – 2.ª Geração do Sistema de Avaliação; Versão 3.0.”
[7] ERSAR. 2012. “Tarifários Aplicados em Portugal Continental nos Serviços de Águas e Resíduos
com Progressiva Harmonização”. Press release of September 26th 2012.
[8] OECD. 2004. “Take-up of Welfare Benefits in OECD Countries: A Review of the Evidence.” OECD Social, Employment and Migration Working Papers.
D. ONLINE RESOURCES
[1] AIDE FINANCIÈRE POUR LA DISTRIBUTION DE L'EAU – Service Pubic; available at http://vos droits.service-public.fr/F1557.xhtml [10/15/12]
[2] ERSAR; available at http://www.ersar.pt/website/ [6/20/12]
[3] MAPAS DE PORTUGAL – Wikipedia Commons; available at http://commons.wikimedia.org/wiki/ User:Rei-artur/by/Mapas_de_Portugal#Municipios [12/24/12]
[4] OECD – What are equivalence scales? OECD Project on Income Distribution and Poverty; available at http://www.oecd.org/social/familiesandchildren/ [11/22/12]
[5] OFWAT – Household Consumers, Paying your bill, WaterSure; available at http://www.ofwat.gov. uk/consumerissues/problemspayingbill/watersure/ [9/3/12]
[6] PORTAL DA ERSAR; available at https://portal.ersar.pt/Enterprise/LoginPageSecure.aspx [9/5/12] [7] PORTAL DAS FINANÇAS – Área Estatísticas; available at http://info.portaldasfinancas.gov.pt/pt/
dgci/divulgacao/estatisticas/ [8/3/12]
[8] PORTAL DO INSTITUTO NACIONAL DE ESTATÍSTICA; available at http://www.ine.pt/xportal/ xmain?xpgid=ine_main&xpid=INE [11/24/12]