Solid phase extraction based on
nanomaterials for isolation of urinary
volatile metabolites
Thesis submitted to the University of Madeira in order to obtain the
degree of Master in Nanochemistry and Nanomaterials
by Zheng Qiao
Study performed under the supervision of Professor José S. Câmara and co-supervised by Professor João Rodrigues
Centro de Competência de Ciências Exatas e de Engenharia, Centro de Química da Madeira,
Campus Universitário da Penteada, 9000-390 Funchal, Portugal;
“
It was the best of times; it was the worst of times.
”
3
Contents
Dedication ... 5
Declaration ... 6
Acknowledgments... 7
ABSTRACT ... 9
List of Figures ... 13
List of Tables ... 15
List of Abbreviations... 16
Thesis structure ... 19
CHAPTER I ... 20
1. Urinary Volatile organic metabolites (VOMs) as biomarkers of cancer diagnosis .. 21
1.1. Metabolic changes in cancers ... 22
1.2. Urinary VOMs as biomarkers for cancer diagnosis ... 25
1.3. Basic principles of SPE ... 26
1.4. Nanomaterials-based sample preparation in SPE ... 28
1.4.1. Metallic NPs... 29
1.4.2. Metal organic framework materials ... 36
1.4.3. Carbonaceous NPs ... 37
1.4.4. Silica NPs ... 42
CHAPTER II ... 45
2.1. Introduction ... 46
2.2. Experimental ... 50
2.2.1. Chemicals and Reagents ... 50
2.2.2. Subjects and sample collection ... 51
2.2.3. Preparation of stock and working solution ... 55
2.2.4. NMs-based Sorbent Extraction Procedure ... 56
2.2.5. Chromatographic and Mass Spectrometric Conditions ... 57
2.2.6. Method validation ... 58
2.3. Results and Discussion ... 62
2.3.1 Optimization of NMs-based sorbent extraction approach ... 62
2.3.2 Method validation of urinary VOMs using NMs-based sorbent extraction approach ... 68
2.3.3 Quantification urinary cancer VOMs using NMs-based sorbent extraction with GC-qMS ... 71
2.4. Conclusions ... 75
CHAPTER III ... 77
5
Dedication
To my dearest parents,
for their incessant love and unwavering support to my lifelong
pursuit of dreams and happiness.
Declaration
I hereby declare that this thesis is the result of my own work, is original and was written by me. I also declare that its reproduction and publication by Madeira University will not break any third party rights and that I have not previously (in its entirety or in part) submitted it elsewhere for obtaining any qualification or degree. Furthermore, I certify that all the sources of information used in the thesis were properly cited.
7
Acknowledgments
Without doubt, completing my Master degree would not have been possible without the support of others, and I’m so grateful to the people who helped me. A general
“thank you” would take a lot of pages, but a blanket statement is not enough to express my excited emotion. The following part, an attempt is to succinctly execute the former.
First and foremost, I would like to express heartfelt gratitude to my supervisor, Professor José S. Câmara, for his mentorship. His passion for science, decisive judgment as a leader, zeal for innovation, and commitment to education were sources of inspiration for me. As a novice in science, his tutelage promoted my metamorphosis to be a scholar with higher intellectual maturity to tackle problems through all my experiments.
I also need to thank Professor João Rodrigues for teaching me how to think and work like a researcher and for his useful lessons in my master career.
Tremendous thanks must go to Dr. Rosa Perestrelo. As a significant portion of my thesis, chromatographic studies of products from SPE are necessary and essential. Her rich experience and abundant knowledge in chromatographic topics were extremely resourceful. From the chromatographic studies, I learnt the importance of patience and meticulousness in research.
During the days I stayed in Spain, several people from Analytical Chemistry department in the University of Córdoba, Professor S Cárdenas, Professor R Lucena and colleague Emilia M Reyes-Gallardo, made important fundamental contributions to my research. Moreover, I must thank their support on the investigation of my samples by TEM.
All group members, past and present, are talented researchers with whom it was a pleasure to work, and I am grateful to all of them. I will never forget that Michael Caldeira and Rosa picked me up to the airport no matter when and where I went. Moreover, many thanks to the suggestions and supports which were given by Rosa, Catarina and Michael.
Absolutely none of what I accomplished would have been possible without my family and friends. Thank you Hao Zhang, Yao Chen, and Chunzi Kong for being such good friends. I am so grateful to my mother and father for raising me in a safe, happy, loving, and joyful home; I cannot possibly thank you enough for all you have invested in me.
9
A
BSTRACT
Testing of urinary volatile organic metabolites (VOMs) is recognized as a useful medical approach since they are the end-products of metabolic processes and non-invasively sampling. Among the various techniques conventionally used for metabolic profiling, gas chromatography-quadrupole mass spectrometry (GC-qMS) is viewed as an effective approach for the testing of VOMs in urine due to its high sensitivity, peak resolution and reproducibility. Solid phase extraction (SPE), one of the sample preparation methods, has been proven to be a robust tool for the application in target VOMs concentration and separation from complex matrix.
The aims of this study are to explore new nanomaterials (NMs), such as inorganic and carbon-based nanoparticles magnetic NPs (MNPs), combined with GC-qMS in order to isolate and pre-concentrate the target urinary VOMs, reported as possible cancer biomarkers. Concerning to the nanosorbent, the best efficiency of extraction is achieved with nanohydroxyapatite (NHA) and magnetic Fe3O4@SiO2-C18 NPs. Some
experimental parameters such as, sorbent amount, adsorption and elution time, as nature of elution solvent, were investigated and compared. Under optimal conditions for nanohydroxyapatite (NHA) and magnetic Fe3O4@SiO2-C18 NPs, the obtained
results revealed a good linearity (r2 ≥ 0.988) within the linear dynamic range, for all
study provides a new, reliable and high throughput strategy for the determination of VOMs in human urine.
Keywords: Nanohydroxyapatite; Magnetic nanoparticles; Volatile Organic
11
Resumo
Os metabolitos orgânicos voláteis (VOMs) presentes na urina de pacientes
oncológicos são de grande utilidade no diagnóstico da doença e na diferenciação entre
diferentes patologias oncológicas, , uma vez que são produtos resultantes de processos
metabólicos. Entre as diversas técnicas convencionalmente utilizadas para estabelecer
o perfil metabólomico, a cromatografia em fase gasosa acoplada à espectrometria de
massa (GC-qMS) é considerada uma abordagem eficiente para ensaios urinários de
VOMs devido à sua elevada sensibilidade, resolução e reprodutibilidade. A extração
em fase sólida (SPE), um dos métodos de preparação de amostras, demonstrou ser
uma ferramenta robusta para a aplicação no isolamento e pré-concentração de VOMs
em matrizes complexas.
Os objetivos deste estudo visam explorar novos nanomateriais (NMs), nomeadamente
nanopartículas inorgânicas (NPs) e magnéticas à base de carbon (MNPs) ,
combinadas com GC-qMS com intuito de isolar e pré-concentrar VOMs presentes na
urina de indivíduos oncológicos. Relativamente ao nanosorvente, foram estudados a
nanohidroxiapatite (NHA) e MNPs Fe3O4@ SiO2-C18. Alguns parâmetros
experimentais com influência na eficiência de extração, tais como a quantidade de
sorvente, o tempo de adsorção, o tempo de eluição e o solvente de eluição, foram
avaliados. Sob condições otimizadas, e para os 2 nanosorventes testados, os resultados
obtidos demonstraram uma boa linearidade (r2 ≥ 0,988), na gama de concentrações usadas para todos os metabólitos voláteis urinários investigados. A estratégia proposta
quantificação (LOQs) entre 32,4 a 231,6 ng/L. O método proporcionou igualmente
resultados satisfatórios em termos de efeito de matriz (62,8-96,1%) e recuperações
(precisão) superiores a 70 % para a maioria dos VOMs estudados. A precisão intra- e
inter-dia foi inferior a 3 e 13%, respetivamente. Verificou-se que os NMs usados
como sorventes, NHA e Fe3O4@ SiO2-C18, combinado com GC-qMS forneceram uma
estratégia vantajosa, confiável e de alta eficiência de extração na determinação de
VOMs alvo na urina.
Palavras-chave: Nanohidroxiapatite; Nanopartículas magnéticas; Metabolitos
orgânicos voláteis; Extração em fase sólida; Cromatografia em fase
13
List of Figures
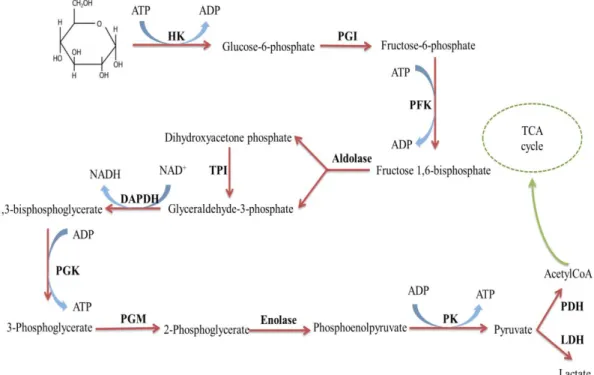
Fig. 1.1. Processes of Glycolysis. HK, hexokinase; PGI, phosphoglucose isomerase;
PFK, phosphofructokinase; TPI, triosephosphate isomerase; GAPDH, glyceraldehyde-3-phosphate dehydrogenase; PGK, phosphoglycerate kinase; PGM, phosphoglycerate mutase; PK, pyruvate kinase; PDH: pyruvate dehydrogenase; LDH: lactate dehydrogenase.
Fig.1.2. Structures of biomarkers from the study of Silva et al.
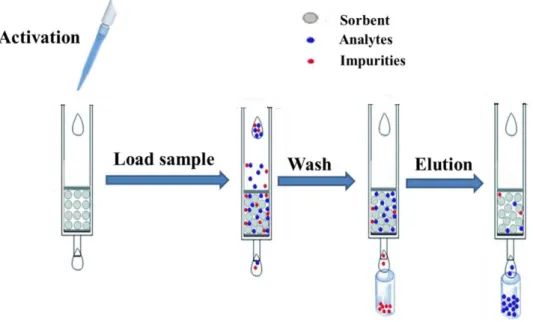
Fig. 1.3. Typical procedures of SPE extraction.
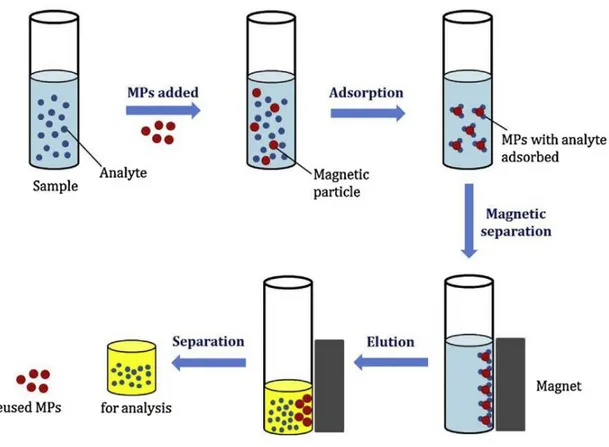
Fig. 1.4. General procedure of Magnetic SPE.
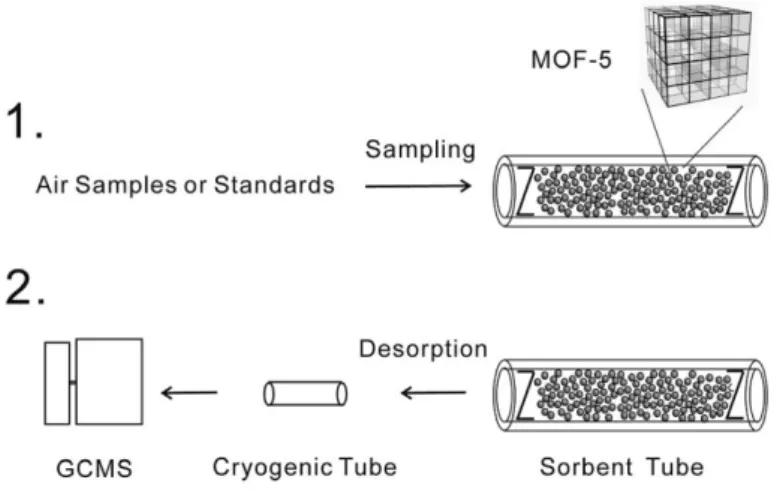
Fig. 1.5. Schematic of sampling and desorption procedures on MOF-5 packed tube.
Fig. 1.6. (a) Models of GO and graphene sheets. The shadowed sections indicate the
polar groups in the GO and graphene sheets. (b) Chemical routes to the synthesis of GO@silica and G@silica. NP-SPE, Normal-phase SPE; RP-SPE, Reversed-phase SPE; EDC, (N-(3-dimethylaminopropyl)-N’-ethylcarbodiimide hydrochloride; NHS, N-hydroxysuccinimide, DCC =N,N’-dicyclohexylcarbodiimide, DMF =
dimethylformamide
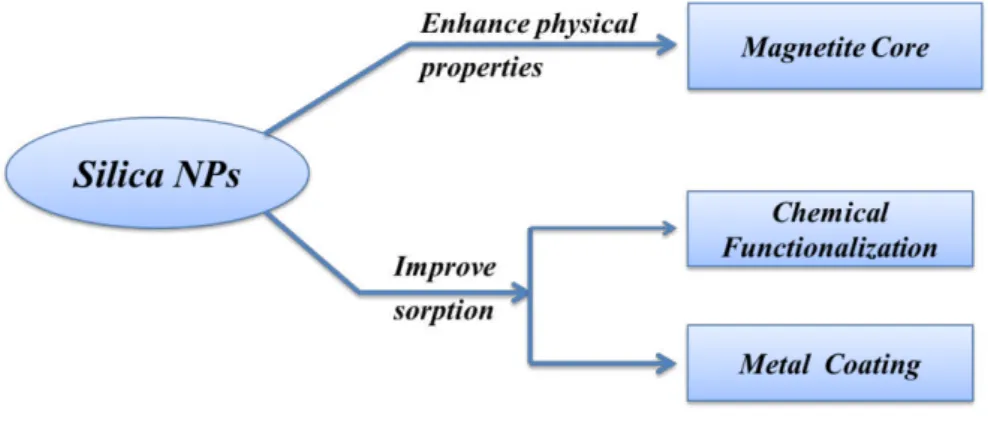
Fig. 1.7. Main strategies of functionalization/modification of silica NPs.
Fig. 2.1 Chemical structures of the volatile metabolites used in the experiment
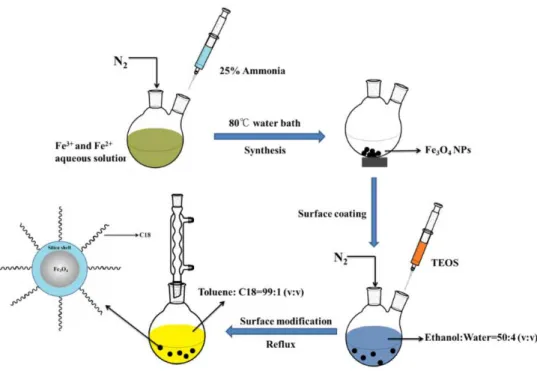
Fig. 2.2. Schematic illustration of the preparation of Fe3O4@SiO2-C18 NPs..
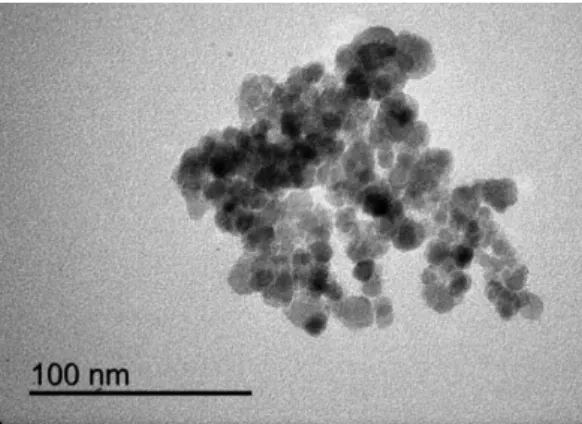
Fig. 2.3. TEM microscopy of Fe3O4@SiO2-C18 NPs.
Fig. 2.4. IR spectrum of Fe3O4@SiO2-C18 NPs.
Fig. 2.5. TEM microscopy of Fe3O4@PPy NPs.
Fig. 2.6 IR spectrum of Fe3O4@PPy NPs.
Fig. 2.7. Scheme showing the route for NHA to the extraction of VOMs.
Fig. 2.9. Total ion chromatogram of fortified synthetic urine by NHA/GC-qMS under
optimum conditions.
Fig. 2.10. Effect of sorbent amount of NHA on the adsorption efficiency of VOMs.
Fig. 2.11. Effect of sorbent amount of Fe3O4@SiO2-C18 NPs on the adsorption
efficiency of VOMs.
Fig. 2.12. Effect of adsorption time on the adsorption ability of VOMs in NHA.
Fig. 2.13. Effect of adsorption time on the adsorption ability of VOMs by
Fe3O4@SiO2-C18 NPs..
Fig. 2.14. Effect of elution time on the adsorption of VOMs by NHA.
Fig. 2.15. Effect of elution time on the adsorption of VOMs by Fe3O4@SiO2-C18 NPs
Fig. 2.16. Effect of chemical nature of eluent systems on the adsorption of VOMs by
NHA.
Fig. 2.17. Total ion chromatogram of cancer patient using NHA-based sorbent
15
List of Tables
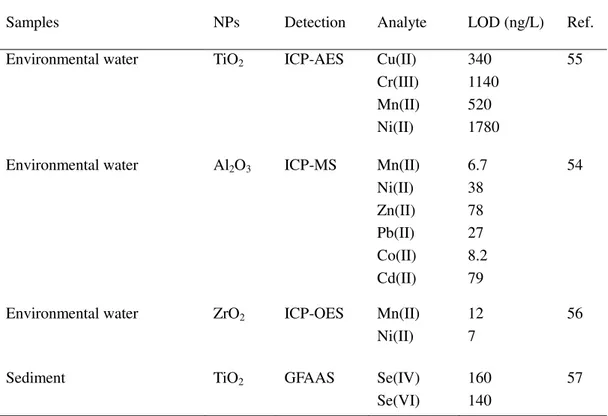
Table 1.1 Pre-concentration of metal ions by metal oxide NPs.
Table 1.2 Application of magnetic SPE for different analytes.
Table 2.1. Validation parameters for urinary cancer biomarkers using NHA-based
sorbent extraction combined with GC-qMS.
Table 2.2. Validation parameters for urinary cancer biomarkers using
Fe3O4@SiO2-C18 NPs-based extraction with GC-qMS.
Table 2.3. Urinary cancer biomarker concentration (µg/L) in urine samples using NHA-based
sorbent extraction combined with GC-qMS.
Table 2.4. Urinary cancer biomarker concentration (µg/L) in urine samples using
List of Abbreviations
Acetyl-CoA Acetyl-coenzyme A
Akt Serine/threonine kinase
BPA Bisphenol A
BPF Bisphenol F
BFDGE Diglycidyl ether
CNTs Carbon nanotubes
C8 Carbon8
C18 Carbon18
CPs Chlorophenols
CT Computed tomography
CTAB Cetyltrimethyl ammonium bromide
DDTC Diethyldithiocarbamate
FAAS Flame atomic absorption spectrometry
HPLC High-performance liquid chromatography
HPLC-DAD High-performance liquid
chromatography-Diode array detection
HPLC-FLD High-performance liquid
chromatography-Fluorescence detection
ICP-AES Inductively coupled plasma-atomic emission
spectrometry
ICP-MS Inductively coupled plasma-mass
spectrometry
17
LLE Liquid-liquid extraction
LLME Liquid-liquid microextraction
LODs Limits of detection
LOQs Limits of quantification
MALDI-TOF-MS Matrix-assisted laser desorption ionization- time of flight-mass spectrometry
ME Matrix effect
MOFs Metal organic frameworks
MOF-5 (Zn4O(BDC)3)
MIL-101 Matériaux de l’Institut
Lavoisier no. 101
MRI Magnetic resonance imaging
MSPE Magnetic solid phase extraction
MWCNTs Multi-walled carbon nanotubes
NHA Nanohydroxyapatite
NMs Nanomaterials
N.R. Not reported
OTMS Octadecyltriethoxysilane
PAHs Polycyclic aromatic hydrocarbons
PET Positron emission tomography
PK Pyruvate kinase
RSDs Standard deviations
SPE Solid phase extraction
SPME Solid phase microextraction
SWCNTs Single-walled carbon nanotubes
TCA cycle Citric acid cycle
TEM Transmission electron microscopy
TEOS Tetraethyl orthosilicate
TICs Total ion chromatograms
Tp53 Tumor protein 53
VOMs Volatile organic metabolites
19
Thesis structure
Chapter I represents some topics which help to fully understand the purpose of this
study. The details involved in this chapter are:
1. Why urinary volatile organic metabolites (VOMs) can be used as cancer biomarkers.
2. Why solid phase extraction (SPE) was selected in this study. 3. Recent advances of nanomaterials (NMs) as SPE sorbents.
Chapter II ascertains the application of Laponite, SiO2, TiO2, nanohydroxyapatite
(NHA) and magnetic Fe3O4@SiO2-C18 NPs as sorbents to extract target VOMs from
urine samples. Some variables which influence the extraction efficiency, including sorbent amount, adsorption time, elution time, and types of elution solvent, were investigated. Through the results from urine sample test, it demonstrated that NHA and magnetic Fe3O4@SiO2-C18 NPs are good candidates being sorbents for extracting
VOMs. In addition, Fe3O4@PPy NPs were synthesized and characterized for the
further investigation.
Chapter III deviating from the results from chapter II provides a detailed conclusion
CHAPTER I
21
1. Urinary Volatile organic metabolites (VOMs) as biomarkers of
cancer diagnosis
Cancer is a disease of DNA deregulation where endogenous (age, endogenous hormones, genetics and heredity, race) and exogenous (hazardous substances and chemicals, radiation, diet, food additives, lifestyle and behavior) factors are linked to its development.1 Despite global efforts to limit the incidence of this disease, cancer has become the leading cause of death in the last five decades. Various forms of cancer, including lung-, prostate-, colon- and breast cancer, are now responsible for a quarter of all deaths among males and females through all the world.2 The management of high-risk cancers requires diagnosis at an early stage. To date, current screening trials have primarily focused on imaging modalities, including computed tomography (CT),3 magnetic resonance imaging (MRI),3 positron emission tomography (PET),4 endoscopy5 and ultrasonography, 6 coupled with clinical analysis. In most cases, removal of cells or tissues is required resulting in unpleasant for patients, in addition, these methods are expensive and time-consuming.
cancer cells, exhaled biological fluids (e.g., blood or urine) or in the exhaled breath.9
As mentioned above, the analysis on cancer cells and blood can be ascribed to invasive approach, whereas technologies related with exhaled breath are always expensive. Thus, analysis on urinary VOMs is viewed promising candidate for the detection and diagnosis of cancer. In this part, some molecular biology backgrounds about metabolic changes in cancer will be briefly addressed, followed by a simple summary on the recent advances in the discovery of urinary VOMs potential cancer biomarkers.
1.1. Metabolic changes in cancers
The Warburg effect explains one of the most important metabolic alterations in cancer cells related to the increase in aerobic glycolysis and the dependence to generate ATP by glycolysis. The glycolytic process converts one molecule of glucose into two molecules pyruvate and the free energy released is used to form two high-energy ATP. In normal conditions, pyruvate converts to acetyl-coenzyme A (acetyl-CoA), which provides the basis for the citric acid cycle (TCA cycle) and oxidative phosphorylation. Although cancer cells do not use glucose efficiently, they often convert pyruvate to lactate (Figure 1.1). Although the relationship between the increase in aerobic
23
Fig. 1.1. Schematic processes of glycolysis. HK, hexokinase; PGI, phosphoglucose isomerase; PFK, phosphofructokinase; TPI, triosephosphate isomerase; GAPDH, glyceraldehyde-3-phosphate dehydrogenase; PGK, phosphoglycerate kinase; PGM, phosphoglycerate mutase; PK, pyruvate kinase; PDH: pyruvate dehydrogenase; LDH: lactate dehydrogenase. Adapted from Ref. 9.
Pyruvate kinase
Hypoxia
Cancer hypoxia is the situation where cancer cells are deprived of oxygen. For continuous growth and proliferation in challenging hypoxic situation, metabolism changes are found in cancer cells. Typically, inducible factor-1 (HIF-1) serve as a key regulatory factor which take responsibility for adaptive cellular responses, and then the expression of target genes related with angiogenesis, glycolysis, growth factor signaling, apoptosis, and metastasis are found. In addition, over-expression of HIF-1 takes responsibility of cervical, ovarian, endometrial stomach and breast cancers.13
Protein kinase B
The serine/threonine kinase (Akt) which plays a significant role in many cellular processes may contribute to tumorigenesis. Akt, for instance, is associated with the regulation of cell proliferation. Moreover, the regulation of glucose uptake in nanotransformed cells has relationship with Akt. Akt1 triggers the accumulation of NADH and lactate, and accelerates the consumption of glucose.14 Thus, understanding Akt and its pathways is necessary for creating better therapies to cancer cells.
Tumor protein 53
Tumor protein 53 (Tp53), one of the earliest found anticancer gene, has generally been described as cancer suppressor gene. Tp53 is an important anticancer gene which can prevent cancer occurrence, on the other hand, it also has the ability to repair the defects of cell gene, which helps defected cancer cells undergoing chemotherapy become new ones. The loss of Tp53, moreover, results in increased glycolysis, impairing respiration and leaving glycolysis as the main source of ATP production.15
Lactate dehydrogenase
25
absence of oxygen. The over-expression of LDH indicates the metabolic alters compared to normal cells. Some investigations exhibited that the expression of LDH can be induced directly by oncogenes (c-Myc)16 or indirectly through the activation of HIF-1.17
1.2. Urinary VOMs as biomarkers for cancer diagnosis
Sometimes, certain molecules originating from metabolic disturbances are observed in cancer cells relative to their counterparts, and their altered levels can be measured to establish a correlation with the diseased state. As mentioned above, the investigations on exploring urinary VOMs as biomarkers are viewed as a non-imaging, non-invasive, and non-expensive method, but relative few results have been reported.18 Metabolites studies generally employ techniques such as nuclear magnetic resonance (NMR), high performance liquid chromatography-mass spectrometry (HPLC-MS) and gas chromatography-mass spectrometry (GC-qMS). Among all the techniques mentioned above, GC-qMS has been widely used in the identification and quantification of metabolites due to its high sensitivity, peak resolution and reproducibility.19-21 Recently, the analytical platforms used for exploring urinary VOMs are mainly based on solid phase microextraction (SPME) and GC-qMS. For example, Silva et al.18
studied the urinary metabolomics profile of 26 breast cancer patients and 21 healthy individuals with the purpose of studying VOMs as biomarkers in the early detection of cancer. 79 VOMs were detected, belonging to distinct chemical family, in control as well as breast cancer groups. The levels of some molecules, including 4-carene, 3-heptanone, 1,2,4-trimethylbenzene, 2-methoxythiophene, and phenol, increased and then were promoted as breast cancer biomarkers. In addition, the presence of dimethyl disulfide in lower amounts in cancer patients also was identified (see Figure 1.2).
cancer biomarkers.
Fig.1.2. Structures of biomarkers from the work of Silva et al.22
In general, the main disadvantage of SPME is uncovered if the sensitivity is low with regard to the target concentrations of analyte. The occurrence of a huge number of interferents in the chromatogram which comes from endogenous trace substances in urine prevents the analysis of target VOMs at low concentrations (ppm to ppt).23 Thus, in this study, solid phase extraction (SPE) coupled with GC-MS was selected as main technique. In the following part, the basic principles of SPE and NMs-based sample preparation are summarized and discussed in detail.
1.3. Basic principles of SPE
27
with better recoveries, lower cost, and reduced consumption of organic solvents. The extraction can be carried out within a SPE cartridge/column (Figure 1.3),28 or simply
by dispersing sorbents in sample solution followed by collecting the analyte-adsorbed sorbents.29 For the former method cumbersome packing of sorbent into the column and time-consuming loading of large-volume samples, however, are the disadvantages of this mode. But the latter method can avoid the problems mentioned above.
Fig. 1.3. Typical procedures of SPE extraction.
In SPE, the selection of appropriate sorbent, in large part, relies on the understanding of the mechanism of interaction between the sorbent and analytes. In general, the most common mechanisms in SPE depends on hydrophobic (non-polar interactions), hydrophilic (polar interactions) and cation-anion interactions.30
Hydrophobic interaction
In reversed phase, the non-polar functional groups of the sorbent operate according to the Van der Waals forces. In general, the analyte is typically mid- to non-polar. The non-polar solvent which have ability to disrupt the forces between the sorbent and analyte is usually selected as elution solvent.31
Normal phase provide a polar sorbent and the extraction performance of an analyte under normal phase is mainly based on the interaction between polar functional groups of the analyte and polar groups of the sorbent. These processes generally involve hydrogen bonding and π-π interactions. Analyte adsorbed on the sorbent through these mechanisms is usually eluted by a solvent whose polarity is more than sample.31
Cation-anion interactions
The main mechanism of cation-anion interactions depends on the electrostatic attraction of the charged functional group of the analyte to the oppositely charged group of the sorbent. These interactions usually disrupted via modifying pH to neutralize analyte or sorbent, in addition, using more selective counter-ion to compete for ion-exchange binding sites.32
There are several factors which affect the final extraction results. The exploring suitable sorbent should firstly be taken into consideration since the SPE process could be achieved due to the affinity of analytes to sorbents.30 In addition, the sorbent area is also a main factor responsible for the extraction performance because large surface area of sorbent means more activity of sorbent.33 The meaning of pH is also very important. Unsuitable pH values affect the properties of sorbents, such as functional groups of sorbents may be cleaved.30 Last, the selection of appropriate elution solvent plays vital role for the extraction results, for example, non-polar solvent is good candidate as elution solvent in reversed phase SPE.34
1.4. Nanomaterials-based sample preparation in SPE
29
SPE therefore is oriented on exploring novel sorbents with high capacity, good regenerability and surface area accessibility. NMs, materials, in principle, of which a single unit is sized between 1-100 nm, seem the ideal candidate to be SPE sorbent since they often exhibit, compared to their bulk counterparts, impressive changes, such as improved optical, electrical, thermal, magnetic, catalysis characteristics because of their ultra-small size effect.35-39 Initially,target analytes and interferents were directly removed and concentrated by NMs in SPE. Different chemical groups can also be conjugated on the surface of NM in order to increase their affinity toward target compounds, which makes them suitable to extract target analytes in various samples, such as environmental and biological samples. In this part, some of the important NPs used as sorbents in SPE including metallic NPs, metal organic frameworks (MOFs), carbonaceous NMs and siliceous NPs are discussed due to their widely applications. It should be noted that this part is not a comprehensive survey, but rather discusses some advanced development on the application of NMs used in SPE.
1.4.1. Metallic NPs
Metallic NPs involves a lot of pure inorganic metal, metal oxide NPs and organic/inorganic hybrid NPs, such as MOFs. Due to their chemical compositions, size, and surface structure characteristics, metallic NPs attracted attention in the application of sample preparation of SPE.40
i) Metal NPs
well-organized self-assembled monolayer.42
By making use of the affinity between polycyclic aromatic hydrocarbons (PAHs) and Au NPs, Wang et al.43-45 developed solid phase nano-extraction (SPNE) technique
to pre-concentrate PAHs the from water samples. The Au NPs in 20 nm diameter showed the best extraction efficiency. Through the entire extraction procedure, the consumption of organic solvents per sample is less than 100 μL. High-performance liquid chromatography (HPLC) and laser excited time-resolved Shpol’skii spectroscopy are the two ways for the analysis of the extraction. Similar method was employed to improve the analytical recovery and the detection limits of monohydroxy-PAHs (OH-PAHs) in urine sample.46
By simply mixing Au NP of 13 nm and Al2O3 particles of 50-100 μm, an Au
NP-Al2O3 sorbent was introduced to extract mercury species from nature water.47
Compared to the Al2O3 and Au NP sorbents, the Au NP-Al2O3 sorbent exhibited
excellent extraction efficiency to mercury species and other tested metal ions. Inductively coupled plasma-mass spectrometry (ICP-MS) allowed the detection of mercury ions down to sub-ppq level in aqueous sample. In addition, sequential using of Al2O3 and Au NP-Al2O3 sorbents enjoy the selectively concentration of inorganic
and organic mercury species. Karimipour et al.48 developed a Au NPs-based sorbent
conjugated activated carbon for pre-concentrating trace amounts of Co2+, Cu2+, Ni2+, Fe2+, Pb2+, and Zn2+ in water samples. Under optimized conditions a pre-concentration factor of 200 was obtained for all the metal ions with detection limits of 1.4-2.6 ng/mL. Gunduz et al.49 synthesized TiO2@Au NPs functionalized
31
directly aspirated into the flame for the determination of analytes without elution step, which is the most treasured advantages and the novelty of this established method 36.
Considering the similar properties of Ag with Au, organic compounds have been also purified with Ag NPs. In the presence of cetyltrimethylammonium bromide, a solution stable Ag NPs can be obtained by reducing AgNO3 with NaBH4 in an
aqueous solution. Nonpolar organic compounds, for example, PAHs can be pre-concentrated on the surface of Ag NPs. The presence of Ag NPs, moreover, allows the enhancement of analyte luminescence, which has been demonstrated to be useful for the pre-concentration and direct analysis of trace amounts of PAHs in aqueous samples.50 A method for separation and pre-concentration of Pb2+ and Cu2+ with cysteamine modified TiO2@Ag NPs was reported by Baysal et al.51 Similar to the
TiO2@Au NPs mentioned above, the ion-loaded slurry was separated and directly
introduced into FAAS for detection.
ii) Metal oxide NPs
Metal oxide NPs including TiO2, ZnO, ZrO2, Al2O3, and CeO2 have received much
more attention because of their use in the application on extracting pollutants. These metal oxide NPs, in most cases, were selected as SPE sorbents for the enrichment of organic compounds and toxic heavy metal ions. Due to their fascinating properties: high chemical stabilities, high adsorption capacity and easy modification ability, these metal oxide NPs meet the requirement of SPE sorbents.52
The adsorption of toxic metal ions and rare earth elements on TiO2 NPs has been
reported recently. Baytak et al.,53 for example, described a trace element
pre-concentration procedure by using a minicolumn of yeast immobilized TiO2 NPs
for determination of multi-element (e.g., Cr, Cu, Fe, Mn, Ni, and Zn) from water and
spectrometry (ICP-AES). Some advantages of this established method, including long column reusability, high capacity of pre-concentration and lower memory effects, were observed. In addition, Al2O3 NPs have been also used as sorbent for analyzing
metal ion in environmental waters.54 Some examples are summarized in Table 1.1.
Table 1.1 Pre-concentration of metal ions by metal oxide NPs.
Samples NPs Detection Analyte LOD (ng/L) Ref.
Environmental water TiO2 ICP-AES Cu(II) Cr(III) Mn(II) Ni(II) 340 1140 520 1780 55
Environmental water Al2O3 ICP-MS Mn(II) Ni(II) Zn(II) Pb(II) Co(II) Cd(II) 6.7 38 78 27 8.2 79 54
Environmental water ZrO2 ICP-OES Mn(II) Ni(II)
12 7
56
Sediment TiO2 GFAAS Se(IV)
Se(VI)
160 140
57
Rendering selectivity is important for the use of these NPs as sorbent in SPE. Along this line, physical or chemical modification of the sorbent surface with organic compounds is required. By coordination chemistry some molecules, such as (a) dithizone, (b) diethyldithiocarbamate (DDTC), (c) 1-(2-pyridylazo)-2-naphthol or (d) 8-hydroxyquinoline can be immobilized on TiO2 NPs and these compounds have been
used to pre-concentrate toxic metal ions.57-59 Except TiO2 NPs, Al2O3 NPs also can be
modified by chelating molecules. The modification of Al2O3 NPs with dithizone has
33 iii) Magnetic SPE
It is well established that magnetic SPE is a rapid and easy sample preparation method. In this procedure, the magnetic sorbents are always directly dispersed in the sample solutions and the target analyte therefore is adsorbed on the surface of the sorbents which are separated from the aqueous solution by an external magnetic field. After, the target analytes are eluted for further determination. The general procedure is available in Figure 1.4.62 Some problems with conventional SPE, such as
cumbersome of the packing of columns and the time-consuming process of loading large-volume of samples, can be avoided. Typically, the magnetic sorbent was composed with a core material (e.g. Fe3O4) to collect by a magnetic field, and a
supported NP to extract different analytes.63 Table 1.2 presented the application of
magnetic SPE for different analytes in recent years.64
34
Table 1.2 Application of magnetic SPE for different analytes
Ref 65 66 67 68 69 70 71 72 73 Sample Water samples Water samples Water samples Bottled
beverages, tap
water and
perfume samples Serum samples Urine samples Water samples Water samples Water samples Linear range (ng/mL) 0.5-80 0.01-50 0.05-10 0.2-50 10.9-425. 5 5-2000 0.1-50 0.05-50 0.5-100 Limits of quantification
(ng/mL) 0.05-1.14 n.r. n.r. 0.016-0.13 10.9-14.2 4.03-7.83 n.r. n.r. 0.32-0.53 Limits of detection
(ng/mL) 0.015-0.335 0.001-0.05 0.009-0.032 0.0049-0.038 3.1-4.1 1.21-2.35 0.02-0.04 0.01-0.006 0.09-0.16 Analyte PAHs
BPA, BPF and BFDGE
PAEs
PAEs
Aconitines
Small molecule
compounds Carbamate pesticides Neonicotinoid insecticides Sulfonamide antibiotics Analytical method GC-MS GC-MS/MS GC-MS/MS GC-MS HPLC-DAD MALDI-TOF MS HPLC HPLC-UV HPLC-UV Functional monomer
Fe3O4
Fe3O4
Fe3O4
Fe3O4
Fe3O4
Fe3O4@graphene
Fe3O4
Fe3O4
Fe3O4@SiO2
35 Ref 74 75 76 77 78 79 80 81 82 Sample Water samples Rat plasma
Green tea
beverage samples Water samples Water samples Urine samples Water samples Water samples Environmental and biological samples
Linear range
(ng/mL) 10-800 100-4000 22.5-1575 0.1-10 0.5-300 0.0003-0.003 n.r. n.r. 0.32-320 0.63-300 0.28-400 Limits of quantification
(ng/mL) n.r. n.r. 18-63 n.r. 0.5 0.00004-0.00039 n.r. n.r. n.r Limits of detection (ng/mL) 0.8-36 10 5.4-16.8 12.3-36.5 0.15 n.r. n.r. n.r 0.14 0.19 0.12 Analyte PAHs Methylprednisolone Flavonoids PAEs Methylmercury PAHs PAHs
Anionic organic
pollutants
Pb, Cd and Cu Analytical method GC-MS HPLC HPLC-DAD HPLC GC-MS GC-MS HPLC-FLD HPLC-MS/MS FAAS Functional monomer
Fe3O4
Fe3O4@SiO2
Fe3O4
Fe3O4@C18
Fe3O4
Fe3O4
Fe3O4@SiO2
Fe3O4@SiO2
Fe3O4@SiO2
Supported NPs C18 C18 Chitosan Chitosan Polyaniline (PANI) Diphenyl
SiO2-C18
C18/NH2
1.4.2. Metal organic framework materials
MOFs may be defined as a class of organic-inorganic hybrid supermolecular materials
that consist of ‘‘strong bonding” providing robustness, linking units that are available for modification by organic synthesis, and a geometrically well-defined structure.83-85 The materials show different pore size and diverse topology by changing the structure; in addition, the modification of their internal surfaces is easy.
MOF-5 (Zn4O(BDC)3 (BDC2-:1,4-benzenedicarboxylate) with 3D frameworks86
was used as the sorbent for in-field sampling and pre-concentration atmospheric formaldehyde from air samples due to their large surface area and pore volume (Figure 1.5). By comparing those of commercial sorbents Tenax TATM (organic
polymer) and Carbograph 1TDTM (graphitized carbon black), it showed a good performance to analyze indoor and outdoor air. The good recovery of analysis, in general, after long-time transportation or storage is necessary especially when subjecting situations, such as a long distance between the sampling spot and laboratory and delay between sampling and analysis in the laboratory are inevitable. After sampling, MOFs showed a 90% recovery even 72 h storage at room temperature.87
37
Fig. 1.5. Schematic of sampling and desorption procedures on MOF-5 packed tube.75
1.4.3. Carbonaceous NPs
Progress in materials science provides new tools in the analytical sample preparation. Recently, a large number of carbon allotropes have been reported in the literature.91-94 Most of the carbonaceous NMs have been used as sorbents in different sample preparation techniques. Here, the interests mainly focus on the application of graphene and carbon nanotubes (CNTs) on SPE in recent three years.
i) Graphene
Graphene, a monolayer of carbon atoms densely packed into a 2D honeycomb crystal lattice with a large specific surface area, show great adsorption ability.95 The large delocalized π-electron system of graphene offer a strong affinity for π-π stacking interaction with carbon-based aromatic ring structures.96 In addition, easily modification of graphene provide enhanced selectivity, the remarkable example is graphene oxide (GO).97 Some literatures referred to graphene as good candidate sorbent in SPE have been reported.
As a pioneer work, Liu et al.28 used graphene as sorbent for chlorophenols (CPs)
were observed. Moreover, the graphene could be reused over 50 times without lacking of recoveries. In order to analyze lead in environmental water and vegetable samples Wang et al.98 developed a SPE method based on graphene. Dithizone was used as
chelating reagent before its determination by FAAS. The graphene is viewed as sorbents in SPE because of their outstanding advantages: fewer solvents and samples consumption, shorter pre-concentration time, and higher recoveries.
However, aggregation of the directly used graphene maybe inconvenient no matter in handing and clean-up. To overcome this shortcomings, Zhang et al.99 used
sulfonated graphene sheets in μ-SPE method for pre-concentrating PAHs in water samples. The introduction of a small amount of p-phenyl-SO3H groups eliminated the
aggregation and water-resistance of the graphene. Under the optimized conditions, good extraction performance can be observed by using sulfonated graphene sorbents, which showed superiority to C8 and C18 in differing sulfur content.
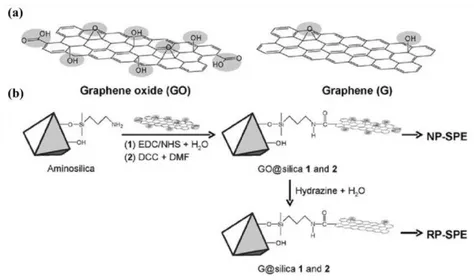
SPE sorbents related with graphene, such as graphene and GO bounded silica (G@silica and GO@silica) avoid not only aggregation but lose of sorbents from the SPE cartridge/column, especially under high pressure in online SPE systems. GO with much more polar moieties enjoys more hydrophilic character. Polar GO@silica therefore could be used for reversed-phase SPE of CPs while non-polar G@silica is more suitable for normal-phase SPE (Figure 1.6a). Liu et al.31 developed new SPE
39
them particularly suitable for handling biological samples for MALDI-TOF-MS analysis (Figure 1.6b).
Fig. 1.6. (a) Models of GO and graphene sheets. The shadowed sections indicate the polar groups in the GO and graphene sheets. (b) Chemical routes to the synthesis of GO@silica and G@silica. NP-SPE,
Normal-phase SPE; RP-SPE, Reversed-phase SPE; EDC,
(N-(3-dimethylaminopropyl)-N’-ethylcarbodiimide hydrochloride; NHS, N-hydroxysuccinimide, DCC
=N,N’-dicyclohexylcarbodiimide, DMF = dimethylformamide.92
It’s hard to retrieve from a suspension even with high-speed centrifugation since graphene is an ultralight material. Endowing graphene with magnetic properties can avoid the use of cartridges. Luo et al.73 prepared graphene-Fe3O4@SiO2 magnetic
composite for extraction of sulfonamide antibiotics from water samples. However, the composite formed by physical adsorption may not be stable enough to reuse. Zhao et
al.100 reported graphene-Fe3O4 composite by in situ co-precipitation of Fe2+ and Fe3+
in an alkaline solution in the presence of graphene. The results of the experiments showed that the sorbents could be reused over 12 times.
ii) Carbon nanotubes
(MWCNTs) are two kinds of available CNTs. SWCNTs with diameters between 1 and 10 nm are cylinders made of a single layer of graphene sheets102 while MWCNTs with larger size are concentric SWCNTs held together by van der Waals forces.103
Unique geometry structure, including high tensile strength, thermal conductivity and stability as well as high resilience, make concentrations to their good mechanical and thermal properties 104 CNTs are therefore have received more attention on the application in electronics, catalysis, biomedicine and analytical chemistry.105-106 It has been well established that the modification of their side walls can clearly enlarge their potential. In general, it’s possible for CNTs to be functionalized with non-covalent and covalent modification modes. Non-covalent modification as presented by
π-π-stacking interaction and other physical interaction. Contrasting to non-covalent modification, fluorination, 1,3-dipolar addition, nucleophilic addition, free-radical addition, etc. can be modified by covalent modifications modes. Nowadays, CNTs used as sorbents in SPE mainly based on their ability to establish π-π interaction and
van der Waals interactions with other molecules. Also, their large surface area,
especially on the outside, and interstitial spaces within nanotubes bundles make them as promising sorbents in SPE. The use of CNTs as sorbents in SPE has been discussed in many excellent reviews.103-104 Thus, in this part, interests mainly be focused on the typically innovations rather than providing a comprehensive collection of all the literatures.
41
for various target analytes, the oxidized and functionalized CNTs were used, in which the as-grown ones were oxidized (including hydroxyl, carboxyl, and carbonyl groups) and the oxidized ones were functionalized with various functional groups, respectively.
For extracting metal ions applications, Soylak and Unsal116 took advantage of double-walled CNTs to extract Co(II), Cu(II), Ni(II), Pb(II), Fe(Ш) and Mn(II) from environmental samples. The obtained pre-concentration factor was 100, and when applying to determine these ions in authentic water samples and a reference material, satisfactory results were also obtained.
Oxidized CNTs (ox-CNT) exhibited a better extraction performance than as-grown ones. For example, oxidized SWCNTs introduced by concentrated HNO3
were packed into a microcolumn as sorbents to pre-concentrate of trace Cu, Co and Pb in biological and water samples.117 In addition, oxidized MWCNTs was used as SPE sorbents to pre-concentrate trace Rh ion in aqueous solution.118 Initially, in the pH range of 3.2–4.7, Rh ions were mixed with 1-(2-pyridylazo)-2-naphthol (PAN) to form Rh-PAN complex, followed by adsorbing on the oxidized MWCNTs. The established method offered a higher enrichment factor and lower detection limit for rhodium ion compared with other sorbents. Moradi et al.119 compared the extraction
performance of Pb(II), Cd(II), and Cu(II) ions from aqueous solutions onto SWCNT and SWCNT-COOH, which showed SWCNT-COOH surfaces were more versatile than as-grown SWCNT ones. CNT, ox-CNT and l-alanine immobilized CNT (ana-CNT) were prepared by Savio et al.120 to pre-concentrate Ni and Pb in water
Pesticides in virgin olive oil samples were analyzed by using MWCNTs and carboxylated SWCNTs as sorbents.121 It showed that carboxylated SWCNTs achieved low detection limits between 1.5 and 3.0 μg/L, and a fast single pre-concentration-elution step in less than 8 min. Li et al.122 packed MWCNTs,
SWCNTs, ox-MWCNTs and ox-SWCNTs in SPE cartridges to extract six polar OPPs from aqueous sample. The oxidation CNTs showed enhanced adsorption abilities to the analytes. By packing MWCNT into mini-column system, Vinas et al.123 evaluated
the speciation of four cobalamins representing the various forms of vitamin B12. The developed method could offer a pre-concentration factor of 33 to the analytes, which provided an excellent alternative for the analysis of cobalamins at trace-level.
1.4.4. Silica NPs
It’s possible for SiO2 NPs to introduce chemical modifications due to their high
surface areas and intrinsic surface reactivity. Figure 1.7 shows the general strategies.
N-[3-(trimethoxysilyl)-propyl]ethylenediamine, for example, modified SiO2 NPs have
been reported for the pre-concentration of some toxic heavy metal ions such as Hg(II), Cu(II) and Zn(II).124-126 1-(2-pyridylazo)-2-naphthol modified SiO2 NPs (SiO2-PAN)
as sorbents of SPE have been developed for the pre-concentration of trace amounts of Cd(II) in different water samples.127 The adsorption capacity of SiO2-PAN was found
43
Fig. 1.7. Main strategies of functionalization/modification of silica NPs.
The application of thiol modified SiO2 NPs for the pre-concentration of drugs and
pesticides have also been investigated. Acetylsalicylic acid,
p-dimethylaminobenzaldehyde and 5-sulfonylsalicylic acid can be conjugated to SiO2
NPs.128 In terms of metal coating, SiO2@Au NPs have also been used for the
pre-concentration of neutral steroids (testosterone, progesterone, and testosterone propionate) in urine samples. The pre-concentration of the analytes was more efficient than in a commercial C18-bonded silica gel.129
Other applications come from the use of SiO2 NP derivatives. For example,
silica-coated magnetic NPs conjugated by γ-mercaptopropyltrimethoxysilane
45
CHAPTER II
2.1. Introduction
Early diagnosis is of great importance for reducing death rates since different forms of cancer (mainly lung-, prostate-, colon- and breast cancer), are now responsible for a quarter of all deaths among males and females throughout most of the world.2 Many different methods are currently available for cancer identification, such as computed tomography (CT)135, magnetic resonance imaging (MRI),135 positron emission tomography (PET),4 ultrasonography6 and endoscopy,5 which are collectively
“physical visualization/detection” methods for the presence of cancer rather than
focusing on the metabolites of the cancer. Metabolites which normally serve as potential biomarkers play a significant role in early detection and diagnosis of cancer because cancer is a disease which is known to alter cellular metabolism.8 Recently, an emerging approach for diagnosing cancer relies on volatile organic metabolites (VOMs), viz. organic metabolites with relatively high volatility, which can be detected in exhaled biological fluids (e.g. blood, sputum or urine), and/or exhaled
breath.9, 136-139 Many groups have been reported some VOMs which can be divided into four compound families, for example, alkanes (e.g. undecane),140 aldehydes (e.g.
hexanal, heptanal, decanal, and benzaldehyde),18, 140-142 ketones (e.g. 4-heptanone),18
and aromatic compounds (e.g. 5-methyl-2-furfural and phenol).18, 143 Thus,
considerable efforts have been made towards the development of various methods for cancer VOMs detection.
47
extraction process could be achieved on account of the affinity of VOMs existing in exhaled biological fluids to solid sorbent. The sorbent is therefore the core of the extraction process that determines the efficiency and the selectivity of the extraction.
Among all kinds of sorbents, nanomaterials are viewed as good candidates for extracting VOMs in exhaled biological fluids of cancer due to their high surface area and reactivity,145 presenting higher adsorption ability than their bulk counterparts.
Laponite ([Na0.7(Si8Mg5.5Li0.3)O20(OH)4]), a relatively uniform disc-shaped
synthetic clay having 25 nm in diameter and 1 nm thick,146 is often used as sorbent due to they (1) are relatively monodisperse, (2) have a controlled chemical composition, and (3) have a large surface available for adsorption.147 For example, the adsorption of cationic surfactant,148 poly(ethylene oxide),147 and polycyclic aromatic compounds149 on laponite were investigated. However, for VOMs, no report is available so far.
Metal oxide NPs are a class of promising sorbent in SPE, for example, as an important industrial material, TiO2 NPs have been widely used as sorbent to
adsorb alcohols, DNA Oligonucleotides, arsenic.150 In addition, SiO2 NPs also
have been selected as SPE sorbent due to their large specific surface area and high adsorption ability.151 But the extraction performance of VOMs on these two NMs have not been reported.
Nanohydroxyapatite (Ca10(PO4)6(OH)2, NHA) whose structure is hexagonal
has been widely used as a sorbent for the adsorption and separation of biomolecules (e.g. bovine serum albumin),153 and for removal of heavy metals
(e.g. Pb2+, Cd2+) from contaminated solid and water.154 In addition, the
adsorption of succinylated lysozyme,155 oxalic acid,156-157 nitrobenzene,158 and fluoride159 could be achieved by employing NHA. However, to our knowledge, the extraction of VOMs in the exhaled biological fluids, particularly in urine, of cancer patients by NHA has not been reported.
Usually, intensive centrifugation at high speed is inevitable when applying NMs as sorbents in SPE, which may lead to co-precipitation of undesirable interferents, such as non-volatile metabolites (hormones, uric acid, urea, among other with high molecular weight), and even loss of some target analytes, which, in large part, restricts the application of these advanced materials, for example, undesirable interferents cause noise of the equipment. A simple, rapid, gentle and efficient method is therefore urgently needed. In past decades, separation technology based on magnetic NMs (MNMs) has become a powerful complement to sorbent-based extraction of urinary VOMs.
MNMs have been widely applied in various research fields, including chemosensors,160 catalysis,161 drug delivery,162 MRI,163 and sample preparation.63, 160,
164-165 Although a number of magnetic materials are available now (
e.g., iron, cobalt,
nickel, magnetite, maghemite and alloys), Fe3O4 NPs are the most frequently used
MNMs in sample preparation due to their easy preparation, surface modification and good recoverability.166 Although bare Fe3O4 NPs can be directly used for isolation and
49
suitable coating and modification of the Fe3O4 NPs is needed to overcome the
limitations mentioned above. Normally, coating with silica is considered to improve the stability and prevent oxidation of the Fe3O4 NPs. Furthermore, the modification of
the silica-coated Fe3O4 NPs can be achieved by silanation using silane coupling
agents (e.g., C18).168 In this study, silica-coated Fe3O4 NPs functionalized by C18
(Fe3O4@SiO2-C18) NPs were successfully synthesized, though this sorbents have been
widely used as sorbent for the adsorption and separation of methylprednisolone (MP),75 lidocaine169 and puerarin170 from the complex matrix of rat plasma, and for removal of sudan dyes,171 pesticide residues,172 and polycyclic aromatic hydrocarbons (PAHs)173 from water samples, in addition, the adsorption of ergosterol from cigarette could be achieved by employing Fe3O4@SiO2-C18 NPs,174 to our knowledge, the
extraction of VOMs in the urine of cancer patients by Fe3O4@SiO2-C18 NPs has not
been reported.
Polypyrole (PPy), one of the most important conducting polymers, has been widely studied as SPE sorbents in many fields due to the formation of the π-π
complex and/or hydrophobic interactions between PPy and analytes.175-176 Considering the advantages of magnetic separation, Fe3O4@PPy NPs were
synthesized and characterized by IR and TEM.
There are several experimental variables affecting the extraction performance, such as sorbent amount, adsorption time, elution time, and types of elution solvent. Thus, designing and optimization of the experimental variables should be taken into consideration. In this work, Laponite, TiO2 NPs, SiO2 NPs, NHA and
Fe3O4@SiO2-C18 NPs were used, for the first time, with the help of GC-qMS, to
possibilities of these materials as an immobilization materials to extract VOMs from urine of cancer patients.
2.2. Experimental
2.2.1. Chemicals and Reagents
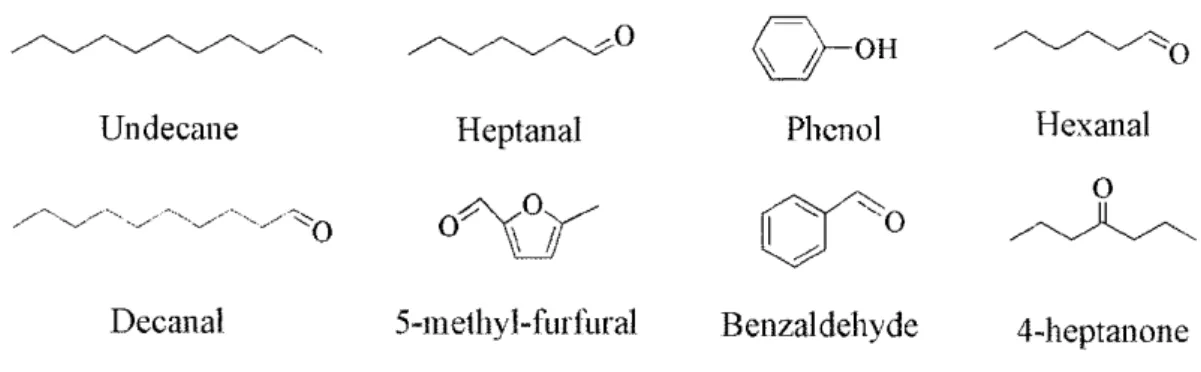
All the reagents used were of analytical regent grade and used without further purification. Nanohydroxyapatite was purchased from Aladdin Chemical Reagent Co, Ltd (Shanghai, China). Methanol (99.99%) or ethanol (99.99%) used as solvent in the whole experiment were purchased from Fisher Scientific (Loughborough, UK). Decanal (95%), hexanal (96%), heptanal (95%), undecane (99%), 5-methyl-2-furfural (98%), TiO2 NPs, SiO2 NPs, and laponite was obtained from Acros Organics (Geel,
Belgium) while benzaldehyde (99%), phenol (99%) and 4-heptanone (96%, purity) were from Sigma-Aldrich (Madrid, Spain). The chemical structures of VOMs investigated in this study are shown in Figure 2.1.
Fig. 2.1 Chemical structures of the volatile metabolites used in the experiment
FeCl3·6H2O, FeCl2·4H2O and ammonia, used for the synthesis of
Fe3O4@SiO2-C18 NPs and Fe3O4@PPy NPs, were purchased from Sigma-Aldrich.
Tetraethyl orthosilicate (TEOS) and ethanol were employed for covering the Fe3O4
NPs with a protective silica-based coating. Finally, n-octadecyltriethoxysilane (C18)
51
case of Fe3O4@PPy NPs, PPy monomers were used to cover the surface of Fe3O4 NPs
with the help of sodium dodecyl sulfate (SDS).178
2.2.2. Subjects and sample collection
Cancer patients (n=9, age=40.6 ± 7.4 years; non smokers) underwent different diagnostic procedures, such as breast physical examination, mammography and ultrasonography, MRI and chest X-ray and finally histologically diagnosed with primary cancer by the Haematology–Oncology Unit of the Dr. Nélio Mendonça Hospital. Each individual provided a sample of morning urine (after overnight fasting) in a 20 mL sterile PVC container. The samples were immediately frozen at −80°C and
kept until being processed.
All cancer patients gave their written informed consent for inclusion in the study and the research was approved by the Ethics Committee of the Dr. Nélio Mendonça Hospital, being done in accordance with the Good Clinical Practice guidelines and with the ethical guidelines of the 2013 Declaration of Helsinki (DoH).179 All data were analyzed anonymously throughout the study.
2.2.3. Synthesis of Fe
3O
4@SiO
2-C
18NPs and Fe
3O
4@PPy NPs
The procedures of the synthesis of Fe3O4@SiO2-C18 NPs were prepared according to
previously report by Alcudia-León et al (Figure 2.2).180 The Fe3O4 NPs was obtained
by co-precipitation method. Briefly, FeCl3·6H2O (0.09 mol, 24 g) and FeCl2·4H2O
(0.05 mol, 9.8 g) were dissolved in 100 mL of water under gentle nitrogen atmosphere, vigorously stirred and maintained at 80 °C in a water bath for 30 min. Then, 50 mL of ammonia (25 wt.%) were added dropwise. The Fe3O4 NPs were separated with an
external magnetic field, washed with water to remove the unreacted chemicals, and finally air dried.
Fe3O4 NPs in ethanol/water (50 mL/4 mL) solution in the presence of TEOS (2 mL)
under a nitrogen atmosphere. The dispersion was stirred overnight and the Fe3O4@SiO2 NPs were collected with an external magnetic field, thoroughly washed
with water and dried. Finally, the surface modification of the Fe3O4@SiO2 NPs was
achieved by dispersing in 50 mL of anhydrous toluene containing 1% (v/v) of n-octadecyltriethoxysilane (C18). The mixture was sonicated for 5 min and refluxed
for 12 h. The obtained resultant Fe3O4@SiO2-C18 NPs were washed several times with
ethanol and air dried.
Fig. 2.2. Schematic illustration of the preparation of Fe3O4@SiO2-C18 NPs.
In the case of the synthesis of Fe3O4@PPy NPs, 1.0 g (4.3×10⁻³ mol) of MNPs
(Fe3O4 NPs), 9.1 g (0.03 mol) of FeCl3·6H2O, and 100 mL of deionized water were
53
2.2.4. Characterization of Fe
3O
4@SiO
2-C
18NPs and Fe
3O
4@PPy NPs
The synthesized Fe3O4@SiO2-C18 NPs and Fe3O4@PPy NPs were characterized by
FT-IR spectroscopy and Transmission Electron Microscopy (TEM). IR spectra were obtained on a Thermo Nicolet Magna-IR 750 fourier transform infrared spectrometer (Waltham, MA). The samples for IR measurement were prepared by mixing the sample powder with KBr and then pressing the mixture into transparent disks.
Specimens for TEM were prepared by releasing a drop of Fe3O4@SiO2-C18 NPs
and Fe3O4@PPy NPs in methanol onto 400-mesh copper grids coated by ultrathin
carbon support films (Ted Pella; Redding, CA). Once the grids were dry, images were acquired using a Philips CM-12 microscope operating at an accelerating potential difference of 120 kV.
The Fe3O4@SiO2-C18 NPs show a spherical morphology with an average
diameter of 10 nm (Figure 2.3). The IR spectrum obtained under the attenuated total
reflection sampling mode shows a characteristic band of Fe3O4 around 600 cm-1
ascribed to the Fe-O bonds and a strong absorbing region at 1200-1000 cm-1 which are corresponded to the Si-O-H and Si-O-Si bonds. Furthermore, the C-H stretching vibrating bands of octadecyl groups of the Fe3O4@SiO2-C18 NPs can be observed at
2920 and 2850 cm-1 (Figure 2.4).
Fig. 2.4. IR spectrum of Fe3O4@SiO2-C18 NPs.
For the Fe3O4@PPy NPs, from the TEM graphic, they showed spherical
morphology with a mean size of about 15 nm (Figure 2.5). Figure 2.6 shows the IR
spectrum of Fe3O4@PPy NPs, the bands at 1455 and 1040 cm-1 can be assigned to the
C-N ring stretching vibrations of the pyrrole ring. In addition, the peak at 1166 and 886 cm-1 are related to the C-H vibrations.
55
Fig. 2.6. IR spectrum of Fe3O4@PPy NPs.
2.2.3. Preparation of stock and working solution
Individual stock solution of target volatile metabolites were prepared in a hydroalcoholic solution (12% v/v) with a concentration of 500 µg/L, aliquoted in 8
mL vials and stored at −20°C in the dark until use. Working solutions containing the
cancer biomarkers were prepared daily from the individual stock solutions by diluting them in the synthetic urine whose formula was described by Uppuluri et al.181 The
ranges of concentrations (see Table 2.1 and Table 2.2, pages 79 and 80) were
2.2.4. NMs-based Sorbent Extraction Procedure
Batch techniques were employed for investigating the extraction process of VOMs in working standard solution. Normally, extraction can be carried out simply by dispersing NMs in working standard solution followed by collecting the analyte-adsorbed NMs by centrifugation. Adsorptions were carried out by taking different amounts of sorbent in 8 mL vials containing 500 μL working
standard solution and 1 mL deionized water. The mixture solution was stirred with the help of magnetic stir at the constant temperature of 45 °C for 1 hour except where the effect of the contacting time was investigated. After each batch of the adsorption, the sorbent was separated from the solution and eluted
by 1.5 mL elution solvent. The eluate was collected and evaporated to 200 μL
under gentle stream of nitrogen before GC-qMS analysis (Figure 2.7). When
using Fe3O4@SiO2-C18 NPs as sorbents, ultrasounds (5 min) was selected for
an efficiently dispersion and the sorbents were collected by magnetic separation (Figure 2.8).
57
Fig. 2.8. Procedure for the extraction of VOMs by using Fe3O4@SiO2-C18 NPs.
2.2.5. Chromatographic and Mass Spectrometric Conditions
The chromatographic separation was performed on an Agilent Technologies 6890N Network gas chromatography system (Palo Alto, CA, USA). The carrier gas was He (Helium N60, Air Liquid, Portugal) with flow rate of 1.3 mL/min. The gas
chromatography was fitted with a 30 m × 0.32 mm I.D. × 0.25 μm film thickness,
Carbowax-20 (SGE, Dortmund, Germany) fused silica capillary column and interfaced with an Agilent 5975 quadrupole inert mass selective detector. The oven temperature was: 60 °C for 4 min, followed by an increase of 1.20 °C/min to 100 °C, held for 2 min. 10.0 °C/min to 220 °C staying for 5-min at this temperature, for a total GC run time of 56.33 min. The splitless mode was used and the injector temperature was 250 °C.
and MS source temperature were 150, 250, and 220 °C, respectively. Electron impact mass spectra were recorded at 70 eV ionization voltages and the ionization current
was 10 μA. 2 min was used as solvent delay. Data acquisition was performed in Scan mode (30-300 m/z). The electron multiplier was set to the auto tune procedure.
Identification of VOMs was accomplished through (i) manual interpretation of spectra
and matching with the Agilent MS ChemStation Software, coupled with a NIST05 mass spectral library with a similarity threshold higher than 80 %, and (ii) comparison
with commercially available standard samples when necessary.
2.2.6. Method validation
The NMs-based sorbent extraction approach to isolate urinary VOMs from cancer patients was validated for linearity, analytical limits including instrument LODs and method LOQs, intra- and inter-day precision, accuracy and matrix effect (ME).
Method linearity was evaluated by constructing a seven concentration levels calibration curve (peak area versus metabolite concentration), in triplicate, for each metabolite in synthetic urine, covering the concentration range of VOMs normally found in urine of cancer patients (Table 2.1 and Table 2.2). The sensitivity was
assessed determining the LOD (the lowest metabolite concentration that produces a response detectable above the noise level of the system) and LOQ (the lowest level of metabolite that can be accurately and precisely measured) for each metabolite. LOD and LOQ were calculated with the data generated by linear regression results as follows: LOD=a+3Sa/b and LOQ=a+10Sa/b, where “a” represents origin ordinate, “Sa”
the origin ordinate variance and “b” the slope.182
The precision of the method (expressed as %RSD) was evaluated using synthetic
59
precision). The inter-day precision was based on the analysis of three successive replicates five different days (n=15).
The accuracy of the method was evaluated through a recovery study, using synthetic urine spiked with 10 μg/L of each VOM, and subjected to NHA-based sorbent extraction approach described in Section 2.4. The recovery values were calculated according to: % Accuracy = 100 × ([metabolite]after spiking - [metabolite]before
spiking)/[ metabolite]added); where [metabolite]after spiking is the metabolite concentration
measured in spiked synthetic urine; [metabolite]before spiking is the metabolite
concentration measured in the same unspiked urine, and [metabolite]added is the
nominal volatile metabolite concentration added to synthetic urine. The targeted VOMs concentration in urine samples was previously determined using NHA-based sorbent extraction approach. The ME was estimated through the ratio between the slopes of the calibration curves obtained from synthetic urine-matched standard solution and those obtained by matrix matched calibration according to the following equation: %ME=bMMC-bSUMSS/bSUMSS; where: bMMC is the slope of matrix-matched
calibration, and bSUMSS is the slope of synthetic urine-matched calibration standard
2.3. Results and Discussion
Laponite, SiO2, and TiO2 didn’t give any peaks when applying these materials as
sorbents in SPE. For the case of Laponite, the blockage of internal cavity caused by swell when meeting aqueous solutions probably make contribution to the poor extraction performance. For SiO2 and TiO2, lack of surface modification by functional
groups, such as carbonaceous and thiol compounds, may be a main reason for the absence of peaks.
2.3.1 Optimization of NMs-based sorbent extraction approach
NHA possesses a rod-like morphology according to our previous report.183 The target compounds in this experiment are widely detected under the optimum conditions by using GC-qMS analysis. The total ion chromatogram is shown in Figure 2.9.
Compounds were identified from their molecular fragmentation and quantified from the peak area of their major fragment ions. All the chemical standards were separately identified.
Fig. 2.9. Total ion chromatogram of fortified synthetic urine by NHA/GC-qMS under optimum