Article
Printed in Brazil - ©2016 Sociedade Brasileira de Química0103 - 5053 $6.00+0.00
*e-mail: [email protected]
Simultaneous Determination of Rare Earth Elements by ICP OES After On-Line Enrichment
Using Multi-Walled Carbon Nanotubes Coated Cellulose Acetate Membrane
Ehsan Zolfonoun* and Seyed Reza Yousefi
NFCRS, Nuclear Science and Technology Research Institute, P.O. Box 11365-8486, Tehran, Iran
This study investigates application of multi-walled carbon nanotubes coated cellulose acetate membrane for on-line extraction and preconcentration of some rare earth elements (Y, La, Ce, Nd, Sm, Gd and Dy) prior to their determination by inductively coupled plasma optical emission spectrometry. Sample solutions containing rare earth elements (pH: 6.0) and l-(2-pyridylazo) 2-naphtol (4.0 × 10⁻⁵ mol L-1) were passed through the membrane (flow rate: 5.0 mL min-1). The
adsorbed cations were subsequently eluted from the membrane and transferred into the plasma with nitric acid solution (flow rate: 3.0 mL min-1) for simultaneous determination of them. The effect of
different experimental parameters on the performance of the method were studied and discussed. Under the optimized conditions and preconcentration of 25 mL of sample, the enrichment factors of 185-201 and the detection limits of 0.05-0.3 µg L-1 were obtained.
Keywords: rare earth elements, preconcentration, on-linesolid phase extraction, cellulose acetate membrane, multi-walled carbon nanotube, ICP OES
Introduction
Rare earth elements (REEs) are an extremely coherent group of elements and their accurate determination is very important in chemistry research. The REEs have many scientific and industrial uses. Their compounds are used as catalysts in the production of petroleum and synthetic products. REEs are used in lamps, lasers, magnets, phosphors, motion picture projectors, and X-ray intensifying screens.
There have been many analytical techniques used for the determination of REEs in solid and solution samples; neutron activation analysis (NAA),1,2 inductively coupled
plasma-optical emission spectrometry (ICP OES),3,4
isotope dilution mass spectrometry5,6 and inductively
coupled plasma-mass spectrometry (ICP-MS)7-9 are the
most popular ones.
ICP OES is one of the most powerful and popular analytical tools for the determination of elements in a variety of different sample matrices.10 However, the direct
determination of REEs at low concentrations by ICP OES is difficult because of insufficient sensitivity of this technique as well as the matrix interferences occurring in real samples, and an initial sample pretreatment, such as preconcentration of the analyte, is often necessary.4
Various separation and preconcentration techniques are often employed prior to analysis to enlarge the sensitivity of determination methods. Among these preconcentration techniques, solid phase extraction (SPE) is a widely used technique for the extraction and concentration of analytes from liquid samples to achieve increased sensitivity in the analytical process.11,12 Compared with
traditional technologies, SPE offers several advantages such as simplicity, high enrichment factor and less solvent consumption. The SPE technique not only can be performed in the off-line mode, but also provides the possibility of on-line coupling to analytical instruments. It enables partial or total automation of the analytical process, reduces analysis time, decreases analyte loss, increases sensitivity, and improves accuracy and precision.13
serving as good sorbents. The π-π electrostatic interaction
with the analytes and the large surface area of MWCNTs facilitated the adsorption of analytes.14-16 Carbon nanotubes
(CNTs) opened a new investigation area in the development of alternative coating materials for SPE, since their special properties make them very attractive to improve the performance of this technique.17,18 Compared with
traditional SPE sorbents, MWCNTs offer a significantly higher surface area-to-volume ratio and a short diffusion route, resulting in high extraction capacity, low extraction time and high extraction efficiencies.19
1-(2-Pyridylazo)-2-naphthol (PAN) is a complexometric indicator and spectrophotometric reagent for determination of transition metal ions. It has been also used as a chelating agent for the SPE separation and preconcentration of trace metals in various media.20,21 In previous studies, PAN has
been successfully employed for solid phase extraction of REEs with different adsorbents, such as octadecyl functional groups bonded on silica gel and ion-pair microparticles.4,22
This work describes a simple, efficient and relatively inexpensive on-line method for the determination of some rare-earth elements (Y, La, Ce, Nd, Sm, Gd and Dy) in aqueous samples using ICP OES after preconcentration using carbon nanotube coated cellulose acetate membrane.
Experimental
Reagents and solutions
All reagents used were of analytical grade and were used as supplied. MWCNTs (purity > 95%) were obtained from Sigma-Aldrich. All working standard solutions were prepared from high purity ICP 1000 mg L-1 stock standard
solutions. A solution of 1.0 × 10⁻² mol L−1 l-(2-pyridylazo)
2-naphtol (PAN) (Merck) was prepared by dissolving appropriate amounts of this reagent in ethanol (Merck). A buffer solution (pH 6.0) was prepared by dissolving appropriate amounts of ammonium acetate in double-distilled deionized water.
Instrumentation
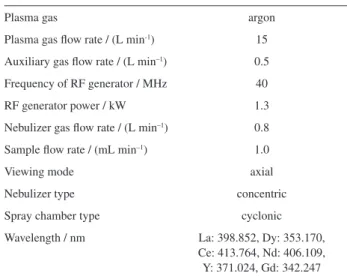
All the measurements were carried out using a PerkinElmer (Optima 7300 DV) simultaneous ICP OES coupled to a concentric nebulizer and equipped with a charge coupled device (CCD) detector. Operational conditions were optimized and summarized in Table 1.
The three channel peristaltic pump, commercially installed on the ICP OES instrument, allows the sample, buffer solution and the waste to be simultaneously pumped.
To enable on-line addition of the buffer solution to the sample, a T-piece was used to combine the sample and buffer solutions flows prior to the membrane (Scheme 1). A Metrohm model 744 digital pH meter, equipped with a combined glass-calomel electrode, was employed for the pH adjustments.
SPE procedure
MWCNT-coated membrane was fabricated in the laboratory from MWCNTs dispersed in water. An accurately weighted amount of 5 mg of MWCNTs were dispersed into 100 mL deionized water and passed through a cellulose acetate syringe membrane (pore size 0.45 µm, diameter 17 mm) while ultrasonicated in a ultrasonic bath. The obtained residue was then washed with water.
Table 1. Operating parameters for ICP OES
Plasma gas argon
Plasma gas flow rate / (L min-1) 15
Auxiliary gas flow rate / (L min–1) 0.5
Frequency of RF generator / MHz 40
RF generator power / kW 1.3
Nebulizer gas flow rate / (L min–1) 0.8
Sample flow rate / (mL min–1) 1.0
Viewing mode axial
Nebulizer type concentric
Spray chamber type cyclonic
Wavelength / nm La: 398.852, Dy: 353.170, Ce: 413.764, Nd: 406.109, Y: 371.024, Gd: 342.247
The system settled up for the on-line SPE is shown in Scheme 1. In order to minimize dilution of the sample, pump tubes of 0.25 and 0.75 mm ID were used for the buffer solution and sample solution lines, respectively. Since volume (and hence flow rate) vary as the square of the radius, this would result only in 10% dilution of the sample. Aliquot of 25 mL of the sample or standard solution containing REEs and PAN was pumped through line 1 via a three-way valve. Buffer solution was added into the line 1 through line 2 with the aid of a T-connector. After closing the on-off valve, sample line was washed with 5 mL deionized water for the removal of the matrix components before elution. Finally, the preconcentrated target analyte was eluted by switching the three-way valve to feed the eluent solution. The eluent was directly introduced into the ICP OES nebulizer and the emission intensity of each analyte was measured against the time. The results were expressed as the height of emission peak and corrected against the blank solution and were proportioned to the concentration of the elements. After each extraction and elution step, the MWCNT-coated membrane was washed with ethanol and then with distilled water for subsequent experiment.
Results and Discussion
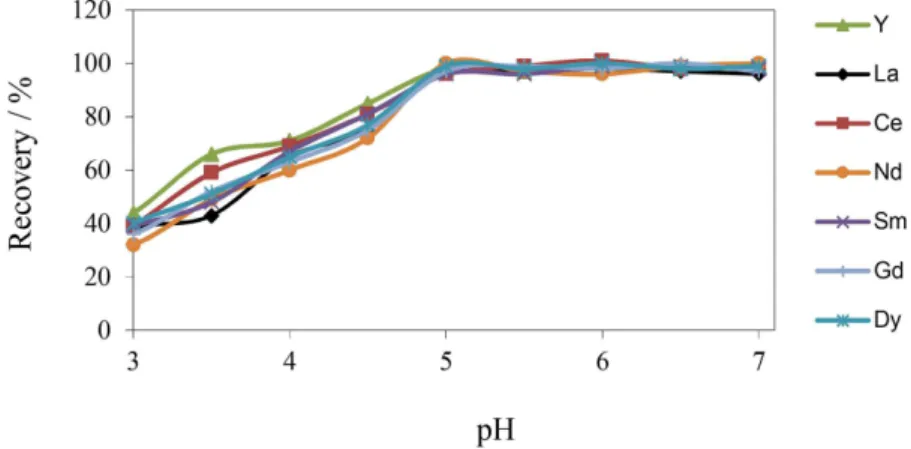
Effect of pH
The formation of metal chelate and its chemical stability are the two important factors for the extraction of metal ions, and the pH plays a unique role on metal chelate formation and subsequent extraction. The effect of pH on the extraction efficiency was studied in the range of 3.0-7.0 using nitric acid or ammonium acetate (Figure 1). The results showed that the extraction efficiencies were nearly constant in the pH range of 5.5-7.0. So, pH 6.0 was chosen as the optimum value.
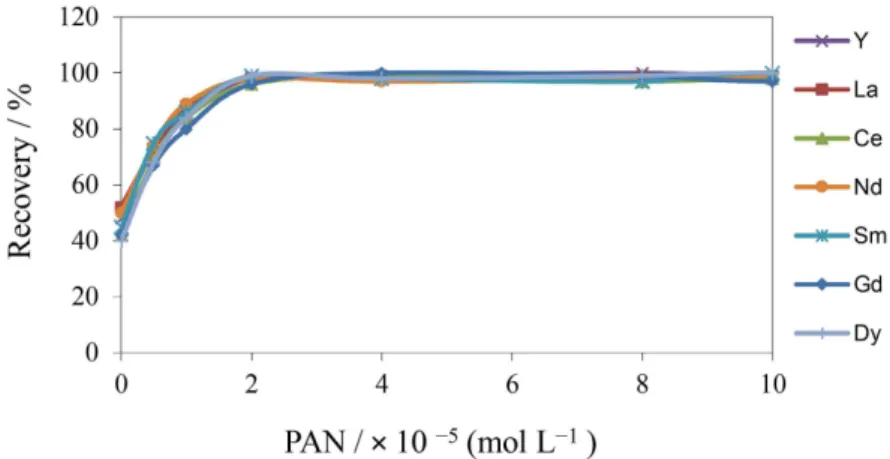
Effect of chelating reagent concentration
The effect of PAN concentration was investigated in the range of 0-1 × 10⁻⁴ mol L-1, and the results are shown
in Figure 2. The results showed that the extraction of REEs increased with increasing the PAN concentration up to 2 × 10⁻⁵ mol L-1 and then remained nearly constant.
So, 4.0 × 10⁻⁵ mol L-1 PAN was chosen as optimum value.
Effect of eluent type and flow rate
In order to find the best eluent, different eluting solutions, such as HCl, H2SO4, HNO3 and acetic acid,
were tested. Obtained results showed that among the tested eluents, HNO3 was found to be the superior solvent in
comparison with other solvents for desorption of analytes. Therefore, HNO3 solution was selected and used as an
eluent. The effect of HNO3 concentration on the recovery
of the adsorbed analytes was examined in the range of 0.1 to 4 mol L−1 (Figure 3). Based on the obtained results,
2.0 mol L−1 HNO
3 was sufficient for complete elution of
the adsorbed cations on the sorbent surface. The effect of eluent flow rates on the emission intensities of the cations were examined in the range of 1.0-5.0 mL min-1 and the
flow rate of 3.0 mL min-1 was selected as the best flow rate
for the eluent.
Effect of sample flow rate
The effect of sample flow rate on the emission intensities was studied. It was found that, in the range of 1-5.0 mL min-1, the retention of REEs on the membrane
is not affected by the sample solution flow rate and the sorption kinetic of the analyte complexes on the sorbent was fast. Consequently, for reduction of total analysis time, sample flow rate of 5.0 mL min-1 was selected as the
optimum sample flow rate.
Effect of sample volume
Sample volume is one of the most important parameters in development of preconcentration method, since it determines the sensitivity enhancement of the technique. Therefore, the effect of the sample volume on the extraction of Y, La, Ce, Nd, Sm, Gd and Dy was investigated. For this purpose, different volumes (10-200 mL) of sample solutions containing 10 µg L−1
of each cation were passed through the membrane and the results are depicted in Figure 4. The results showed
that, in the case of Y, La and Sm up to 200 mL, and in the cases of Ce, Nd, Gd and Dy up to 150 mL, extraction by membrane was quantitative.
Sorption capacity
The maximum capacity of the sorbent for each cation was determined by passing 25 mL portions of an aqueous solution containing 20 mg L–1 cation through the membrane,
followed by determination of the retained metal ions using ICP OES. The maximum capacity of the sorbent for Y, La,
Figure 2. Effect of chelating reagent concentration on the recovery of REEs. Conditions: pH, 6.0, concentration of analytes, 50 µg L–1.
Figure 3. Effect of HNO3 concentration on the recovery of REEs. Conditions: pH, 6.0, PAN, 4.0 × 10⁻⁵ mol L−1; concentration of analytes, 50 µg L–1.
Ce, Nd, Sm, Gd and Dy was found to be 33, 28, 23, 35, 41, 37 and 31 mg g–1, respectively.
Effect of diverse ions on the recovery
The effect of commonly occurring ions in natural water samples have been studied on the preconcentration and determination of REEs. In these experiments, 50 mL of sample solutions containing 10.0 µg L−1 of target ions and
potentially interfering ions in different interference-to-analyte ratios were subjected to the extraction procedure. Tolerable limit was defined as the highest amount of foreign ions that produced an error not exceeding ± 5% in the determination of REEs (Table 2). The obtained results showed that under the conditions specified in the procedure, the major ions in the water samples had no obvious influence on the recovery of the target ions.
Analytical figures of merit
Table 3 shows analytical features of the method. The limits of detection (LOD) were calculated according to three times the standard deviation of the blank signals. The enrichment factors were calculated as the ratio of the calibration slope of the method and calibration slope of direct aspiration of standard solutions.
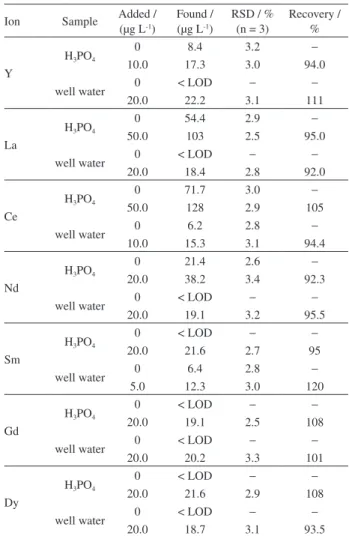
Application
In order to demonstrate the applicability of the method, well water and industrial H3PO4 samples were analyzed
according to the method and the results obtained were summarized in Table 4. Aliquots of 25 mL of each sample were used for extraction of REEs under optimal conditions of the method. The results demonstrated that the proposed method was suitable for the determination of REEs in real samples.
Comparison with other methods
A comparison of the proposed method with other reported SPE methods for determination of REEs is given
in Table 5. As can be seen, the proposed method has low detection limits, high enrichment factors, and good relative standard deviation (RSD) values and these characteristics are comparable or even better than most of the other methods listed in Table 5. The traditional SPE methods are usually time consuming and require high sample volume to achieve an acceptable enrichment factor. In comparison
Table 2. Tolerance limits of some cations and anions on the determination of REEs
Ion Tolerance limit / (mg L−1)
Li+, Na+, K+, Cl-, NO
3- 1000
Ca2+, Mg2+, Ba2+, Sr2+ 500
Ag+, Hg2+, SO
4- 20
Fe3+, Pb2+, Al3+, Mn2+, Cd2+, Zn2+ 5
Cu2+, Ni2+, Co2+ 1
Table 3. Analytical parameters of the proposed method
Element LOD / (µg L-1) r
2 RSD / % Linear range /
(µg L-1)
Enhancement factor
Y 0.06 0.9963 2.7 0.2-100 190
La 0.05 0.9954 2.9 0.2-100 195
Ce 0.3 0.9976 3.0 0.8-100 191
Nd 0.3 0.9955 2.8 1.0-100 188
Sm 0.2 0.9949 2.6 0.5-100 201
Gd 0.1 0.9980 2.8 0.5-100 100
Dy 0.1 0.9937 2.8 0.5-100 185
LOD: Limit of detection; r2: coefficient of determination; RSD: relative
standard deviation.
Table 4. Analytical results for determination of REEs in real samples
Ion Sample Added / (µg L-1)
Found / (µg L-1)
RSD / % (n = 3)
Recovery / %
Y
H3PO4
0 8.4 3.2 −
10.0 17.3 3.0 94.0
well water 0 < LOD − −
20.0 22.2 3.1 111
La
H3PO4
0 54.4 2.9 −
50.0 103 2.5 95.0
well water 0 < LOD − −
20.0 18.4 2.8 92.0
Ce
H3PO4
0 71.7 3.0 −
50.0 128 2.9 105
well water 0 6.2 2.8 −
10.0 15.3 3.1 94.4
Nd
H3PO4
0 21.4 2.6 −
20.0 38.2 3.4 92.3
well water 0 < LOD − −
20.0 19.1 3.2 95.5
Sm
H3PO4
0 < LOD − −
20.0 21.6 2.7 95
well water 0 6.4 2.8 −
5.0 12.3 3.0 120
Gd
H3PO4
0 < LOD − −
20.0 19.1 2.5 108
well water 0 < LOD − −
20.0 20.2 3.3 101
Dy
H3PO4
0 < LOD − −
20.0 21.6 2.9 108
well water 0 < LOD − −
with other preconcentration techniques, the proposed method has low sample consumption and short extraction process.
Conclusions
A novel on-line solid phase extraction method based on MWCNTs coated cellulose acetate membrane was developed for the extraction and preconcentration of REEs, prior to simultaneous ICP OES determination. This method is fast, simple and inexpensive. The proposed preconcentration and determination method gives a high enhancement factor and low limit of detection. The results indicated that this method is a suitable technique for preconcentration and determination of REEs in real samples.
Acknowledgments
The authors gratefully acknowledge the support of Nuclear Science and Technology Research Institute for this research project.
References
1. Randle, K.; Al-Jundi, J.; J. Radioanal. Nucl. Chem. 2001, 249, 361.
2. Ravisankar, R.; Manikandan, E.; Dheenathayalu, M.; Rao, B.; Seshadreesan, N. P.; Nair, K. G. M.; Nucl. Instr. Meth. Phys. Res. B 2006, 251, 496.
3. Gok, C.; Seyhan, S.; Merdivan, M.; Yurdakoc, M.; Microchim. Acta 2007, 157, 13.
4. Yousefi, S. R.; Zolfonoun, E.; Pourjavid, M. R.; Ahmadi, S. J.; Anal. Methods 2014, 6, 3694.
5. Greaves, M. J.; Elderfield, H.; Klinkhammer, G. P.; Anal. Chim. Acta 1989, 218, 265.
6. Shaw, T. J.; Duncan, T.; Schnetger, B.; Anal. Chem. 2003, 75, 3396.
7. Hirata, S.; Kajiya, T.; Aihara, M.; Honda, K.; Shikino, O.; Talanta 2002, 58, 1185.
8. Inagaki, K.; Haraguchi, H.; Analyst 2000, 125, 191.
9. Pedreira, W. R.; Sarkis, J. E. S.; Rodriguez, C.; Tomiyoshi, I. A.; da Silva Queiroz, C. A.; Abrão, A.; J. Alloys Compd. 2002, 344, 17.
10. Dean, J. R.; Practical Inductively Coupled Plasma Spectroscopy; Wiley: Chichester, UK, 2005.
11. Qi, F.; Li, X.; Yang, B.; Rong, F.; Xu, Q.; Talanta 2015, 144, 129.
12. Baytak, S.; Arslan, Z.; Clean: Soil, Air, Water 2015, 43, 822. 13. Oguma, K.; Suzuki, T.; Saito, K.; Talanta 2011, 84, 1209. 14. Valcarcel, M.; Cardenas, S.; Simonet, B. M.; Moliner-Martínez,
Y.; Lucena, R.; TrAC, Trends Anal. Chem. 2008, 27, 34. 15. Hussain, C.; Mitra, S.; Anal. Bioanal. Chem. 2011, 399, 75. 16. Zhang, B. T.; Zheng, X.; Li, H. F.; Lin, J. M.; Anal. Chim. Acta
2013, 784, 1.
17. Pardasani, D.; Kanaujia, P. K.; Purohit, A. K.; Shrivastava, A. R.; Dubey, D. K.; Talanta 2011, 86, 248.
18. Stanisz, E.; Krawczyk, M.; Matusiewicz, H.; J. Anal. At. Spectrom. 2014, 29, 2388.
19. Zolfonoun, E.; Yousefi, S. R.; Radiochim. Acta 2015, 103, 835. 20. Islam, A.; Laskar, M. A.; Ahmad, A.; Environ. Monit. Assess.
2011, 175, 201.
21. Tokalıoğlu, Ş.; Büyükbaş, H.; Kartal, Ş.; J. Braz. Chem. Soc.
2006, 17, 98.
22. Bahramifar, N.; Yamini, Y.; Anal. Chim. Acta 2005,540, 325. 23. Jain, V. K.; Pandya, R. A.; Pillai, S. G.; Agrawal, Y. K.; Kanaiya,
P. H.; J. Anal. Chem. 2007, 62, 104.
Submitted: March 1, 2016
Published online: April 28, 2016
Table 5. Comparative data from some reported SPE methods for determination of REEs
Analytes Sorbent Detection technique Enrichment factor Detection limit /
(µg L–1) RSD / % Reference
La, Ce, Y modified Amberlite XAD-16 resin
spectrophotometry 125, 83, 100 830, 250, 660 < 2.3 3
La, Ce polymer-supported calix arene resin
spectrophotometry 153, 133 3.05, 6.86 < 1.7 23
Ce, Dy, La, Sm, Y C18-modified
column
ICP OES 328, 275, 337, 324, 372
0.04, 0.01, 0.01, 0.02, 0.01
< 5.3 22
La, Ce, Nd, Sm, Gd, Dy
ion-pair microparticles
ICP OES 97, 91, 90, 92, 100, 92
0.1, 0.5, 1.0, 0.5, 0.3, 0.1
< 3.6 4
Y, La, Ce, Nd, Sm, Gd, Dy
MWCNT-coated membrane
ICP OES 190, 195, 191, 188, 201, 100, 185
0.06, 0.05, 0.3, 0.3, 0.2, 0.1, 0.1