a v a i l a b l e a t w w w . s c i e n c e d i r e c t . c o m
j o u r n a l h o m e p a g e : w w w . e l s e v i e r . c o m / l o c a t e / a c a
Development of a dynamic headspace solid-phase
microextraction procedure coupled to GC–qMSD for
evaluation the chemical profile in alcoholic beverages
F. Rodrigues, M. Caldeira, J.S. C ˆamara
∗Centro de Qu´ımica da Madeira, Departamento de Qu´ımica, Universidade da Madeira, Campus Universit ´ario da Penteada, 9000-390 Funchal, Portugal
a r t i c l e
i n f o
Article history:
Received 7 September 2007 Received in revised form 19 December 2007
Accepted 27 December 2007 Published on line 8 January 2008
Keywords:
Volatile and semi-volatile compounds
Headspace solid-phase microextraction White wine Beer Whisky GC–qMSD
a b s t r a c t
In the present study, a simple and sensitive methodology based on dynamic headspace solid-phase microextraction (HS-SPME) followed by thermal desorption gas chromatography with quadrupole mass detection (GC–qMSD), was developed and optimized for the determination of volatile (VOCs) and semi-volatile (SVOCs) compounds from different alcoholic beverages: wine, beer and whisky. Key experimental factors influencing the equilibrium of the VOCs and SVOCs between the sample and the SPME fibre, as the type of fibre coating, extraction time and temperature, sample stirring and ionic strength, were optimized. The performance of five commercially available SPME fibres was evaluated and compared, namely
polydimethyl-siloxane (PDMS, 100m); polyacrylate (PA, 85m); polydimethylsiloxane/divinylbenzene
(PDMS/DVB, 65m); carboxenTM/polydimethylsiloxane (CAR/PDMS, 75m) and the
divinyl-benzene/carboxen on polydimethylsiloxane (DVB/CAR/PDMS, 50/30m) (StableFlex).
An objective comparison among different alcoholic beverages has been established in terms of qualitative and semi-quantitative differences on volatile and semi-volatile com-pounds. These compounds belong to several chemical families, including higher alcohols, ethyl esters, fatty acids, higher alcohol acetates, isoamyl esters, carbonyl compounds, furanic compounds, terpenoids, C13-norisoprenoids and volatile phenols. The optimized extraction conditions and GC–qMSD, lead to the successful identification of 44 compounds in white wines, 64 in beers and 104 in whiskys. Some of these compounds were found in all of the examined beverage samples.
The main components of the HS-SPME found in white wines were ethyl octanoate (46.9%), ethyl decanoate (30.3%), ethyl 9-decenoate (10.7%), ethyl hexanoate (3.1%), and isoamyl octanoate (2.7%). As for beers, the major compounds were isoamyl alcohol (11.5%), ethyl octanoate (9.1%), isoamyl acetate (8.2%), 2-ethyl-1-hexanol (5.9%), and octanoic acid (5.5%). Ethyl decanoate (58.0%), ethyl octanoate (15.1%), ethyl dodecanoate (13.9%) followed by 3-methyl-1-butanol (1.8%) and isoamyl acetate (1.4%) were found to be the major VOCs in whisky samples.
© 2008 Elsevier B.V. All rights reserved.
∗Corresponding author. Tel.: +351 291705112; fax: +351 291705149.
E-mail address:[email protected](J.S. C ˆamara).
1.
Introduction
Alcoholic beverages are highly complex mixtures of com-pounds, which largely define its appearance, aroma, flavour and mouth-feel properties. Being a combination of taste and olfaction properties, these characteristics are the most important parameters responsible for the beverages char-acter, quality and hence for consumer acceptance. Their volatile fraction can be composed by over than 800
differ-ent compounds [1,2] but only several tens of which can
be odour-active[3] and must be considered for
differentia-tion purposes. These compounds belong to several chemical classes, including higher alcohols, ethyl esters, fatty acids, higer alcohol acetates, isoamyl esters, carbonyl compounds, sulphur compounds, furanic compounds, monoterpenols,
C13-norisoprenoids and volatile phenols. They present
dif-ferent polarities, volatilities, and moreover, are found in a
wide range of concentrations from ng L−1to mg L−1. They are
produced through metabolic pathways during ripening, har-vest, post-harvest and storage or ageing stages. In contrast to some wines and whisky, beer aging is usually considered negative to flavour quality. Many of these compounds are common to different alcoholic beverages but differ analyti-cally in terms of relative amount. The different substances may influence their aroma and flavour both individually and in a synergistic or antagonistic sense. Some VOCs are of great importance and may contribute greatly to the alco-holic beverage flavour, while others are important merely in building up the background flavour of the product. The qualitative and quantitative study of beverages is an impor-tant database for ensuring process continuity and product
authenticity[4].
The main higher alcohols (also known as fusel alcohols)
found in alcoholic beverages are the aliphatic alcohols, n
-propanol, 2-methylpropan-1-ol, 3-methylbutan-1-ol and the
aromatic alcohols-phenylethanol and benzyl alcohol. These
compounds might have both positive and negative impacts on aroma and flavour. Excessive concentrations of higher
alcohols (>300 mg L−1) can result in a strong, pungent smell
and taste, whereas optimal levels impart fruity characters. Hexan-1-ol, for example, is usually a minor constituent, but its herbaceous and greasy odours have been related to delete-rious effects in beverages, although consumers can appreciate
a small herbaceous perception in white wines[5].
Other important compounds of beverages aroma are the fatty acids. The shorter chain fatty acids, such as acetic (the most important, quantitatively), propanoic, butanoic and lactic, are by-products of fermentation. Relatively few fatty acids in alcoholic beverages are volatile enough to contribute to its flavour. Odorous acids are, for example, acetic acid (vinegar-like character), propanoic acid (goaty) and butanoic acid (spoiled butter). Fatty acids are mainly formed during fer-mentation process at an earlier stage than the respective ethyl
esters[6]. The straight-chain C8–C10 acids are intermediates
in the formation of C16 and C18 acids (structural components of cell membranes).
Other compounds that can be sensory important are the ethyl esters (fruity flavours). The ethyl esters of straight-chain fatty acids and acetates of higher alcohols are the
domi-nating esters in wine, beer and whisky. Are products of an enzyme catalysed condensation reaction between acyl-CoA
and a higher alcohol [7]. Basically, two factors are
impor-tant for the rate of ester formation: the concentration of the two substrates, acyl-CoA and fusel alcohol, and the total activity of the enzymes involved in the formation and break-down of the respective ester. Qualitatively, the most significant esters are ethyl acetate (fruity, solvent-like), isoamyl acetate (banana, pear-drops aromas), isobutyl acetate (banana, fruity aroma), ethyl hexanoate (green apple aroma), ethyl octanoate (fruity, soap aroma), ethyl decanoate (floral, soap aroma) and 2-phenylethyl acetate (honey, fruity, flowery aromas). The shorter chain fatty acids ethyl esters contribute more to alco-holic beverage aroma than the less volatile longer chain esters
[8]. The presence of different esters can have a synergistic
effect on the individual flavours, which means that esters can also affect wine, beer and whisky flavour well below their
indi-vidual threshold concentrations[9]. Moreover, the fact that
most esters are present in concentrations around the thresh-old value implies that minor changes in concentration may have dramatic effects on beverage flavour.
The analysis of VOCs and SVOCs that contribute to alcoholic beverages (beer, wine and whisky) aroma, has been carried out following different
methodolo-gies, such as, liquid–liquid extraction [10] simultaneous
distillation–extraction (SDE)[11], supercritical fluid extraction
(SFE) [12], solid-phase extraction (SPE)[13] and ultrasound
extraction[14]. Most of these techniques have several
dis-advantages, including extensive equipment requirements, significant quantities of expensive and environmentally unfriendly solvents, multiple handling steps that increase error, and a need for concentration of the target analytes to achieve detectable levels. Nowadays, they are easier and more selective alternatives to these classical methods, which may overcome their disadvantages, such as solid-phase
microex-traction (SPME), developed by Lord and Pawliszyn[15,16]and
more recently stir bar sorptive extraction (SBSE) developed
in the late 1990s by Baltussen et al.[17]. This technique uses
a TwisterTM, a glass stir bar onto which is bonded a sorptive
phase, often polydimethylsiloxane (PDMS), in quantities far
in excess of those found on SPME fibres[18]. These methods
show clear advantages compared with traditional techniques: (i) eliminates the use of (toxic) organic solvents; (ii) allows the quantification of a large number of molecules with low limits of detection and good linearity over a considerable dynamic range; (iii) integrates sampling, extraction and concentration into a single step; (iv) requires no or little manipulation/preparation of sample; (v) substantially short-ness the time of analysis; and moreover (vi) are simple and faster techniques, and (vii) covers a wide range of sampling
techniques, including field,in situand air sampling. Generally
accepted disadvantages are relatively lot-to-lot variations, sensitivity against organic solvents and the limited range of commercially available stationary phases.
Since the first SPME fibres became commercially available, it has been more and more used and the fields of applica-tion have been continuously growing, including a wide range of food analysis, namely the volatile composition of wines [18–22], beers[23,24], whiskys [25–27] and several kinds of
[33,34] and pharmaceutical analysis [35,36], with nowadays about 3000 research papers published.
In this study, a fast and sensitive method based on man-ual dynamic headspace SPME sampling coupled with gas chromatography–quadrupole mass spectrometry detection (HS-SPME–GC–qMSD) was developed for the qualitative and semi-quantitative analysis of the volatile composition of alcoholic beverages and the main experimental factors which influence the extraction efficiency were optimized. Five
commercially available SPME fibres: 100m
polydimethyl-siloxane, PDMS, apolar; 85m polyacrylate, PA, polar;
65m polydimethylsiloxane/divinylbenzene, PDMS/DVB;
75m carboxenTM/polydimethylsiloxane, CAR/PDMS and
50/30m divinylbenzene/carboxen on polydimethylsiloxane,
DVB/CAR/PDMS (StableFlex) polar, were tested and their performance compared. Finally, the developed and optimized methodology was successfully used to isolate and iden-tify the main constituents of the volatile fraction of some commercial alcoholic beverages—beers, white wines and whiskys.
2.
Experimental
2.1. Chemicals and materials
All used reagents were analytical quality and all solvents were HPLC grade. Sodium chloride (99.5%), was used to obtain the adequate ionic strength, was supplied by Merck (Darmstadt,
Germany). Absolute ethanol (purity≥99.8%) was from
Pan-reac (Barcelone, Spain). The pure reference compounds and the chemical standard used as internal standard, 3-octanol,
were supplied by Sigma–Aldrich (Spain). The C8–C20n-alkane
series was supplied by Sigma–Aldrich (Spain). Water was puri-fied through a Milli-Q purification system (Millipore).
The SPME fibres, polydimethylsiloxane layer (PDMS,
100m); polyacrylate (PA, 85m); divinylbenzene–
carboxen–polydimethylsiloxane (DVB/CAR/PDMS, 50/30m)
on a 1 cm StableFlex fibre; carboxen–polydimethylsiloxane
(CAR/PDMS, 75m); polydimethylsiloxane/divinylbenzene
(PDMS/DVB, 65m) and the SPME holder for manual sampling,
were obtained from Supelco (Bellefonte, PA, USA). The coating of all fibres was 1 cm long. The fibres were conditioned before the first use according to the manufacturer’s instructions by
inserting them into the GC injector port (100m PDMS 0.5 h at
250◦C; 85
m PA 2 h at 300◦C; 50/30
m DVB/CAR/PDMS 1 h at
270◦C; 65m PDMS/DVB 0.5 h at 250◦C and 75m CAR/PDMS
1.5 h at 300◦C). Before the first daily analysis the fibres were
conditioned for 20 min. A blank test was performed to check possible carry-over. If not in use for more than 24 h, then the fibres were cleaned for 20 min at their respective conditioning temperature.
2.2. Beverage samples
Five Portuguese white wines (Terras Madeirenses) of the 2005
vintage, originating from different grape varieties (Table 1),
all of them belonging to the Portuguese Madeira Appella-tion “Regi ˜ao Demarcada da Madeira”, were analysed following the proposed method. The wine samples were supplied by
Table 1 – Varietal composition ofTerras madeirenseswine
samples (bold character indicates the main variety) Wine samples Varietal composition Alcohol (%)
WW1a Verdelho, Arnsburger, Boal 11.5
WW2 Verdelho, Arnsburger 12.5
WW3 Malvazia 12.5
WW4 Arnsburger 12.0
WW5 Verdelho, 12.5
aWW: white wine.
the Madeira Wine Institute, and were produced in Adega de S ˜ao Vicente (Northern of Madeira Island) on indus-trial scale using traditional winemaking processes for white wines. Grapes from different varieties were crushed, de-stemmed, racked and pressed. The musts were fermented in stainless-steel containers, with spontaneous yeast.
Alco-holic fermentation was carried out at 18–20◦C. The code
of analysed wines and the varietal composition of the
dif-ferent wine samples are presented inTable 1. All samples
were taken from bottled wines (750 ml) ready for sale and
were stored at −28◦C until analysis. WW1 Vitis vinifera L.
white wine (11.5%, (v/v)), made with Verdelho, Arnsburger and Boal grapes, was selected for the HS-SPME method optimization.
Beer samples were purchased from the retail market and included beer “B1” 100% malt, beers “B2” and “B3” 100% malt (same sort than “B1”) but “B2” without alcohol and “B3” stout beer. Furthermore, beer “B5” purchased in an aluminium can was also analysed to prove that a discrimination of the same beer sort from the same supplier brand filled in glass bottle “B4” and aluminium can is possible. The ethanol con-tent ranged between 5.0 and 5.6% (v/v). The beer samples
were cooled to 4◦C to minimize the loss of very volatile
compounds. B1 beer (100% malt; 5%, v/v, alcohol) sorts in glass bottles (330 ml) were used for the analytical method optimization.
Commercial Scotch whisky (SW) samples (40%, v/v, alco-hol), were purchased from a local store (Funchal, Madeira
Island), and frozen at−28◦C until their analysis. Before
extrac-tion the volatile compounds, the samples were unfrozen at
3–4◦C. SW5 commercial Scotch whisky (SW) samples (40%, v/v,
alcohol), was used for the analytical method optimization.
All alcoholic beverage samples were coded (Table 1) with
a letter (WW representing white wine, B representing beer and SW representing Scotch whisky samples) and a number (1–5) representing different samples within the same alcoholic beverage.
The high ethanol concentration (≈40%, v/v) of the whisky
samples required dilution before the extraction procedure.
Some authors [30,31] have found that an increase in the
2.3. Extraction of beverages VOCs and SVOCs by headspace SPME
HS-SPME requires a previous optimization of the extraction parameters that can affect extraction efficiencies, in order to obtain high recoveries of VOCs and SVOCs. Some SPME param-eters with influence in the extraction process were selected for optimization: fibre coating, extraction time, extraction tem-perature, ionic strength and sample stirring. The WW1 white wine, B1 beer and SW5 whisky samples, were selected as the matrix for comparison of the performance of the five fibres. The fibre that presented the most complete profile from alcoholic beverages VOCs and SVOCs, was chosen to optimize the sampling procedure and the operating condi-tions. Extraction studies were conducted to determine the profiles of adsorption/absorption kinetics. The samples were extracted for predetermined exposure times of 5, 30, 45, 60
and 80 min. The extraction was carried out at 30◦C (controlled
temperature) for wine and beer and 40◦C for whisky, and each
measurement was repeated three times. Each alcoholic bev-erage was also tested at four heating temperatures (30, 40,
50 and 60◦C) with 60 min of fibre-exposed time. The volume
ratio headspace/solution was 1:1. The PDMS, DVB/CAR/PDMS and CAR/PDMS fibres, the most suitable for isolation of VOCs and SVOCs from wine, beer and whisky samples, were subse-quently chosen for further method development.
For headspace sampling, 30 mL of each beverage sample was transferred into a 60 mL glass vial, which corresponds to a ratio of the volume of the liquid phase to the headspace
volume (1/ˇ) of 1.0 and hermetically sealed. The extractions
were carried out without adjust of pH. The ionic strength was increased using NaCl (30%, w/v) to improve the extraction effi-ciency by decreasing the solubility of hydrophilic compounds in the aqueous phase. A Teflon septum and an aluminium cap sealed the vial that was subsequently placed in a thermostatic bath adjusted to desired temperature, under continuous
stir-ring (containing a 25 mm×5 mm stirring bar) at 750 rpm to
promote the transference of the compounds from the sample to the headspace. After this step, the adequate SPME fibre was manually inserted into the sample vial headspace and then exposed to the headspace of the beverage samples and kept
for 60 min at 30◦C for white wine and beer samples isolation
VOCs and SVOCs and 40◦C for whisky samples. Blanks,
cor-responding to the analysis of the coating fibre not submitted to any extraction procedure, were run between a set of five analyses.
After sampling, the SPME fibre was withdrawn into the needle, removed from the vial and inserted into the hot
injec-tor port (260◦C) of the GC–qMSD system where the extracted
analytes were thermally desorbed and transferred directly to the analytical column. Through all the work, a relatively long desorption time in the injector (6 min) was selected to avoid carryover between runs by ensuring full desorption of all ana-lytes from the fibre. Each analysis was carried out four times.
2.4. Gas chromatography–quadrupole mass
spectrometry detection (GC–qMSD)
The desorbed volatile compounds were separated in an Agi-lent 6890N (Palo Alto, CA, USA) gas chromatograph system
coupled to an Agilent 5975 quadrupole inert mass selective
detector equipped with a 30 m×0.25 mm i.d., with a 0.25m
film thickness, BP-20 fused silica capillary column. Ultra-high-purity helium (Helium N60, Air Liquid, Portugal) was used as
the carrier gas at a flow rate≈1 mL min−1(column-head
pres-sure: 13 psi). Water and oxygen traps were installed on the carrier gas lines. An insert of 0.75 mm i.d. was used and the injector temperature was set according to the nature of the fibre used. This temperature close to the maximum tempera-ture recommended by the manufactempera-turer, allowed us to avoid a significant carry over effect. Splitless injections were used. The
initial oven temperature program was 40◦C holds for 1 min
and then the temperature increased in three steps: 40–120◦C,
at 2◦C min−1; 100–180◦C at 1.7◦C min−1 and 180–220◦C, at
25◦C min−1. Each step was preceded by a small period at
con-stant temperature for 2, 1 and 10 min, respectively. The overall GC run time was 90.89 min. Trap temperatures were as follows:
manifold 180◦C, transfer line 220◦C, and trap 200◦C. The mass
spectrometer was operated in electron ionization mode (EI) at
70 eV and covering a mass-to-charge (m/z) range from 35 to
300 in full scan acquisition mode. The US National Institute of Standards and Technology (NIST05) mass spectral database library (Gaithersburg, MD, USA) was used for all tentative com-pound identifications. A reverse fit value of 850 was required for compounds to be considered a spectral match. Tentatively identified compounds also had to fit logically with respect to the retention time in the chromatograms. The Kov ´ats reten-tion indices were calculated for each peak and compared with
the literature[32]in order to ensure the correct identification
of the compounds. Based on the peak resolution, their areas were calculated from the total ion current. The resulting peak areas were expressed in arbitrary units of area.
3.
Results and discussion
The first stage of this study addressed the optimization of the parameters that influence the aroma extraction by SPME. Among the several variables that could improve the SPME pro-cedure, fibre coating, extraction temperature and extraction time, are three of the most important factors influencing the vapour pressure and equilibrium of the aroma compounds in the headspace, and therefore should be optimized. The results showed that, an increase of these factors results in an increase in the analytical signal. Sample agitation and ionic strength are other known factors that cause an increase in the method sensitivity.
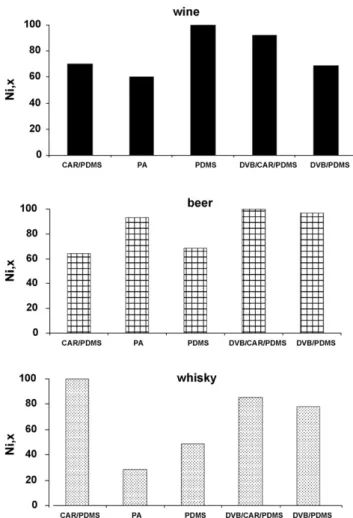
The comparison of the SPME fibre performance can be made in terms of extraction efficiency and number of identifiable compounds in the extracts. Therefore the normalized
extrac-tion efficiency,Ni,xwas defined as:N=
Ai,x/Ai,Fbest, whereAi,x is the sum of thei peak area obtained withx fibre,
and
Ai,Fbestis the corresponding sum obtained after extrac-tion the same matrix with the fibre that present the highest extraction efficiency.From the relative composition of flavour volatiles of the alcoholic beverage, it can be concluded that ethyl esters, higher alcohols and fatty acids, major fermentation com-pounds, such as higher alcohols, ethyl esters and fatty acids constitute an important part of flavour of the studied alco-holic beverages, and probably play a significant role in their fruity notes. As predominant compounds 3-methyl-1-butanol, ethyl octanoate, ethyl decanoate and to a lesser extent,
-phenylethanol, isoamyl acetate, ethyl dodecanoate, ethyl
acetate and octanoic acid, were found. The two fatty acid ethyl esters may contribute with sweet and fruity notes;
2-and 3-methylbutan-1-ol should exhibit banana notes 2-and
-phenylethanol may contribute with flowery, rose and honey notes. Some compounds were found out to be common
in the studied beverages, such as 3-methyl-1-butanol, 
-phenylethanol, isoamyl acetate, ethyl esters from C6, C8 and C10 fatty acids, and hexanoic, octanoic and decanoic acids.
3.1. Method optimization
3.1.1. Selection of SPME fibre coating for different beverages
The fibre coating is surely the most important parameter to be considered in a first stage, due to the influences on the chemical nature of the extracted analytes established by their characteristic polarity and volatility. To evaluate the extraction efficiency of volatile compounds from alcoholic beverages, and taking account of the physic/chemical characteristics of the targets under consideration, were tested five fibres (PDMS, PA, CAR/PDMS, PDMS/DVB and DVB/CAR/PDMS) among those used most routinely for assaying VOCs and SVOCs. Whereas PA and PDMS (liquid coatings) extract by absorption, the latter three can be considered as “solids” which extract by adsorp-tion. At this evaluation stage, the extraction time was set at 60 min (in order to assure that the equilibrium could be estab-lished or a large amount of analytes would be extracted) and
extraction temperature at 40◦C. The comparison of the SPME
fibre performance was made in terms of extraction efficiency, number of identifiable compounds in the extract and repro-ducibility.
3.1.1.1. Wine. As shown inFig. 1, the PDMS fibre allowed the best extraction efficiency for white wines VOCs and SVOCs. Under these conditions the DVB/CAR/PDMS fibre had a low sorption capacity. The results obtained using the five fibres on the same wine sample (WW1), in rigorously reproduced
tem-perature and exposure time conditions, are reported inTable 2.
The more polar fibre, PA, shows a more effective extraction for polar compounds such as higher alcohols and fatty acids while PDMS favours the extraction of less polar compounds like ethyl esters, monoterpenols/C13-norisoprenoids, acetates and isoamyl esters. The profiles obtained for WW1 wine sample by
Fig. 1 – Normalized extraction efficiencies measured for CAR/PDMS, PA, PDMS, DVB/CAR/PDMS and DVB/PDMS fibres.
using different coatings in the same experimental conditions, shows that the fibres exhibit different extraction efficiency. The qualitative composition of white wine volatiles and the number of identified compounds using the five fibres under
study is quite different. As seen inTable 2, a total of 40 and 39
compounds were identified using PA and CAR/PDMS coatings, whilst with PDMS/DVB, PDMS and DVB/CAR/PDMS coatings 32, 33 and 36 compounds were detected. The non-polar PDMS fibre allowed the best efficiency of extraction for volatile com-pounds, while under the same conditions, PA fibre showed the lowest sorption capacity. The former fibre provided the best sensitivity in terms of total compound peak areas and higher reproducibility; hence this fibre was chosen for evalu-ation of volatile compounds in white wines. DVB/CAR/PDMS fibre extracted 92.4% of PDMS while PA coating extracted the lowest amount (about 60.2% of PDMS). Similar amounts of volatiles (68.5–70.4% of PDMS) were extracted when using
either, PDMS/DVB or CAR/PDMS coatings (Fig. 1).
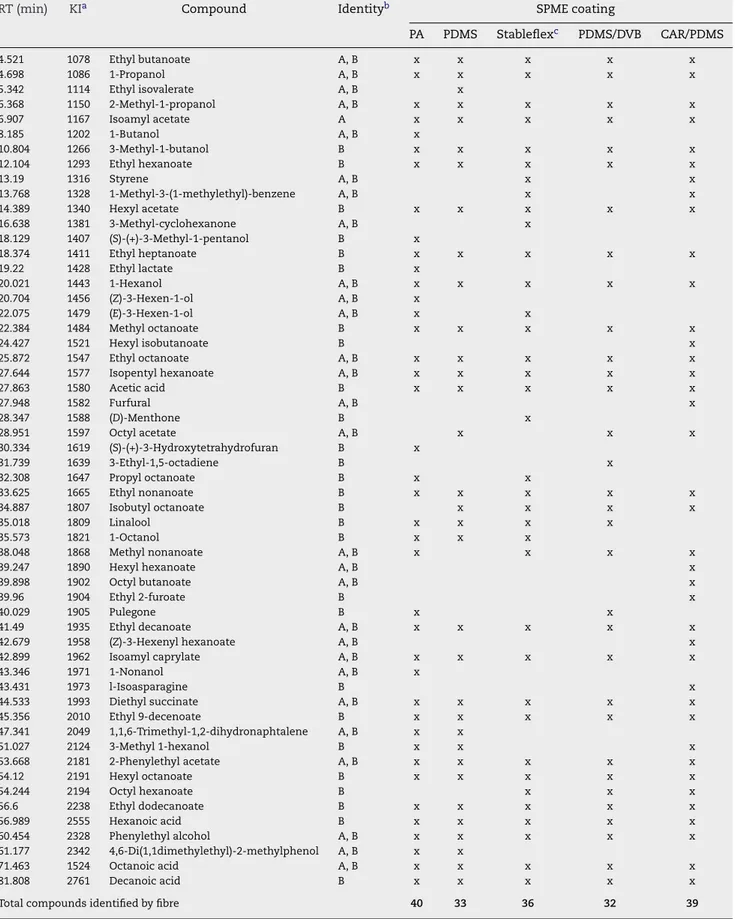
Table 2 – Volatile compounds identified in WW1 white wine after dynamic headspace solid-phase microextraction using
different coatings (extraction temperature: 30◦C; extraction time: 60 min; 30% NaCl; 750 rpm)
RT (min) KIa Compound Identityb SPME coating
PA PDMS Stableflexc PDMS/DVB CAR/PDMS
4.521 1078 Ethyl butanoate A, B x x x x x
4.698 1086 1-Propanol A, B x x x x x
5.342 1114 Ethyl isovalerate A, B x
6.368 1150 2-Methyl-1-propanol A, B x x x x x
6.907 1167 Isoamyl acetate A x x x x x
8.185 1202 1-Butanol A, B x
10.804 1266 3-Methyl-1-butanol B x x x x x
12.104 1293 Ethyl hexanoate B x x x x x
13.19 1316 Styrene A, B x x
13.768 1328 1-Methyl-3-(1-methylethyl)-benzene A, B x x
14.389 1340 Hexyl acetate B x x x x x
16.638 1381 3-Methyl-cyclohexanone A, B x
18.129 1407 (S)-(+)-3-Methyl-1-pentanol B x
18.374 1411 Ethyl heptanoate B x x x x x
19.22 1428 Ethyl lactate B x
20.021 1443 1-Hexanol A, B x x x x x
20.704 1456 (Z)-3-Hexen-1-ol A, B x
22.075 1479 (E)-3-Hexen-1-ol A, B x x
22.384 1484 Methyl octanoate B x x x x x
24.427 1521 Hexyl isobutanoate B x
25.872 1547 Ethyl octanoate A, B x x x x x
27.644 1577 Isopentyl hexanoate A, B x x x x x
27.863 1580 Acetic acid B x x x x x
27.948 1582 Furfural A, B x
28.347 1588 (D)-Menthone B x
28.951 1597 Octyl acetate A, B x x x
30.334 1619 (S)-(+)-3-Hydroxytetrahydrofuran B x
31.739 1639 3-Ethyl-1,5-octadiene B x
32.308 1647 Propyl octanoate B x x
33.625 1665 Ethyl nonanoate B x x x x x
34.887 1807 Isobutyl octanoate B x x x x
35.018 1809 Linalool B x x x x
35.573 1821 1-Octanol B x x x
38.048 1868 Methyl nonanoate A, B x x x x
39.247 1890 Hexyl hexanoate A, B x
39.898 1902 Octyl butanoate A, B x
39.96 1904 Ethyl 2-furoate B x
40.029 1905 Pulegone B x x
41.49 1935 Ethyl decanoate A, B x x x x x
42.679 1958 (Z)-3-Hexenyl hexanoate A, B x
42.899 1962 Isoamyl caprylate A, B x x x x x
43.346 1971 1-Nonanol A, B x
43.431 1973 l-Isoasparagine B x
44.533 1993 Diethyl succinate A, B x x x x x
45.356 2010 Ethyl 9-decenoate B x x x x x
47.341 2049 1,1,6-Trimethyl-1,2-dihydronaphtalene A, B x x
51.027 2124 3-Methyl 1-hexanol B x x x
53.668 2181 2-Phenylethyl acetate A, B x x x x x
54.12 2191 Hexyl octanoate B x x x x x
54.244 2194 Octyl hexanoate B x x x
56.6 2238 Ethyl dodecanoate B x x x x x
56.989 2555 Hexanoic acid B x x x x x
60.454 2328 Phenylethyl alcohol A, B x x x x x
61.177 2342 4,6-Di(1,1dimethylethyl)-2-methylphenol A, B x x
71.463 1524 Octanoic acid A, B x x x x x
81.808 2761 Decanoic acid B x x x x x
Total compounds identified by fibre 40 33 36 32 39
a Experimentally determined Kov `ats indices on the BP-20 column, relative to C
8–C20hydrocarbons.
b A, components identified on the basis of the retention time and EI mass spectra of pure standard; B, components identified on the basis of their EI mass spectra only.
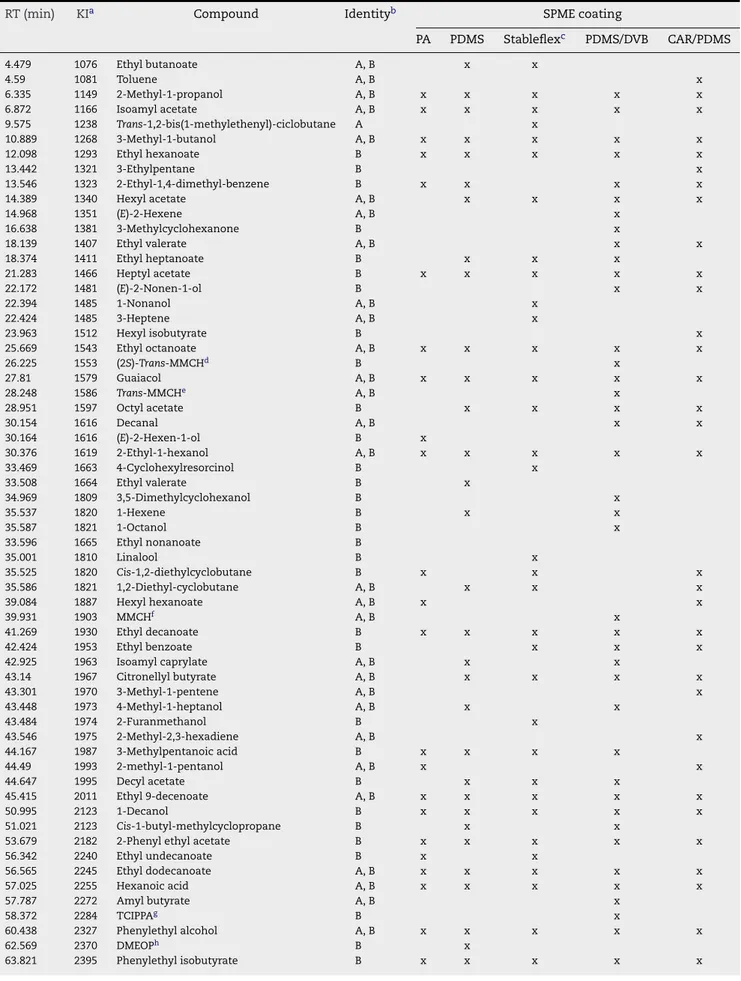
Table 3 – Volatile compounds identified in B1 beer after dynamic headspace solid-phase microextraction using different
coatings (extraction temperature: 40◦C; extraction time: 60 min; 30% NaCl; 750 rpm)
RT (min) KIa Compound Identityb SPME coating
PA PDMS Stableflexc PDMS/DVB CAR/PDMS
4.479 1076 Ethyl butanoate A, B x x
4.59 1081 Toluene A, B x
6.335 1149 2-Methyl-1-propanol A, B x x x x x
6.872 1166 Isoamyl acetate A, B x x x x x
9.575 1238 Trans-1,2-bis(1-methylethenyl)-ciclobutane A x
10.889 1268 3-Methyl-1-butanol A, B x x x x x
12.098 1293 Ethyl hexanoate B x x x x x
13.442 1321 3-Ethylpentane B x
13.546 1323 2-Ethyl-1,4-dimethyl-benzene B x x x x
14.389 1340 Hexyl acetate A, B x x x x
14.968 1351 (E)-2-Hexene A, B x
16.638 1381 3-Methylcyclohexanone B x
18.139 1407 Ethyl valerate A, B x x
18.374 1411 Ethyl heptanoate B x x x
21.283 1466 Heptyl acetate B x x x x x
22.172 1481 (E)-2-Nonen-1-ol B x x
22.394 1485 1-Nonanol A, B x
22.424 1485 3-Heptene A, B x
23.963 1512 Hexyl isobutyrate B x
25.669 1543 Ethyl octanoate A, B x x x x x
26.225 1553 (2S)-Trans-MMCHd B x
27.81 1579 Guaiacol A, B x x x x x
28.248 1586 Trans-MMCHe A, B x
28.951 1597 Octyl acetate B x x x x
30.154 1616 Decanal A, B x x
30.164 1616 (E)-2-Hexen-1-ol B x
30.376 1619 2-Ethyl-1-hexanol A, B x x x x x
33.469 1663 4-Cyclohexylresorcinol B x
33.508 1664 Ethyl valerate B x
34.969 1809 3,5-Dimethylcyclohexanol B x
35.537 1820 1-Hexene B x x
35.587 1821 1-Octanol B x
33.596 1665 Ethyl nonanoate B
35.001 1810 Linalool B x
35.525 1820 Cis-1,2-diethylcyclobutane B x x x
35.586 1821 1,2-Diethyl-cyclobutane A, B x x x
39.084 1887 Hexyl hexanoate A, B x x
39.931 1903 MMCHf A, B x
41.269 1930 Ethyl decanoate B x x x x x
42.424 1953 Ethyl benzoate B x x x
42.925 1963 Isoamyl caprylate A, B x x
43.14 1967 Citronellyl butyrate A, B x x x x
43.301 1970 3-Methyl-1-pentene A, B x
43.448 1973 4-Methyl-1-heptanol A, B x x
43.484 1974 2-Furanmethanol B x
43.546 1975 2-Methyl-2,3-hexadiene A, B x
44.167 1987 3-Methylpentanoic acid B x x x x
44.49 1993 2-methyl-1-pentanol A, B x x
44.647 1995 Decyl acetate B x x x
45.415 2011 Ethyl 9-decenoate A, B x x x x x
50.995 2123 1-Decanol B x x x x x
51.021 2123 Cis-1-butyl-methylcyclopropane B x x
53.679 2182 2-Phenyl ethyl acetate B x x x x x
56.342 2240 Ethyl undecanoate B x x
56.565 2245 Ethyl dodecanoate A, B x x x x x
57.025 2255 Hexanoic acid A, B x x x x x
57.787 2272 Amyl butyrate A, B x
58.372 2284 TCIPPAg B x
60.438 2327 Phenylethyl alcohol A, B x x x x x
62.569 2370 DMEOPh B x
Table 3 (Continued)
RT (min) KIa Compound Identityb SPME coating
PA PDMS Stableflexc PDMS/DVB CAR/PDMS
65.38 2426 3,5-Dimethyl-1-hexene A, B x
65.635 2432 Camphene A, B x
70.247 2512 -Myrcene A, B x
70.293 2512 Linalyl acetate A x
71.569 2525 Octanoic acid A, B x x x x x
74.418 2608 Ethyl cinnamate A x x
78.259 2686 2-Methoxy-4-vinylphenol A, B x x x x x
78.301 2687 2′-Hydroxy-5′-methylacetophenone A x
81.772 2760 Decanoic acid A, B x x x x x
84.083 2803 9-Decenoic acid A x
84.188 2805 CPTi A x x x
85.035 2823 (E)-3-Penten-2-one A x
88.421 2891 Dodecanoic acid A, B x x x x
88.545 2893 5-Hydroxymethyl)furfural A, B x x
89.238 2907 4-Chloro-2-nitrophenol B x x
Total compounds identified per fiber 32 38 38 48 39
a Experimentally determined Kov `ats indices on the BP-20 column, relative to C
8–C20hydrocarbons.
b A, components identified on the basis of the retention time and EI mass spectra of pure standard; B, components identified on the basis of their EI mass spectra only.
c DVB/CAR/PDMS coating.
d(2S-Trans)-5-methyl-2-(1-methylethyl)cyclohexanone. e Trans-5-methyl-2-(1-methylethyl)cyclohexanone. f 5-Methyl-2-(1-methylethyl)cyclohexanone.
g 2,2,4-Trimethyl-3-carboxyisopropyl pentanoic acid isobutyl ester. h2,6-Bis(1,1-dimethylethyl)-4-(1-oxopropyl)phenol.
i (1␣,2,3,4␣)-1,2,3,4-Cyclopentanetetrol.
different coatings are summarized inFig. 1. The extraction
efficiency of DVB/CAR/PDMS fibre was set as 100%. The PA and PDMS/DVB (good selectivity for middle- to high-molecular weight analytes) exhibit similar sensitivities. Under these con-ditions, the PDMS fibre shows a low sorption capacity for B1
beer VOCs and SVOCs. As seen inTable 3, a total of 77
com-pounds were identified in B1 beer using the five fibres under study. Thirty-three compounds were identified using PA fibre whilst PDMS and DVB/CAR/PDMS extracted the same num-ber of compounds, 38. With the PDMS/DVB and CAR/PDMS coatings it was possible to identify 48 and 39 compounds, respectively.
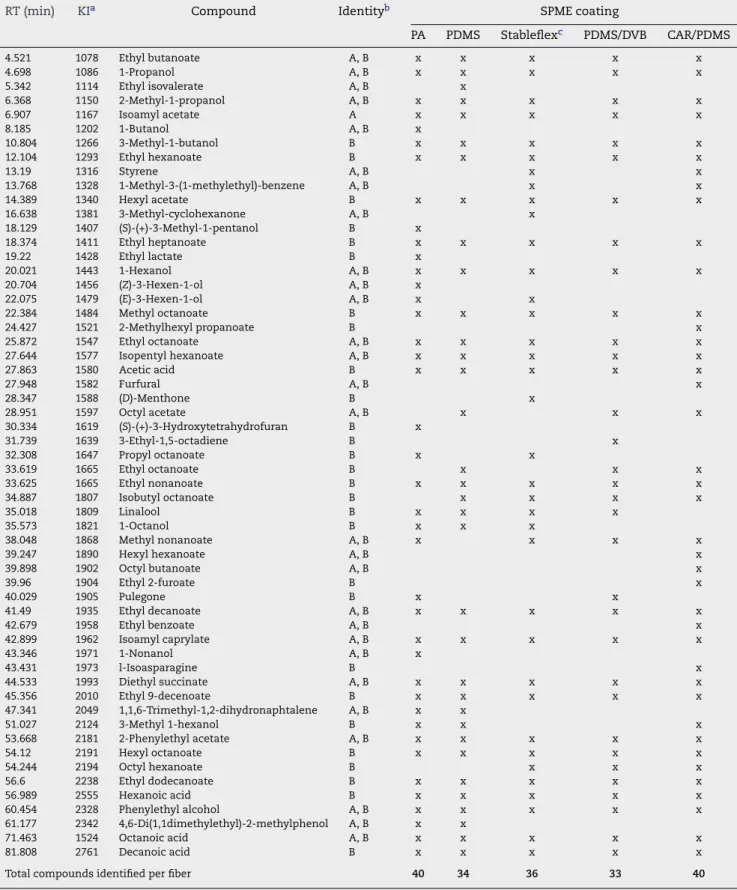
3.1.1.3. Whisky. The most complete profile of whisky VOCs and SVOCs corresponds to analyses carried with the CAR/PDMS fibre, which extracted more than 55 compounds (esters, aldehydes, alcohols, ketones, acids, ethers, aromatic compounds, alicyclic compounds, heterocyclic compounds,
and hydrocarbons), at 40◦C with a wide range of polarities
and molecular masses (Table 4).
Higher alcohols have a larger affinity for PA fibre. This coat-ing also presents better sensitivity for furanic compounds, carbonyl compounds and miscellaneous. DVB/CAR/PDMS coating showed a strong extraction capacity for aliphatic and aromatic hydrocarbons, C13-norisoprenoids/monoterpenes and ethyl esters. The most intense peak in the SW5 sam-ple corresponds to ethyl octanoate. This compound was
detected in all used fibres. As shown inTable 5, higher
alco-hols, low-chain esters and C8, C10 and C12, fatty acids were
also detected. The PDMS fibre extracted 48.58% of CAR/PDMS while PA coating extracted the lowest amount (about 28.7% of CAR/PDMS). Similar amounts of volatiles (78.5–85.6% of CAR/PDMS) were extracted when using either, PDMS/DVB or
DVB/CAR/PDMS coatings (Fig. 1).
3.1.2. Effect of extraction time
The extraction time depends on the chemical nature of the target compounds, but in particular on the polymeric phase. In order to investigate the sorption behaviour, a time pro-file of adsorption of the different class of compounds onto
the 100m PDMS for wines, the 50/30m DVB/CAR/PDMS for
beers and the 75m CAR/PDMS for whiskys was determined
in order to assess the optimum SPME sampling period. Dif-ferent extraction times ranging from 5 to 80 min namely, 5, 30, 45, 60 and 80 min, were examined for 30 ml of beverage
sample at 30◦C. InFig. 2, the MS response against the SPME
sampling period is displayed for CAR/PDMS fibre after different extraction times (5–80 min). This figure shows the efficiency of the extraction displayed as the sum of volatile compounds total peak areas after different exposure times of the fibre to the beverage headspace for 5, 30, 45, 60 and 80 min. An expo-sure time of 60 min was chosen for VOCs and SVOCs extraction from wine, beer and whisky samples.
extrac-Table 4 – Volatile compounds identified in SW5 whisky after dynamic headspace solid-phase microextraction using
different coatings (extraction temperature: 40◦C; extraction time: 60 min; 30% NaCl; 750 rpm)
RT (min) KIa Compound Identityb SPME coating
PA PDMS Stableflexc PDMS/DVB CAR/PDMS
4.521 1078 Ethyl butanoate A, B x x x x x
4.698 1086 1-Propanol A, B x x x x x
5.342 1114 Ethyl isovalerate A, B x
6.368 1150 2-Methyl-1-propanol A, B x x x x x
6.907 1167 Isoamyl acetate A x x x x x
8.185 1202 1-Butanol A, B x
10.804 1266 3-Methyl-1-butanol B x x x x x
12.104 1293 Ethyl hexanoate B x x x x x
13.19 1316 Styrene A, B x x
13.768 1328 1-Methyl-3-(1-methylethyl)-benzene A, B x x
14.389 1340 Hexyl acetate B x x x x x
16.638 1381 3-Methyl-cyclohexanone A, B x
18.129 1407 (S)-(+)-3-Methyl-1-pentanol B x
18.374 1411 Ethyl heptanoate B x x x x x
19.22 1428 Ethyl lactate B x
20.021 1443 1-Hexanol A, B x x x x x
20.704 1456 (Z)-3-Hexen-1-ol A, B x
22.075 1479 (E)-3-Hexen-1-ol A, B x x
22.384 1484 Methyl octanoate B x x x x x
24.427 1521 2-Methylhexyl propanoate B x
25.872 1547 Ethyl octanoate A, B x x x x x
27.644 1577 Isopentyl hexanoate A, B x x x x x
27.863 1580 Acetic acid B x x x x x
27.948 1582 Furfural A, B x
28.347 1588 (D)-Menthone B x
28.951 1597 Octyl acetate A, B x x x
30.334 1619 (S)-(+)-3-Hydroxytetrahydrofuran B x
31.739 1639 3-Ethyl-1,5-octadiene B x
32.308 1647 Propyl octanoate B x x
33.619 1665 Ethyl octanoate B x x x
33.625 1665 Ethyl nonanoate B x x x x x
34.887 1807 Isobutyl octanoate B x x x x
35.018 1809 Linalool B x x x x
35.573 1821 1-Octanol B x x x
38.048 1868 Methyl nonanoate A, B x x x x
39.247 1890 Hexyl hexanoate A, B x
39.898 1902 Octyl butanoate A, B x
39.96 1904 Ethyl 2-furoate B x
40.029 1905 Pulegone B x x
41.49 1935 Ethyl decanoate A, B x x x x x
42.679 1958 Ethyl benzoate A, B x
42.899 1962 Isoamyl caprylate A, B x x x x x
43.346 1971 1-Nonanol A, B x
43.431 1973 l-Isoasparagine B x
44.533 1993 Diethyl succinate A, B x x x x x
45.356 2010 Ethyl 9-decenoate B x x x x x
47.341 2049 1,1,6-Trimethyl-1,2-dihydronaphtalene A, B x x
51.027 2124 3-Methyl 1-hexanol B x x x
53.668 2181 2-Phenylethyl acetate A, B x x x x x
54.12 2191 Hexyl octanoate B x x x x x
54.244 2194 Octyl hexanoate B x x x
56.6 2238 Ethyl dodecanoate B x x x x x
56.989 2555 Hexanoic acid B x x x x x
60.454 2328 Phenylethyl alcohol A, B x x x x x
61.177 2342 4,6-Di(1,1dimethylethyl)-2-methylphenol A, B x x
71.463 1524 Octanoic acid A, B x x x x x
81.808 2761 Decanoic acid B x x x x x
Total compounds identified per fiber 40 34 36 33 40
a Experimentally determined Kov `ats indices on the BP-20 column, relative to C
8-C20hydrocarbons.
b A, components identified on the basis of the retention time and EI mass spectra of pure standard; B, components identified on the basis of their EI mass spectra only.
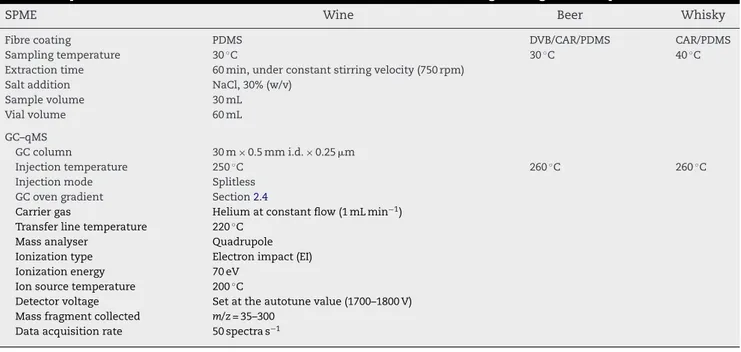
Table 5 – Optimized conditions to extract VOCs and SVOCs from alcoholic beverages using HS-SPME procedure
SPME Wine Beer Whisky
Fibre coating PDMS DVB/CAR/PDMS CAR/PDMS
Sampling temperature 30◦C 30◦C 40◦C
Extraction time 60 min, under constant stirring velocity (750 rpm)
Salt addition NaCl, 30% (w/v)
Sample volume 30 mL
Vial volume 60 mL
GC–qMS
GC column 30 m×0.5 mm i.d.×0.25m
Injection temperature 250◦C 260◦C 260◦C
Injection mode Splitless
GC oven gradient Section2.4
Carrier gas Helium at constant flow (1 mL min−1) Transfer line temperature 220◦C
Mass analyser Quadrupole
Ionization type Electron impact (EI)
Ionization energy 70 eV
Ion source temperature 200◦ C
Detector voltage Set at the autotune value (1700–1800 V) Mass fragment collected m/z= 35–300
Data acquisition rate 50 spectra s−1
tion time. Ethyl esters and higher alcohols, reach balance in 30 min, whereas the acetates, norisoprenoids, acetates, isoamyl esters only at 60 min. For most volatiles, equilibrium of adsorption was reached between 45 and 60 min, while for some other components the equilibrium was still not reached after 60 min. It was also observed that the extracted amount decrease after 60 min sampling, most probably due to compe-tition effects. Therefore, it can be concluded that the highest recovery was obtained after 60 min, although the reproducibil-ity was higher after an extraction time of 30 min. Sixty minutes were selected as an adequate extraction time because some analytes had already reached equilibrium and the obtained sensitivity for the other analytes was acceptable.
3.1.3. Effect of extraction temperature
The SPME process is greatly influenced by temperature. Heat-ing the sample to an elevated temperature, increases the release of analytes from the matrix and, therefore, increasing their concentration in the headspace. The analyte diffusion
Fig. 2 – Effect of adsorption time at 30◦C on the extraction
efficiency of VOCs and SVOCs from alcoholic beverages by HS-SPME extraction using the best fibre for each beverage (y-axis: total volatile compounds expressed as peak area).
Fig. 3 – Influence of the extraction temperature on absorption of different wine, beer and whisky VOCs and SVOCs during HS-SPME extraction with the fibre that present the most complete profile in each sample, PDMS for wines, DVB/CAR/PDMS for beers, and CAR/PDMS for whiskys (extraction time: 60 min; 30% (w/v) NaCl; 750 rpm).
phenomenon is controlled from the liquid to the gaseous phase, as well as, the adsorption/absorption onto the fibre coating. The influence of the extraction temperature on the amount of VOCs and SVOCs in wine, beer and whisky, extracted by HS-SPME using the selected fibre for each matrix, i.e. PDMS, DVB/CAR/PDMS and CAR/PDMS, respectively, was investigated by sampling WW1 wine, B1 beer and SW5 whisky,
at different temperatures, 30, 40, 50 and 60◦C, during 60 min.
The results are summarised inFig. 3. As it can be seen the
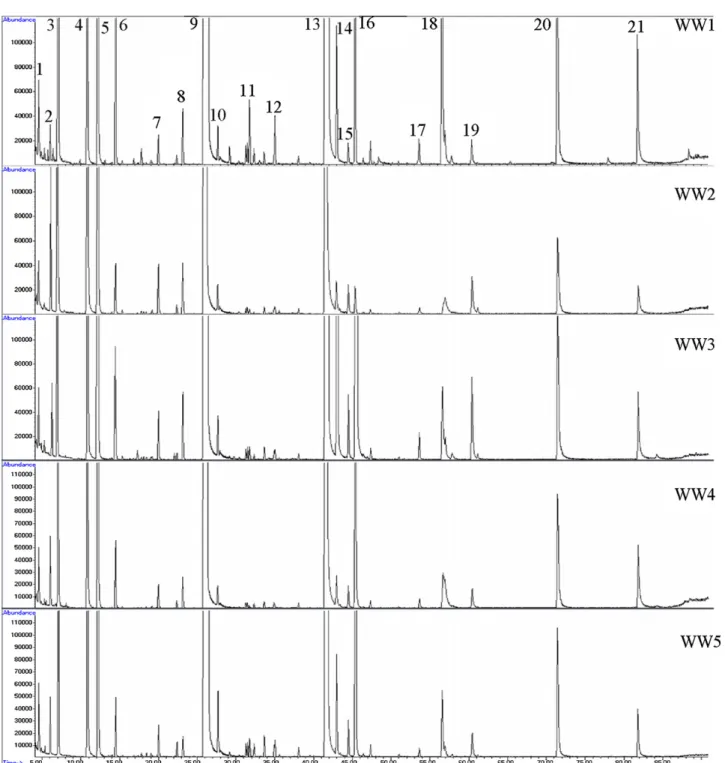
Fig. 4 – Total ion current chromatograms (TIC) of wine VOCs and SVOCs after SPME extraction with PDMS fibre (extraction temperature: 30◦C; extraction time: 60 min; 30% (w/v) NaCl; stirring: 750 rpm). Peak identification: (1) ethyl butanoate; (2)
2-methyl-1-propanol; (3) isoamyl acetate; (4) 3-methyl-1-butanol; (5) ethyl hexanoate; (6) hexyl acetate; (7) 1-hexanol; (8) 3-octanol (IS); (9) ethyl octanoate; (10) Isoamyl hexanoate; (11) geraniol acetate; (12) linalool; (13) ethyl decanoate; (14) isoamyl octanoate; (15) ethyl 9-decenoate; (16) 2-phenylethyl acetate; (17) ethyl dodecanoate; (18)-phenylethanol; (19) octanoic acid; (20) nonanoic acid; (21) ethyl succinate; (22) decanoic acid.
30◦C was selected for VOCs and SVOCs isolation in the studied
white wines. As seen inFig. 3, 30 and 40◦C are the
tempera-tures that enable the best extraction efficiency of VOCs and SVOCs from beers and whiskys, respectively.
Two opposite phenomena take place when the extraction temperature is increased. For the low molecular mass
com-pounds, a negative effect was observed at the beginning of the chromatogram at higher extraction temperature. In the mean-while, at the end of the chromatogram a significant increase in the method sensitivity, with the rise of extraction tem-perature, was verified. The optimized method conditions are
3.2. HS-SPME–GC–qMSD method application to estimate the volatile profile in beverages
The proposed HS-SPME method, optimized and validated was applied to evaluate and compare the volatile patterns in com-mercial alcoholic beverages. Each matrix was analysed four
times using the best sampling conditions described inTable 5.
To confirm the versatility and suitability of the optimized SPME method, it was used to study the volatile fraction com-position of three different alcoholic beverages: beer, wine and whisky. The technique used made it possible to identify 44 VOCs and SVOCs in the five white wine samples, 64 VOCs and SVOCs in the five beers and 104 VOCs and SVOCs in the whisky samples. Altogether, only 21 volatiles were simultane-ously identified in all five wine samples, 17 in beer samples and 22 in whisky samples.
Most of the volatile compounds were identified by a library search NIST05. In some cases a comparison with authentic compounds was performed. The Kov ´ats retention indices were calculated for each peak and compared with the literature in order to ensure the correct identification of the compounds.
3.2.1. Wine volatile profile
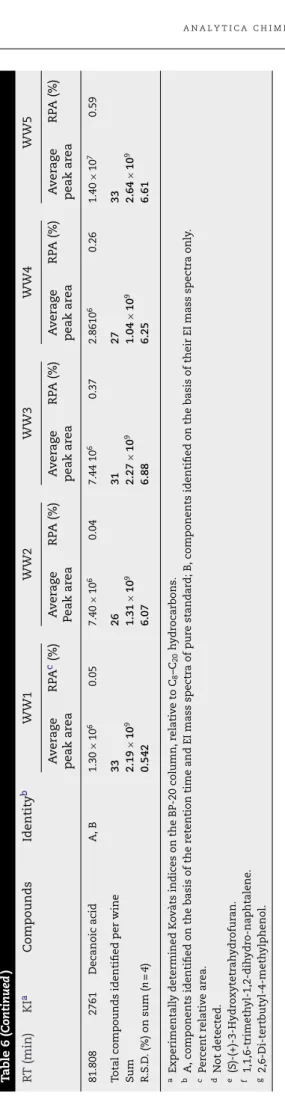
A typical GC–qMSD chromatogram obtained from a WW1 wine using the experimental conditions discussed above is shown inFig. 4. More than 40 volatile compounds belonging to several chemical classes were positively identified, including higher alcohols, fatty acids ethyl esters, fatty acid, acetates, isoamyl esters, terpenoids/C13-norisoprenoids compounds, carbonyl compounds and miscellaneous. The major fermentation com-pounds such as ethyl esters, higher alcohols and fatty acids, constitute a main part of the flavour of the young white wines. Table 6 summarises the average peak area (n=4) and the relative composition for the five analysed white wines. The relative composition of every flavour compound was calcu-lated as the percent ratio of the respective peak area relative
to the total peak area. FromFig. 4and Table 6, it is
appar-ent that there were no significant qualitative and quantitative differences between the volatile composition of the studied wines, which can be a consequence of the similarity in the
used grape varieties (Table 1) and elaboration/vinification
pro-cesses of WW1–WW5 wines.
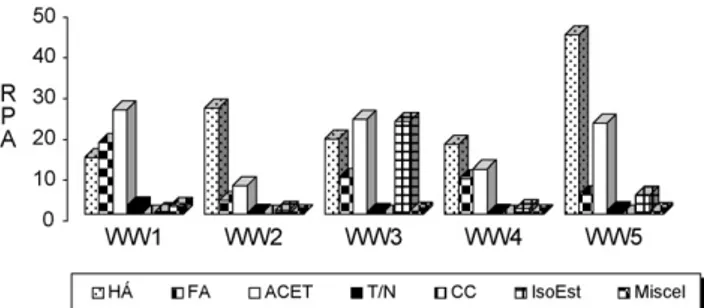
WW5 wines present higher amounts of volatile and semi-volatile compounds than WW3 wines, which turn were higher than WW1, WW2 and WW4 wines. WW1 wines are
char-acterised by the presence of terpenoids/C13-norisoprenoids,
fatty acids and higher alcohol acetates, which corroborates with the typical floral and fruity nuances of these wines. WW5 wines are characterised for their high content in higher alcohols, due to the presence of significant quantities of
3-methyl-1-butanol and-phenylethanol. In contrast, they have
the lowest levels of fatty acids. The content of higher alcohols acetates and isoamyl esters found in WW1 wines are higher than those in the other wines. Isoamyl esters are
predomi-nant in WW3 wine samples.Fig. 5presents the distribution of
compound classes by wine sample.
The fatty acids ethyl esters are quantitatively the largest group of volatile compounds found in the studied white wines. Ethyl octanoate, ethyl decanoate, ethyl hexanoate, ethyl dodecanoate and ethyl butanoate were dominant. These
compounds, namely C4–C10 compounds, make a positive con-tribution to the general quality of wines being responsible for
their “fruity” and “floral” sensory properties. It can also be
ver-ified, that the ethyl esters of fatty acids were more abundant than the acetates of higher alcohols.
The second most abundant isolated group were the higher alcohols, to which corresponds 9.3, 17.3, 12.3, 11.4 and 29.3% of all volatiles analysed by SPMEPDMS–GC–qMSD, in WW1, WW2, WW3, WW4, and WW5 wines, respectively. At concentrations
above 300 mg L−1, they are regarded as negative quality factors.
The main components of this group are
3-methylbutan-1-ol, which presence may cause “bitter, harsh, alcohol, fusel”,
-phenylethanol “pollen, roses, floral” notes, and hexan-1-ol,
which supply “herbaceous,vegetal” nuances to wine when its
concentration surpass their odour threshold values.
Fatty acids have been described with fruity, cheese, fatty and rancid notes. Among these compounds, octanoic acid and decanoic acid were present at higher contents in the five wines analysed. Their mean values were very similar and they
did not present significant differences (Fig. 5). The highest
content was observed for octanoic acid. Hexanoic acid and 3-methylbutanoic acid were detected only in WW1, WW3, WW5 and WW2 and WW5, respectively. Although the pres-ence of C6–C10 fatty acids is usually related to the appearance of negative odours, they are very important for the aromatic equilibrium in wines because they are opposed to the hydrol-ysis of the corresponding esters.
The terpenoids content of a wine is considered to be a quality factor. These wine constituents are fragrant and are no doubt important to the general enhancement of floral and fruity aromas. These compounds have been reported as hav-ing a determinant role in the wine aroma profile due to their very pleasant aroma and very low olfactory thresholds, so that they can be perceived during wine tasting even in low concentrations, due as well, to several synergic and antago-nist effects observed between them. This group showed the lowest values in the studied wines. Using dynamic headspace SPME only 0.2% (WW2 and WW4) to 1.4% (WW1) were found. Many of the terpenoids and C13-norisoprenoids identified in this study are typical constituents of different wines. Thus linalool, terpinolene and geraniol, have been reported
previ-ously as constituents of wines fromVitis vinifera L. varieties.
The major compounds of this chemical family found in white
Fig. 5 – Profile of the major volatile families found in the analysed wines (HA: higher alcohols; FA: fatty acids; ACET: higher alcohol acetates; T/N: terpenopid and
analytica
chimica
acta
6
0
9
(2008)
82–104
analysis (extraction temperature: 30◦C; extraction time: 60 min, sample with 30%, w/v, NaCl)
RT (min) KIa Compounds Identityb WW1 WW2 WW3 WW4 WW5
Average peak area
RPAc(%) Average
Peak area
RPA (%) Average
peak area
RPA (%) Average
peak area
RPA (%) Average
peak area
RPA (%)
4.521 1078 Ethyl butyrate A, B 3.46×10⁶ 0.16 2.50×10⁶ 0.19 1.78×10⁶ 0.08 2.19×10⁶ 0.23 3.30×10⁶ 0.12
4.927 1097 Ethyl methanoate B –d – – – 2.37×10⁵ 0.01 – – – –
5.342 1114 Ethyl isovalerate A, B 3.39×10⁵ 0.02 – – 3.07×10⁵ 0.01 2.74×10⁵ 0.03 3.47×10⁵ 0.01
6.368 1147 2-Methyl-1-propanol A, B 2.88×10⁷ 0.13 2.46×10⁶ 1.50 1.88×10⁶ 0.08 4.50×10⁶ 0.46 1.07×10⁶ 0.04
6.907 1167 Isoamyl acetate B 2.56×10⁷ 1.18 2.00×10⁷ 2.60 2.49×10⁷ 1.05 1.57×10⁷ 1.62 5.62×10⁷ 2.12
9.902 1246 Limonene A, B – – – – – – – – 1.89×10⁶ 0.01
10.804 1267 3-Methyl-1-butanol A, B 5.91×10⁷ 2.69 3.50×10⁷ 3.98 5.04×10⁷ 1.91 6.47×10⁷ 6.61 3.41×10⁷ 1.30
12.104 1293 Ethyl hexanoate A, B 1.10×10⁸ 5.10 4.40×10⁶ 0.33 7.26×10⁷ 3.07 4.68×10⁷ 4.89 1.03×10⁸ 3.89
13.190 1316 Styrene A, B – – – – – – – – 1.76×10⁵ 0.01
14.389 1340 Hexyl acetate A, B 3.63×10⁶ 0.17 3.63×10⁶ 0.14 6.49×10⁶ 0.28 2.62×10⁶ 0.27 1.27×10⁷ 0.48
17.789 1400 Linalool A, B – – – – – – – – 8.76×10⁵ 0.03
18.462 1413 Ethyl heptanoate A, B 2.19×10⁵ 0.01 – 0.04 – – – – – –
20.021 1443 1-Hexanol A, B 2.46×10⁶ 0.11 1.87×10⁶ 0.18 1.84×10⁶ 0.08 2.55×10⁶ 0.26 1.46×10⁶ 0.05
22.123 1480 3-Hexen-1-ol A, B – – – – 1.53×10⁵ 0.01 – – – –
22.384 1485 Methyl octanoate A, B 9,97×10⁵ 0.05 5.31×10⁵ 59.42 3.01×10⁵ 0.01 4.83×10⁵ 0.05 4.64×10⁶ 0.02
25.872 1547 Ethyl octanoate B 1.62×10⁹ 77.27 7.81×10⁸ 0.02 1.10×10⁹ 46.89 6.25×10⁸ 60.41 1.33×10⁹ 50.05
27.644 1577 Isopentyl hexanoate A, B 3.72×10⁶ 0.18 1.13×10⁶ 0.03 1.99×10⁵ 0.09 1.35×10⁶ 0.13 1.77×10⁶ 0.07
27.863 1580 Acetic acid B 2.83×10⁵ 0.01 – – 9.86×10⁴ 0.00 2.09×10⁵ 0.02 2.67×10⁵ 0.01
30.334 1619 HTHFe B – – – – – – – – 1.78×10⁵ 0.01
31.26 1632 ␣-Ionone B 8,24×10⁵ 0.04 3.02×10⁵ 0.03 4.37×10⁵ 0.02 2.02×10⁵ 0.02 7.95×10⁵ 0.03
31.471 1635 Terpinolene A, B 9,21×10⁵ 0.04 3.48×10⁵ 0.01 5.87×10⁵ 0.03 – – 9.64×10⁵ 0.04
31.739 1639 Geraniol A, B 1.19×10⁶ 0.06 – 0.02 – – – – 3.37×10⁶ 0.13
32.308 1647 Propyl octanoate A, B 8.68×10⁵ 0.04 3.32×10⁵ 26.45 – – 3.05 105 0.03 8.79×10⁵ 0.03
33.625 1665 Ethyl nonanoate B 1.40×10⁶ 0.07 4.39×10⁵ 0.17 6.60 105 0.03 3.87 105 0.04 6.42×10⁵ 0.02
34.818 1806 Isobutyl octanoate B 6.54×10⁵ 0.03 – 0.12 – – – – – –
35.018 1810 -Myrcene B 1.11×10⁶ 0.05 1.82×10⁵ 1.91 4.36 105 0.02 2.86 105 0.04 2.80×10⁶ 0.11
35.554 1821 Octan-1-ol B 1.91×10⁵ 0.01 – 0.04 – – – – – –
38.028 1868 2-Methyl decanoic acid B – – 2.02×10⁵ 0.06 – – – – 3.97×10⁵ 0.01
41.49 1935 Ethyl decanoate B 2.99×10⁸ 10.72 3.46×10⁸ 0.75 6.42×10⁸ 30.37 2.46×10⁸ 22.37 9.90×10⁸ 37.51
43.013 1965 3-Methyl octanoate A, B 3.05×10⁶ 0.11 2.22×10⁶ 0.17 6.40×10⁷ 2.74 2.12×10⁶ 0.20 – –
44.533 1993 Diethyl succinate A, B 1.60×10⁶ 0.06 1.62×10⁶ 1.01 3.03×10⁶ 0.13 1.77×10⁶ 0.18 1.20×10⁶ 0.05
45.356 2010 Ethyl 9-decenoate B 3.13×10⁷ 1.13 2.51×10⁷ 0.56 2.49×10⁸ 10.73 1.23×10⁶ 0.17 1.62×10⁷ 0.61
47.341 2049 TDNf A, B 4.78×10⁵ 0.02 5.20×10⁵ 0.19 6.50×10⁵ 0.03 – – 1.40×10⁶ 0.05
51.047 2124 2,3-Dihydrofuran A, B 1.78×10⁵ 0.01 – 0.18 – – 1.61×10⁶ 0.03 – –
53.668 2182 2-Phenylethyl acetate B 4.48×10⁵ 0.02 7.69×10⁵ 1.50 1.61×10⁶ 0.07 1.19×10⁷ 0.03 1.74×10⁶ 0.07
56.601 2246 Ethyl dodecanoate B 2.92106 0.10 1.01 106 2.60 1.19×10⁷ 0.64 3.57×10⁶ 0.24 2.17×10⁷ 0.73
56.989 2255 Hexanoic acid B 7.47×10⁵ 0.03 – 3.98 1.69×10⁶ 0.08 – – 2.64×10⁶ 0.10
57.821 2273 3-Methyl pentanoate A, B – – – – 9.39×10⁵ 0.05 – – – –
60.454 2328 ˇ˜-Phenylethanol B 1.69×10⁶ 0.06 1.92×10⁶ 0.33 5.57×10⁶ 0.24 3.42×10⁶ 0.35 1.92×10⁶ 0.07
61.183 2343 TBMPg B – – – – 2.99 106 0.01 2.99 105 0.02 – –
T able 6 ( Continued ) R T (min) KI a Compounds Identity b WW1 WW2 WW3 WW4 WW5 A v er a g e peak ar ea RP A c(%) A v er a g e Peak ar ea RP A (%) A v er a g e peak ar ea RP A (%) A v er a g e peak ar ea RP A (%) A v er a g e peak ar ea RP A (%) 81.808 2761 Decanoic acid A, B 1.30 × 10 6 0.05 7.40 × 10 6 0.04 7.44 10 6 0.37 2.8610 6 0.26 1.40 × 10 7 0.59 T otal compounds identified per wine 33 26 31 27 33 Sum 2.19 × 10 9 1.31 × 10 9 2.27 × 10 9 1.04 × 10 9 2.64 × 10 9 R.S .D . (%) on sum ( n=4 ) 0.542 6.07 6.88 6.25 6.61 aExperimentall y determined K o v `ats indices on the BP-20 column, relati v e to C8 –C 20 h ydr ocarbons. b A, components identified on the basis of the retention time and EI mass spectr a of pur e standar d; B , components identified on the basis of their EI mass spe ctr a onl y. c Per cent relati v e ar ea. d Not detected. e ( S )-(+)-3-Hydr o xytetr ah ydr ofur an. f 1,1,6-trimeth yl-1,2-dih ydr o-naphtalene . g 2,6-Di-tertbutyl-4-meth ylphenol.
wines were 1,1,6-trimethyl-1,2-dihydronaphtalene (TDN) and
-damascenone. The presence of C13-norisoprenoids, TDN
and-damascenone, is also considered to be a quality
fac-tor, as they supply an agreeable scent of flowers, fruits, tea, honey-like, black currant or cassis notes, except for TDN that exhibits a kerosene-like odour. They are present in free and odourless glycosidically bound forms in grapes and wines, and can be released liberated by acid catalysed hydrolysis during conservation.
3.2.2. Beer volatile profile
As shown in Table 7, a total of 64 volatile and
semi-volatile organic compounds belonging to several chemical classes were positively identified in the five beer sam-ples. Fifteen of these volatiles: 2-methyl-1-propanol, isoamyl acetate, 3-methyl-1-butanol, ethyl hexanoate, heptyl acetate, ethyl octanoate, octyl acetate, linalool, ethyl decanoate,
3-methyl butanoic acid, 2-phenylethyl acetate,-phenylethanol,
octanoic acid and decanoic acid, were detected in all
sam-ples (Table 7) but the ratio between the single components
were different for each beer. Some of these 15 compounds, such as isoamyl acetate, hepty acetate, octyl acetate, linalool
and-phenylethanol, have been reported as common
compo-nents of different beer types[22,23]. A characteristic GC–qMSD
profile of each beer obtained with DVB/CAR/PDMS using the
experimental conditions discussed above is shown inFig. 6.
Table 7summarises the average (n = 4) relative composition determined in investigated beers. The relative composition of every flavour compound was calculated as the percent ratio of the respective peak area relative to the total peak area (RPA, %). Fig. 7presents the distribution of compound classes by beer
sample. As shownFig. 8, ethyl esters followed by higher
alco-hols were the most abundant compound classes. Ethyl esters are characterised by their fruity flavour and plays an impor-tant role in the overall flavour balance. The main esters of the
HS-SPMSDVB/CAR/PDMS samples of beer were ethyl octanoate,
ethyl decanoate, ethyl hexanoate, ethyl dodecanoate and 2-phenylethyl acetate.
Alcohols contribute to the strong and pungent smell and taste of beer; only ethanol, 2-methyl-butan-1-ol, 3-methylbutan-1-ol, and octan-1-ol were identified in the five beer samples. The higher alcohols (i.e. of higher molecular weight than ethanol) are important as the immediate precur-sors of the more flavour-active esters, so that higher alcohol formation needs regulation to ensure that, in turn, ester pro-duction is controlled.
Acids constitute an important group of aroma compounds that can contribute with fruity, cheesy and fatty odours to beer’s sensory properties. They also contribute to bitterness, adstringency and rancidity. Four from the five acids identified in the five investigated beers: 3-methylbutanoic acid, and C6, C8 and C10 fatty acids were detected in all beer samples in significantly different amounts.
Each beer type showed a typical composition. B1 beer (Fig. 6) is characterised by a high amount of ethyl octanoate, ethyl decanoate, 3-methyl-1-butanol and ethyl hexanoate. Some identified compounds are specific to this sample. There-fore, 3-heptene and 5-hydroxymethylfurfural were identified only in B1 beer sample. This sample is also characterized by
analytica
chimica
acta
6
0
9
(2008)
82–104
30 C; extraction time: 60 min, sample with 30%, w/v NaCl)
RT (min) KIa Compound Identityb B1 B2 B3 B4 B5
Average peak area RPAc(%) Average
Peak area
RPA (%) Average
peak area
RPA (%) Average
peak area
RPA (%) Average
Peak area
RPA (%)
4.479 1075 Ethyl butanoate A, B 4.58×10⁶ 0.46 – – 2.59×10⁶ 0.35 5.50×10⁶ 1.11 4.24×10⁶ 0.58
4.586 1080 Toluene A, B –d – 1.35×10⁶ 0.66 – – – – – –
6.335 1149 2-Methyl-1-propanol A, B 3.65×10⁵ 0.37 6.31×10⁵ 0.30 3.31×10⁶ 0.46 4.49×10⁶ 0.91 3.45×10⁶ 0.48
6.872 1165 Isoamyl acetate A, B 1.32×10⁷ 13.29 1.69×10⁷ 8.19 9.83×10⁷ 13.31 9.89×10⁷ 20.00 1.16×10⁸ 15.96
7.470 1183 p-Xylene A, B – – 5.86×10⁵ 0.28 – – – – – –
7.813 1192 1-Butanol A, B – – – – – – 4.19×10⁵ 0.09 2.02×10⁵ 0.03
8.120 1200 Butanal A, B – – 8.97×10⁴ 0.04 – – – – – –
8.383 1207 -Myrcene B – – – – 2.15×10⁵ 0.03 – – 1.80×10⁵ 0.02
9.518 1233 2-Ethylhexanal B – – 6.60×10⁵ 0.32 – – – – – –
9.575 1234 BMECBe B 1.72×10⁵ 0.02 – – – – – – – –
9.794 1239 Pentyl propenoate B – – – – – – – – 3.02×10⁵ 0.04
9.800 1239 Limonene A, B – – 7.15×10⁴ 0.04 1.21×10⁵ 0.02 – – – –
10.889 1268 3-Methyl-1-butanol A, B 8.04×10⁷ 8.06 2.42×10⁷ 11.59 6.72×10⁷ 9.28 9.75×10⁷ 19.77 7.61×10⁷ 10.49
12.098 1293 Ethyl hexanoate A, B 6.55×10⁷ 6.57 6.92×10⁶ 3.39 4.14×10⁷ 5.60 4.59×10⁷ 9.28 3.66×10⁷ 5.00
13.154 1315 3-Octanone B – – 2.39×10⁵ 0.10 – – – – – –
13.763 1328 -Cymene B – – 1.44×10⁵ 0.07 – – – – – –
14.389 1340 Hexyl acetate A, B 1.15×10⁶ 0.12 5.47×10⁵ 0.27 – – 1.07×10⁶ 0.22 9.56×10⁵ 0.13
15.283 1357 (Z)-2-Hexene B – – 3.27×10⁵ 0.14 – – – – 5.23×10⁵ 0.07
17.384 1393 Ethyl 3-hexenoate B – – – – – – 1.48×10⁵ 0.03 – –
18.137 1407 2-Methylfuran B – – 3.26×10⁵ 0.16 – – – – – –
18.374 1412 Ethyl heptanoate A, B 9.17×10⁵ 0.09 – – 7.94×10⁵ 0.11 – – 2.49×10⁵ 0.03
19.996 1442 2-Propenal B – – – – – – 2.09×10⁵ 0.03 8.73×10⁴ 0.01
20.010 1443 4-Methyl-1-pentanol A, B – – 1.24×10⁵ 0.06 – – – – – –
21.283 1466 Heptyl acetate A, B 3.54×10⁶ 0.36 7.83×10⁵ 0.39 5.23×10⁶ 0.71 4.98×10⁵ 0.10 1.02×10⁶ 0.14
22.440 1486 (E)-2-Nonen-1-ol B – – 1.21×10⁶ 0.48 8.10×10⁵ 0.12 8.42×10⁵ 0.17 8.99×10⁵ 0.12
22.424 1486 3-Heptene A, B 1.37×10⁵ 0.01 – – – – – – – –
25.669 1543 Ethyl octanoate B 4.36×10⁸ 43.73 1.57×10⁷ 9.00 2.69×10⁸ 35.50 5.41×10⁷ 10.92 2.48×10⁸ 33.22
26.369 1555 Isomenthone B – – – – – – 7.10×10⁵ 0.14 – –
27.582 1576 1-Heptanol B – – – – 2.81×10⁵ 0.04 2.01×10⁵ 0.04 3.00×10⁵ 0.04
27.611 1576 3-Methylhepthyl acetate B – – – – – – – – 7.72×10⁵ 0.13
27.810 1579 Guaiacol A, B 1.05×10⁶ 0.11 – – 1.46×10⁶ 0.23 1.85×10⁶ 0.41 2.86×10⁶ 0.38
27.643 1577 3-Methyl-1-hexanol B – – 4.46×10⁵ 0.22 – – – – – –
27.892 1530 Acetic acid A, B – – 8.02×10⁵ 0.39 – – – – – –
28.363 1588 Isomenthone B – – – – – 2.31×10⁵ 0.05 – –
28.951 1598 Octyl acetate B 4.40×10⁶ 0.44 4.38×10⁷ 0.22 3.78×10⁶ 0.50 5.34×10⁵ 0.11 2.13×10⁶ 0.28
30.376 1619 2-Ethyl-1-hexanol B 2.56×10⁶ 0.26 1.20×10⁶ 5.89 3.15×10⁶ 0.44 – – – –
30.403 1620 Decanal B – – – – – – 1.81×10⁶ 0.23 1.02×10⁵ 0.01
33.469 1663 4-Cyclohexylresorcinol A, B 8.14×10⁴ 0.01 – – 1.23×10⁵ 0.02 – – 4.78×10⁵ 0.06
33.596 1664 Ethyl nonanoate A, B 6.52×10⁵ 0.07 – – 5.29×10⁵ 0.05 – – 8.92×10⁵ 0.12
35.001 1683 Linalool A, B 5.15×10⁵ 0.05 1.02×10⁶ 0.50 1.80×10⁵ 0.03 1.14×10⁶ 0.23 1.59×10⁶ 0.22
35.538 1690 1-Octanol A, B – – – – 1.25×10⁶ 0.18 1.82×10⁶ 0.37 – –
analytica
chimica
acta
6
0
9
(2008)
82–104
97
Average peak area RPAc(%) Average
Peak area
RPA (%) Average
peak area
RPA (%) Average
peak area
RPA (%) Average
Peak area
RPA (%)
41.269 1930 Ethyl decanoate B 9.11×10⁷ 9.10 3.73×10⁵ 0.15 6.87×10⁷ 9.22 9.37×10⁶ 1.89 4.86×10⁷ 6.37
42.424 1953 Ethyl benzoate B 1.59×10⁵ 0.02 – – 1.59×10⁵ 0.02 – – – –
42.899 1963 Isopentyl hexanoate B – – – – 2.90×10⁵ 0.04 – – – –
43.14 1967 Citronellyl butyrate B 8.63×10⁵ 0.09 – – 6.07×10⁵ 0.08 – – 9.33×10⁵ 0.12
43.484 1974 2-Furanmethanol B 6.66×10⁵ 0.07 – – 6.02×10⁵ 0.08 3.43×10⁵ 0.07 2.85×10⁵ 0.06
43.506 1974 3-Methyl-2(5H)-furanone B – – 3.36×10⁵ 0.19 – – – – – –
44.167 1987 3-Methyl pentanoic acid A, B 4.09×10⁵ 0.04 1.77×10⁵ 0.09 2.89×10⁵ 0.04 4.14×10⁵ 0.08 1.29×10⁵ 0.04
44.631 1995 3-Methyl-1-hexanol A, B – – – – – – – – 1.29×10⁵ 0.02
44.647 1996 Decyl acetate A, B 4.77×10⁵ 0.05 – – 5.32×10⁵ 0.07 – – – –
45.415 2011 Ethyl 9-decenoate B 1.67×10⁷ 1.67 – – 9.90×10⁶ 1.33 6.03×10⁵ 0.12 6.05×10⁶ 0.79
48.723 2076 Cadinene B – – – – – – – – 1.14×10⁵ 0.03
50.995 2123 1-Decanol A, B 9.64×10⁵ 0.10 – – 1.14×10⁶ 0.16 3.23×10⁵ 0.07 7.03×10⁵ 0.09
51.255 2129 1,7-Heptanediol B – – – – – – – – 3.11×10⁵ 0.04
53.679 2182 2-Phenyl ethyl acetate A, B 3.62×10⁷ 3.63 3.74×10⁶ 2.13 3.79×10⁷ 5.50 4.35×10⁷ 8.85 7.32×10⁷ 10.34
56.565 2245 Ethyl dodecanoate B 1.98×10⁶ 0.20 – – 1.37×10⁵ 0.02 2.80×10⁵ 0.06 2.12×10⁵ 0.02
57.025 2255 Hexanoic acid B 3.98×10⁶ 0.40 1.14×10⁶ 0.68 3.47×10⁶ 0.51 2.45×10⁶ 0.50 2.71×10⁶ 0.37
60.438 2327 Phenylethyl alcohol B 4.09×10⁷ 4.11 8.24×10⁶ 4.13 4.95×10⁷ 7.22 8.01×10⁷ 16.26 6.97×10⁷ 9.47
63.821 2395 Phenylethyl isobutyrate B 4.91×10⁵ 0.05 – – 4.70×10⁵ 0.04 – – – –
71.569 2525 Octanoic acid A, B 4.24×10⁷ 4.26 8.93×10⁶ 5.53 3.43×10⁷ 5.16 1.49×10⁷ 3.06 2.14×10⁷ 2.79
78.259 2587 2-Methoxy-4-vinylphenol A, B 2.39×10⁵ 0.02 – – – – – – 2.61×10⁵ 0.04
81.772 2761 Decanoic acid B 7.17×10⁶ 0.72 2.84×10⁶ 1.95 6.40×10⁶ 0.91 3.86×10⁶ 0.79 3.66×10⁶ 0.43
88.545 2283 5-Hydroxymethylfurfural B 3.60×10⁵ 0.04 – – – – – – – –
Total compounds identified per beer 35 32 35 31 40
Sum 1.99×10⁹ 1.99×10⁸ 7.36×10⁸ 4.93×10⁸ 7.50×10⁸
R.S.D. (%) on sum (n =4) 10.2 11.0 6.59 9.32 12.34
a Experimentally determined Kov `ats indices on the BP-20 column, relative to C
8–C20hydrocarbons.
b A, components identified on the basis of the retention time and EI mass spectra of pure standard; B, components identified on the basis of their EI mass spectra only. c Percent relative area.
dNot detected.
B2 (Fig. 6) is characterised by a high amount of octyl acetate. This compound was identified in each analysed beer, but at lower levels. Also 3-methyl-1-butanol, isoamyl acetate and ethyl octanoate, are present in significantly higher amounts,
when compared to B1, B3, B4 and B5 beer samples.p-Xylene,
butanal, 2-ethyl-hexanal, 3-octanone, -cymene, 2-methyl
furan and 3-methyl-2(5H)-furanone, are only present in B2 beer type.
In B3 beer, 35 volatile and semi-volatile organic
com-pounds were identified. AsFig. 6 shows, the most intense
peaks correspond to ethyl octanoate, isoamyl acetate, ethyl decanoate, 3-methyl-1-butanol, ethyl hexanoate and 2-phenylethyl acetate. Isopentyl hexanoate can be used to dif-ferentiate this beer type from B1, B2, B4 and B5 samples, since it was the only beer where this compound was detected at high
levels. Isoamyl acetate, 3-methyl-1-butanol,-phenylethanol,
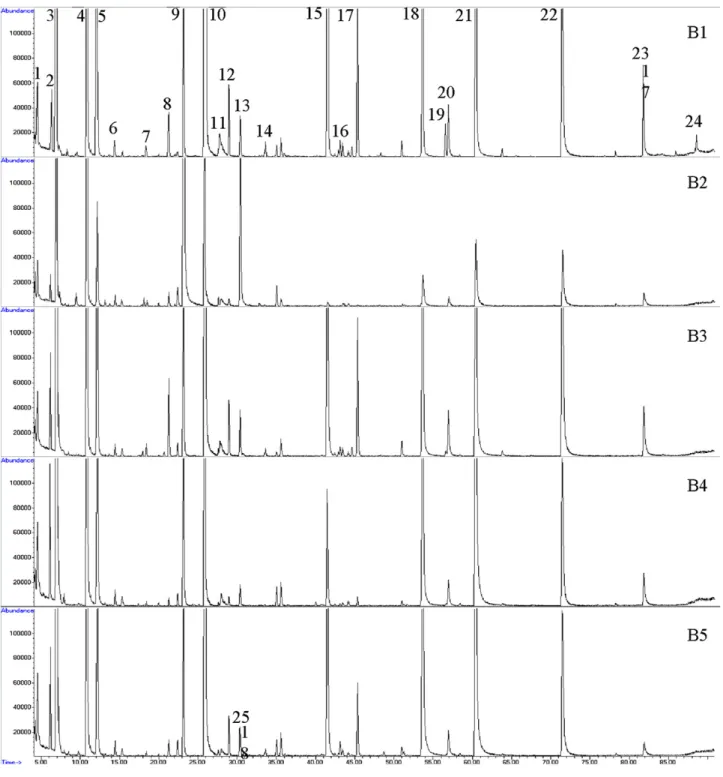
Fig. 6 – GC–qMSD profile of the different beers after headspace SPME using DVB/CAR/PDMS fibre (extraction temperature: 30◦C; extraction time: 60 min; 30% (w/v) NaCl; stirring: 750 rpm). Peak identification: (1) ethyl butanoate; (2)