J. Serb. Chem. Soc. 80 (8) 983–996 (2015) UDC 637.12+66.061+547.584–326:
JSCS–4774 543.544.3:543.51
Original scientific paper
Evaluation of a method for phthalate extraction from milk
related to the milk dilution ratio
DANICA S. MILOJKOVIĆ1#, DARKO H. ANĐELKOVIĆ1#, GORDANA M. KOCIĆ2 and TATJANA D. ANĐELKOVIĆ1#*
1Faculty of Sciences and Mathematics, University of Niš, Višegradska 33, 18000 Niš, Serbia
and 2Faculty of Medicine, University of Niš, Bulevar dr Zorana Đinđića 81, 18000 Niš, Serbia (Received 4 December 2014, revised 26 February, accepted 19 March 2015)
Abstract: Liquid–liquid extraction techniques coupled with gas chromato-graphy–mass spectrometry (GC–MS) were compared for the extraction and the determination of four phthalates: dimethyl phthalate (DMP), di-n-butyl phthal-ate (DBP), benzyl butyl phthalphthal-ate (BBP) and di-(2-ethylhexyl) phthalphthal-ate (DEHP) in six different kinds of milk-based samples. Extraction factors: sample preparation, organic solvent type and volume, salt effect, agitation and the extraction time were optimized. The ions of the base peak (m/z 149 for DBP, BBP and DEHP and m/z 163 for DMP) for the investigated phthalates were selected for the screening studies. The acquisition was performed in the selected ion-monitoring mode. The response of the mass selective detector (MSD) for GC–MS phthalate calibration standards was linear between 0.25 and 2.50 µg mL-1 with calculated limit of detection (LOD) values between 0.01 to 0.04 µg mL-1 and limit of quantitation (LOQ) values of 0.05 to 0.12 µg mL-1, while repeatability was between 1.7 to 4.9 % relative standard deviation (RSD). The study demonstrated an increase in the recovery of less polar phthalates in matrix milk standards on matrix dilution. Recovery for hydrophilic phthalates, such as DMP, was not changed by matrix dilution and it was continuously low for the investigated method. Two spiking levels, tested for the influence of matrix dilution on phthalate recovery, showed the same trend.
Keywords: extraction efficiency; phthalate esters; gas chromatography-mass spectrometry; milk samples.
INTRODUCTION
Phthalates present one of the ubiquitous chemicals in the environment. Since
their usage is mainly as plasticizers for polymers, such as poly(vinyl chloride)
(PVC), over one million tons of phthalates are produced in western Europe each
year.
1The most important congeners are: di-2-ethylhexyl phthalate (DEHP),
* Corresponding author. E-mail: tatjanaan@gmail.com # Serbian Chemical Society member.
which accounts for about 50 % of the world production of phthalates,
1dimethyl
phthalate (DMP), di-
n
-butyl phthalate (DBP) and benzyl butyl phthalate
(BBP),which is prohibited by the EU in toys and childcare articles if they could
be placed in the mouth by children.
2Phthalates have long been considered to be
potential endocrine disrupters, and several of them have shown reproductive
effects in animals.
3–5The structures of the four studied phthalates as the most commonly used
phthalate esters based on the 1,2-benzenedicarboxylic acid are given in Fig. S-1
of the Supplementary material to this paper.
The permanence of phthalates in polymer materials is low because
phthal-ates are not chemically bound to the polymer. Their migration from
food-pack-aging materials was reported as a route for food contamination with phthalates.
Since food is one of the major sources of human exposure to phthalates, in order
to assess human exposure to these substances, monitoring of phthalates levels in
various foods should be performed. Fatty and oily foods are primarily
contamin-ated with phthalates due to their lipophilic character.
6Although human intake of
phthalates may originate from many food sources and routes, there is a special
interest in monitoring the contamination of milk and milk products because they
constitute a primary food source, especially for children. Tolerable daily intakes
(
TDI
) were specified by the European Food Safety Authority (EFSA) for several
phthalates, and they are 0.01, 0.05 and 0.5 and mg kg
–1body weight day
–1for
DBP, DEHP and BBP, respectively.
7–9The physicochemical properties of
phthal-ates (Table S-I of the Supplementary material) and their amount and frequency of
usage in food-packaging materials could determine their migration and leaching
levels and thus the possibility of food contamination and human exposure.
The majority of publications deal with phthalate determination in simple
matrices, such as water
10–12or biological fluids,
13while publications about
phthalates in food samples with fatty matrices
14–16are less frequent. Due to
usually low level of phthalates and generally high complexity of the matrices of
food sample, extraction and clean up of the sample are usually considered as
necessary and critical steps in phthalate determination.
However, as indicated in this paper, the crucial point in phthalate extraction
from complex milk matrices is considered the choice of solvent for the extraction
and sample dilution step. The influence and importance of these two aspects on
the recovery of phthalates, as well as analytical methodology (agitation method,
extraction time,
etc
.) are considered herein.
from milk could alternatively be achieved by precipitation of milk proteins by
addition of NaCl for salting-out followed by the addition of acetonitrile
17or
through primary addition of acetone or an alcohol.
18Gel permeation
chromato-graphy (GPC) is often used for this purpose.
6,19When the sample is extracted
with polar solvents, such as methanol or acetonitrile, the extract contains other
interfering organic impurities in addition to fat. These may require solid-phase
extraction (SPE) on different sorbents.
20–22In each of these sample preparation
steps, the possibility of contamination of the sample is high because even in pure
solvents, solid phase extractants, laboratory water, laboratory air and laboratory
glassware, phthalates could be detected.
23This can be negligible source of
con-tamination that could be reduced by establishing whether the reduction of the
accuracy of phthalate determination is higher due to phthalate contamination of
the sample by using clean-up procedures or due to the complexity of co-eluting
substances, which could influence the sensitivity of phthalate determination by
MS analysis.
Since the extraction procedure could be the source of a matrix effect and is
an essential step in the evaluation process of phthalate determination, different
liquid solvents and solvent mixtures were investigated in this study regarding the
extraction efficiency of phthalates, the possibility of phase separation, visibility
of phase separation, clearness of the extracts, formation of emulsions, availability
of reagents and duration of the extraction. In addition to the selection of the
solvent type, different methods/procedures for extraction were also investigated
in order to obtain the most optimal method for the extraction phthalates from
milk and dairy products.
Bearing in mind that in milk with high fat content, phthalates cannot be
easily extracted due to phospholipid–protein membranes that encapsulate the fat
droplets containing lipophilic phthalate, dilution of milk samples prior to the
analysis could enable a better extraction efficiency of phthalates and relatively
clean extracts to be obtained. Moreover, sample dilution is an easy and effective
method to reduce interfering compounds and to diminish the matrix effect. The
obtained extracts, even without a clean-up step, could be used for GC–MS
anal-ysis, as shown herein.
EXPERIMENTAL Reagents and materials
All reagents and water used for the analyses were checked for contamination with phthalates. To avoid phthalate contamination, all the employed laboratory dishes were made of glass, previously washed with water and soap, tap and ultrapure water, rinsed with acetone and n-hexane and dried at 200 °C in a clean oven for 4 h.23
All stock, intermediate and working solutions were prepared in n-hexane. Individual stock solutions of each phthalate were prepared at a concentration of 1000 µg mL-1 and stored at 4 °C. The stock solutions were stable for up to one month. A mixed stock solution of phthalates was prepared at a concentration of 100 µg mL-1 for each phthalate. With stepwise dilutions, individual working solutions of 1 µg mL-1 were obtained for each phthalate to iden-tify their retention times. The working solutions were stable for 10 days. Furthermore, the mixed working solutions of all phthalates at 0.25, 0.50, 1.00, 1.50 and 2.50 µg mL-1 were also prepared as calibration standards with DBA as the internal standard at a concentration of 1 µg mL-1. Between some other commonly used internal standards, such as benzyl benzoate20 or isotope-labeled standards, DBA was adopted as an internal standard being approved for this purpose according to our findings and literature data.24
The calibration curves were linear in the range from 0.25 to 2.5 µg mL-1 with correlation coefficients higher than 0.990. The linear dynamic range was broader and covered the range from 2.50 to 50 µg mL-1. Samples of nine systems of commercial milk-based samples diluted with water, from 0 to 50vol. %, were all spiked phthalates at two concentration levels, 3.0 and 6.0 µg mL-1.
Dairy samples
Optimization of the phthalate liquid–liquid extraction procedure was realized using six samples of dairy products: raw bovine milk, commercial (pasteurized) milk, thawed milk, whey, human milk and yogurt. Samples of raw bovine milk were collected in glass bottles from a dairy farm in south Serbia avoiding any contact with plastic materials. This milk had not been pasteurized before analysis and was used as collected. Samples of commercial milk from a Serbian dairy were purchased at Serbian market and used as received. The commercial milk was bottled in a plastic (polyethylene terephthalate, PET) bottle.6 The shelf life of milk is 10 days after packaging and the milk was used within this period. Thawed commercial milk was obtained after thawing overnight the milk that had been frozen for 24 h in the original packing. Whey produced in a cheese manufacturing process was purchased from the same dairy farm as the raw bovine milk. Samples of human milk were collected in three successive days by a postpartum 35-year old woman (5th week postpartum). Milking was carried out manually, with previously cleaned breasts and hands, directly into a glass container that was intended for this purpose. The yogurt used in this study was made from cow's milk, com-mercially available from a Serbian market and stored in a plastic (PET) bottle.
All nine systems of commercial milk-based samples diluted with water were used for the selection of optimum solvent type as extractant considering the possibility of phase separ-ation, visibility of phase separsepar-ation, clearness of the extracts, formation of emulsion, avail-ability of the reagents and duration of extraction. In addition to selection of the solvent type, different methods/procedures for extraction were also investigated in order to obtain the most optimal method for the extraction of phthalates from milk and dairy products.
For the determination of extraction efficiency of phthalates in milk, only the commercial milk was used. The milk was diluted with water from 0 to 50 vol. %.
GC–MS analysis
Gas chromatographic analysis was performed on a gas chromatograph 6890 (Hewlett- -Packard) equipped with a mass selective detector (MSD) 5973 (Agilent) and a DB-5 MS capillary column (30 m×250 mm×0.25 mm). The mass spectra were recorded under an electron impact ionization voltage of 70 eV. The gas chromatograph was operated in the split less injection mode. The oven temperatue was programmed from 60 °C (1 min) to 220 °C (1 min) at a rate of 20 °C min-1 and then to 280 °C (4 min) at a rate of 5 °C min-1. The MSD was used in the single ion-monitoring mode (SIM) at m/z 149 and 163. The identification and quantification of target compounds was based on the relative retention time, the presence of target ions and their relative abundance. The target ion was m/z 149 for DBP, BBP and DEHP and m/z 163 for DMP. Linearity was investigated in the range 0.25–2.5 µg mL-1. The linear dynamic range for the investigated phthalates by GC–MS was 0.25–50 µg mL-1. The limit of detection (LOD) and limit of quantitation (LOQ) for each phthalate were calculated from six replicated measurements of a low concentration spiked standard solution according to the Analytical Detection Limit Guidance from the Wisconsin Department of Natural Resources.25
The laboratory contamination was monitored with blank samples obtained from Milli-Q water treated in the same manner as the milk samples.
Extraction procedures
Fourteen extraction procedures were examined. Each entailed different conditions (type of extractant, extraction time, agitation and settling). Two solvent mixtures were studied for extraction, acetone/n-hexane at a 1:1 volume ratio and methanol/n-hexane at a 1:3 volume ratio. The salting out effect was examined using acetonitrile as the extraction agent with the addition of NaCl to saturation. The liquid–liquid extractions for these three systems were performed by adding a volume of the extraction agents to a volume of sample in a 2:1 ratio, followed by vigorously hand shaking for 1 h and left standing for 24 h. In extraction methods using ethyl acetate, n-hexane, acetonitrile, acetone, dichloromethane, dichloroethane, tri-chloroethylene and trichloroethane, the volume ratio of the extraction agent to a milk sample was 2:1, agitation was performed in an ultrasonic bath for 1 h and hand-shaking for 1 h. The extractions with extractants soluble in the feed solution, i.e., acetone and alcohols (ethanol, methanol and 2-propanol), the volume ratio of extractant to sample was also 1:2, agitation in an ultrasonic bath for 1 h and standing overnight at room temperature were applied.
RESULTS AND DISCUSSION
GC–MS acquisition
The retention times, selected masses and the scan start times for each
phthal-ate studied by GC–MS are listed in Table I.
TABLE I. Target ions, retention times and scan start times for the investigated phthalates determined by GC-MS; target ions observed in SIM are shown in bold
Phthalate m/z Retention time, min Scan start time, min
DMP 163, 194 8.03 7.80
DBP 149, 150, 223, 205 11.57 11.20
BBP 149, 91, 206, 238 16.02 15.50
DEHP 149, 167, 279, 150 18.39 17.90
Optimization of extraction procedure
The choice of the optimum extraction solvent for separation was determined
from a consideration of several criteria: high boiling point and a low vapor
pres-sure in order to reduce the risk of evaporation, high selectivity that enables fewer
stages to be used, insolubility of solvent for prevention of solvent losses, good
chromatographic behavior, and high partitioning coefficient of the analyte. Based
on these considerations, several extraction solvents and mixture of solvents were
investigated. As milk forms stable emulsions with the majority of solvents, all the
investigated extractants were characterized by the appearance of extract and
raf-finate, the possibility to define the phase boundary, the possibility to perform
phase separation, clearness of the extracts and formation of emulsions. Among
the investigated solvents and solvent systems,
n
-hexane presented the best
ext-ractant because it gave a homogenous and clear extract with precipitated raffinate
phase, thus a well-defined interfacial boundary and the possibility to separate the
phases (Table II).
Agitation of samples with extractants enhanced the extraction efficiency and
reduced the extraction time for reaching the equilibrium. In this study, stirring,
shaking and ultrasonic treatment were investigated for the extraction of the
phthalates from nine milk-based samples. Too vigorous agitation was avoided
since it produced stable emulsions without visible phase boundary and the
pos-sibility of phase separation. In order to achieve effective phase separation,
shak-ing of the samples and extractants was chosen as the best agitation method.
The extraction time to obtain higher peak areas of phthalates relative to
internal standard peak area was investigated in the range of 10 to 30 min. An
extraction time of 15 min was selected for extraction since the systems reached
the steady state during this period.
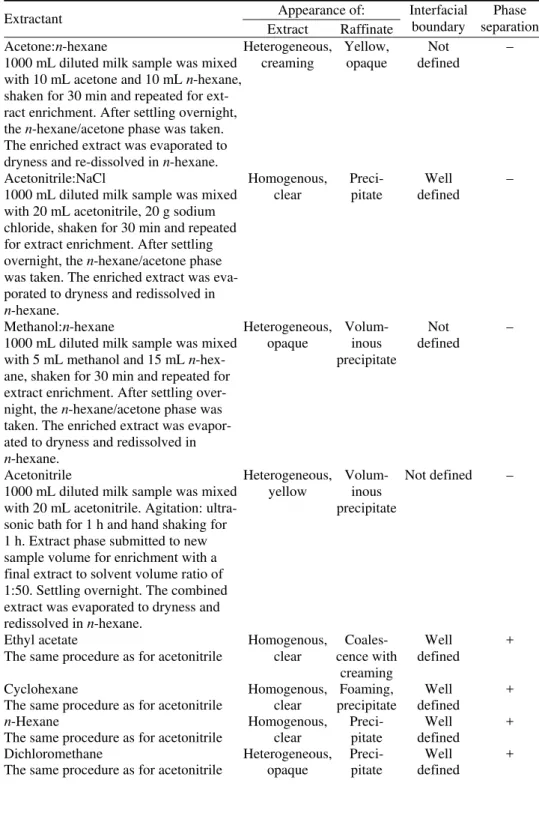
TABLE II. Extraction systems studied for phthalate extraction from milk-based samples
Extractant Appearance of: Interfacial boundary separation Phase Extract Raffinate
Acetone:n-hexane
1000 mL diluted milk sample was mixed with 10 mL acetone and 10 mL n-hexane, shaken for 30 min and repeated for ext-ract enrichment. After settling overnight, the n-hexane/acetone phase was taken. The enriched extract was evaporated to dryness and re-dissolved in n-hexane.
Heterogeneous, creaming Yellow, opaque Not defined – Acetonitrile:NaCl
1000 mL diluted milk sample was mixed with 20 mL acetonitrile, 20 g sodium chloride, shaken for 30 min and repeated for extract enrichment. After settling overnight, the n-hexane/acetone phase was taken. The enriched extract was eva-porated to dryness and redissolved in n-hexane. Homogenous, clear Preci- pitate Well defined –
Methanol:n-hexane
1000 mL diluted milk sample was mixed with 5 mL methanol and 15 mL n -hex-ane, shaken for 30 min and repeated for extract enrichment. After settling over-night, the n-hexane/acetone phase was taken. The enriched extract was evapor-ated to dryness and redissolved in n-hexane. Heterogeneous, opaque Volum-inous precipitate Not defined – Acetonitrile
1000 mL diluted milk sample was mixed with 20 mL acetonitrile. Agitation: ultra-sonic bath for 1 h and hand shaking for 1 h. Extract phase submitted to new sample volume for enrichment with a final extract to solvent volume ratio of 1:50. Settling overnight. The combined extract was evaporated to dryness and redissolved in n-hexane.
Heterogeneous, yellow
Volum-inous precipitate
Not defined –
Ethyl acetate
The same procedure as for acetonitrile
Homogenous, clear Coales-cence with creaming Well defined + Cyclohexane
The same procedure as for acetonitrile
Homogenous, clear Foaming, precipitate Well defined + n-Hexane
The same procedure as for acetonitrile
Homogenous, clear Preci- pitate Well defined + Dichloromethane
The same procedure as for acetonitrile
TABLE II. Continued
Extractant Appearance of Interfacial boundary separation Phase Extract Raffinate
Trichloroethane
The same procedure as for acetonitrile
Heterogeneous, opaque
Preci-pitate
Well defined
+
Dichloroethane
The same procedure as for acetonitrile
Heterogeneous, opaque
Preci-pitate
Well defined
+
Extractants soluble in feed solution Appearance of extract and raffinate Interfacial boundary separation Phase
Methanol Heterogeneous,
volum-inous precipitate, flocculation
Not defined
–
Ethanol –
2-Propanol –
Acetone –
tory method due to low phase separation and adhesion of milk globules on the
wall of the separation funnel.
Based on literature data, the effect of the sample to solvent ratio on the total
extracted phthalates from milk products was found to be the best at the 1:20
level. Various amounts of a mixture of solvents were used in order to determine
the optimum quantity of the extracting solvent, based on the appearance of
ext-ract, phase boundary and possibility of phase separation.
27This work showed that due to dilution of milk samples, the satisfactory ratio
of solvent to sample volume was found to be at the 1:50 level, when the extract
phase is several times submitted to a new sample volume, leading to better
con-centration of analyte and reduction in solvent consumption. In this way,
enrich-ment of the extract phase with phthalates could be achieved by repeating the
extraction procedure.
The study showed that the influence of milk type was not a critical factor in
the determination of an adequate extraction procedure. All the observed effects
for optimization of the extraction procedure were more or less the same for all six
investigated samples of dairy products. Based on all the obtained results and
observations during optimization of the extraction procedure, the parameters that
provided the most efficient phthalate extraction were: ratio of sample volume to
solvent volume, 1:2; the procedure of enrichment of the extract phase by
submit-ting the extract to a new sample volume, to obtain a final extract to sample ratio
1:50, leading also to a reduction in solvent consumption; shaking as agitation
method in order to avoid the formation of stable emulsions and an extraction time
in the range 15 to 30 min.
Phthalate analysis in standard
n
-hexane solutions
and respective correlation coefficients (
R
2) calculated in the range 0.25–2.50 µg
mL
–1, the
LOD
and the
LOQ
values for each phthalate investigated in this study
and determined by GC–MS (in SIM mode) are reported in Table III. The
R
2values for all the phthalates in the linear range were above 0.990. The
LOD
and
LOQ
values of each phthalate analyzed in this study were adequate for estimating
such compounds in milk samples: the
LOD
values ranged between 0.01 and 0.04
µg mL
–1whereas
LOQ
values ranged between 0.05 and 0.12 µg mL
–1with
RSD
values between 1.7–4.9 %. These values were determined according to the Knoll
definition,
28i.e.
, an analyte concentration that produced a chromatographic peak
equal to three times (
LOD
) and seven times (
LOQ
) the standard deviation of the
baseline noise. In comparison with other extraction methods, this method
pro-vided comparable
LOD
and
LOQ
values.
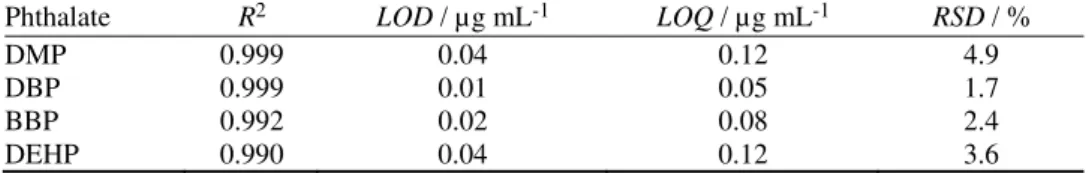
11,19TABLE III. Linearity range and the respective values of correlation coefficients (R2), LOD and LOQ values, and repeatability (RSD) of each phthalate; linearity range: 0.25–2.50 µg mL-1 Phthalate R2 LOD / µg mL-1 LOQ / µg mL-1 RSD / %
DMP 0.999 0.04 0.12 4.9
DBP 0.999 0.01 0.05 1.7
BBP 0.992 0.02 0.08 2.4
DEHP 0.990 0.04 0.12 3.6
Phthalate analysis in matrix extracts
Validation of the phthalate quantification method in milk samples,
consider-ing the possible matrix effect, was performed with successive milk dilution. The
high percentage of fat in milk may affect on the one hand the extraction
effi-ciency of the phthalates and the analytical sensitivity, precision and stability of
the response of the chromatographic system on the other. Therefore, for an
esti-mation of the correlation of the milk fat content with the recovery for each
phthalate, milk samples with different level of dilution were spiked and
exam-ined. For an estimation of the analytical sensitivity, the slopes of the curves
obtained for diluted milk samples spiked with phthalates were examined and
com-pared to the slopes of the calibration curves of phthalate standards in
n
-hexane.
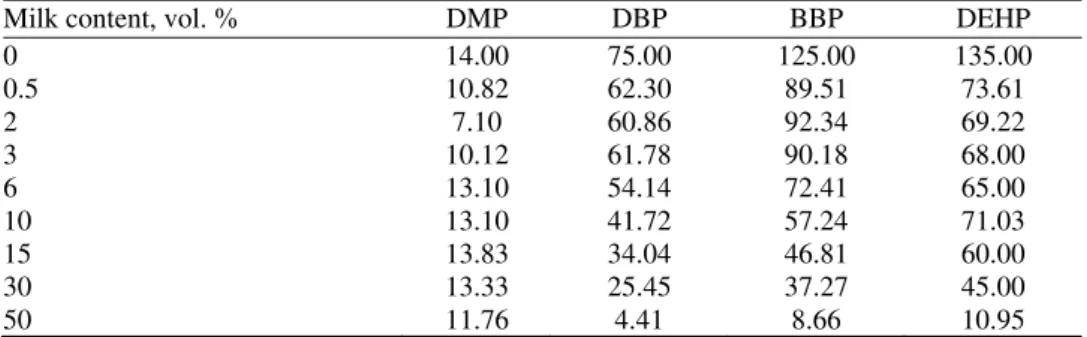
TABLE IV. Phthalates recoveries (%) from spiked diluted milk samples with 3 ppb of each phthalate
Milk content, vol. % DMP DBP BBP DEHP
0 14.00 75.00 125.00 135.00
0.5 10.82 62.30 89.51 73.61
2 7.10 60.86 92.34 69.22
3 10.12 61.78 90.18 68.00
6 13.10 54.14 72.41 65.00
10 13.10 41.72 57.24 71.03
15 13.83 34.04 46.81 60.00
30 13.33 25.45 37.27 45.00
50 11.76 4.41 8.66 10.95
The lowest recovery values were for DMP which is the phthalate with the
lowest molar mass, only one carbon atom in hydrocarbon side chain and with
even 10
3times higher water solubility than the rest of investigated phthalates.
Generally, higher recovery is observed for the high-molecular weight phthalates
(log
K
ow= 7.6 for DEHP), while low-molecular weight phthalates are more
water-soluble relatively hydrophilic and thus the recovery decreases (log
K
ow=
= 1.5 for DMP). The same trend is observed for lower spike phthalate
concen-tration of 3 ppb (Table IV) and for higher spike phthalate concenconcen-tration of 6 ppb,
as shown in Fig. 1.
(a) (b)
(c) (d)
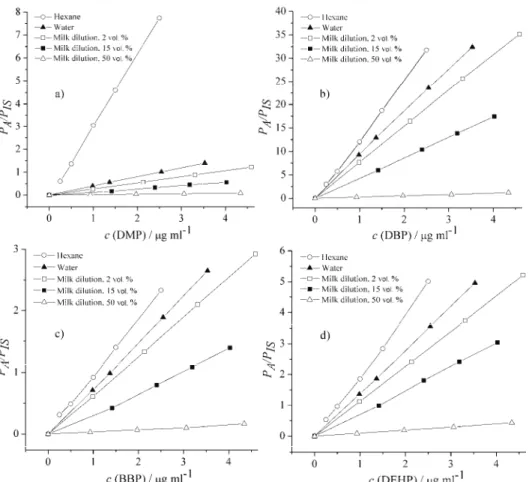
The analytical sensitivity of diluted milk samples spiked with phthalates
were examined and compared to the calibration phthalate standards in
n
-hexane
regarding the slopes of the obtained standard curves (Fig. 2).
Fig. 2. The slopes of the curves for each phthalate prepared in n-hexane and milk matrix: a) DMP, b) DBP, c) BBP and d) DEHP. PA and PIS presents the values for chromatogram peak
are of analyte and internal standard.
The concentrations of phthalates analyzed in the matrix extracts were in
general lower than in
n
-hexane, showing a negative matrix effect that made for a
less stable response of the chromatographic system and lower analytical
sensi-tivity and precision.
dilution of the milk extract, especially for more hydrophobic phthalates such as
the majority of commonly used phthalates.
TABLE V. Slopes of the curve obtained from solvent (n-hexane) and matrix (water and dil-uted milk samples)
Phthalate n-Hexane Water Milk content, vol. %
2 15 50
DBP 12.8829 9.17614 7.6756 4.3494 0.28192
DEHP 1.9924 1.4067 1.135 0.7638 0.099
BBP 0.905 0.75284 0.6380 0.3490 0.0371
DMP 3.1800 0.39551 0.2669 0.14242 0.02068
CONCLUSIONS
The method of extraction of phthalates from milk samples by
n
-hexane was
shown to be a simple and effective procedure. The validation results of the
method were satisfactory, since the recovery data and relative standard deviation
values indicated good method accuracy and precision (
R
2>0.990) for phthalates
when evaluated in a milk matrix. An increase in the recovery of less polar
phthal-ates in matrix milk standards by matrix dilution was observed. Recovery for
hyd-rophilic phthalates, such as DMP, was not changed by matrix dilution and was
continuously low for the investigated method. The same trend for influence of
matrix dilution on phthalate recovery was observed at two phthalate spiking
levels. Elimination of the matrix effect by dilution of the milk extract, especially
for more hydrophobic phthalates such as the majority of commonly used
phthal-ates, was shown to be a satisfactory method.
SUPPLEMENTARY MATERIAL
The chemical structures of the four studied phthalates, GC–MS chromatogram of a standard solution containing phthalates and physicochemical properties of the four studied phthalate esters are available electronically from http://www.shd.org.rs/JSCS/, or from the corresponding author on request.
Acknowledgments. Financial support for this investigation from Ministry of Education, Science and Technological Development of the Republic Serbia, Project TR 31060, is grate-fully acknowledged.
И З В О Д
ЕВАЛУАЦИЈАМЕТОДЕЕКСТРАКЦИЈЕФТАЛАТАИЗМЛЕКАУЗАВИСНОСТИОД САДРЖАЈАМАСТИУМЛЕКУ
ДАНИЦАС. МИЛОЈКОВИЋ1
, ДАРКОХ. АНЂЕЛКОВИЋ1
, ГОРДАНАМ. КОЦИЋ2иТАТЈАНАД
. АНЂЕЛКОВИЋ1
1
Природно–математичкифакултет, УниверзитетуНишу, Вишеградска 33, 18000 Ниши
2
гасном хроматографијом–масеном спектрометријом. Извршена је оптимизација екс -тракционих фактора: припрема узорака, врста и запремина органског растварача, ефекатисољавањаимешањаивремеекстракције. Одабранисубазнимаксимумииспи -тиванихфталата (m/z 149 за DBP, BBP и DEHP иm/z 163 за DMP) задаљеистраживање. Снимањејеизвршеноумодумониторингаизабраногјона. Калибрационаправајелине -арнауопсегу 0,25 до 2,50 μg mL-1саизрачунатимLOD вредностимаизмеђу 0,01 и 0,04 μg mL-1иLOQ вредностимаизмеђу 0,05 μg и 0,12 μg mL-1, саRSDизмеђу 1,7 и 4,9 %.
Истраживањејепоказалорастизмереноганалита (“recovery”) замањеполарнефталате разблаживањемматриксамлека. “Recovery” захидрофилнефталате, каоштојеДМП, се не мења разблаживањем матрикса млека и константантно је низак за испитивану методу. Двe концентрацијеунутрашњегстандарда (“spike”), тестиранe радииспитивања утицајаразблажењамлекана “recovery” фталата, показујуиститренд.
(Примљено 4. децембра 2014, ревидирано 26. фебруара, прихваћено 19. марта 2015)
REFERENCES 1. D. Cadogan, Plast. Addit. Cmpd. 4 (2002) 28
2. European Commission IP/99/829, Ban of phthalates in childcare articles and toys, 1999 3. R. H. Waring, R. M. Harris, Maturitas68 (2011) 111
4. Department of Health and Human Services Centers for Disease Control and Prevention, Third National Report on Human Exposure to Environmental Chemicals, 2005
5. World Health Organization: Guidelines for Drinking Water Quality, 2008 6. X.-L. Cao, Compr. Rev. Food. Sci. F. 9 (2010) 21
7. European Food Safety Authority, Opinion of the scientific panel on food additives, fla-vouring, processing aids and material in contact with food on a request from the Com-mission related to dibutyl phthalate (DBP) for use in food contact materials, EFSA J. 242
(2005) 1
8. European Food Safety Authority, Opinion of the scientific panel on food additives, fla-vouring, processing aids and material in contact with food on a request from the Com-mission related to butylbenzyl phthalate (BBP) for use in food contact materials, EFSA J.
241 (2005) 1
9. European Food Safety Authority, Opinion of the scientific panel on food additives, fla-vouring, processing aids and material in contact with food on a request from the Com-mission related to bis(2-ethylhexyl) phthalate (DEHP) for use in food contact materials, EFSA J. 243 (2005) 1
10. O. Ballesteros, A. Zafra, A. Navalon, J. L. Vilchez, J. Chromatogr., A1121 (2006) 154 11. A. Penalver, E. Pocurull, F. Borrull, R. M. Marce, J. Chromatogr., A872 (2000) 191 12. N. Kayali, F. Tamayo, L. Polo-Diez, Talanta69 (2006) 1095
13. K. Kato, M. J. Silva, J. W. Brock, J. A. Reidy, N. A. Malek, C. C. Hodge, H. Nakazawa, L. L. Needham, D. B. Barr, J. Anal. Toxicol. 27 (2003) 284
14. G. Mortensen, K. Main, A.-M. Andersson, H. Leffers, N. Skakkebak, Anal. Bioanal. Chem.382 (2005) 1084
15. J. Zhu, S. Phillips, Y.-L. Feng, X. Yang, Environ. Sci. Technol.40 (2006) 5276 16. M. Kim, S. J. Yun, G.-S. Chung, Food. Addit. Contam.26 (2009) 134
17. M. A. Farajzadeh, D. Djozan, M. R. Afshar, M. J. Norouzi, J. Sep. Sci.35 (2012) 742 18. H. Fromme, L. Gruber, E. Seckin, U. Raab, S. Zimmermann, M. Kiranoglu, M.
Schlummer, U. Schewgler, S. Smolic, W. Volkel, Environ. Int.37 (2011) 715
21. N. Casajuana, S. Lacorte, J. Agr. Food. Chem.52 (2004) 3702
22. Y. Tsumura, S. Ishimitsu, I. Saito, H. Sakai, Y. Kobayashi, Y. Tonogai, Food. Addit. Contam.18 (2001) 449.
23. A. Fankhauser-Noti, K. Grob, Anal. Chim. Acta582 (2007) 353
24. Z. Guo, S. Wang, D. Wei, M. Wang, H. Zhang, P. Gai, J. Duan, Meat Sci.84 (2010) 484 25. Wisconsin Department of Natural Resources Laboratory Certification Program:
Anal-ytical Detection Limit Guidance & Laboratory Guide for Determining Method Detection Limits (1996) http://dnr.wi.gov/regulations/labcert/documents/guidance/-lodguide.pdf 26. G. L. Long, J. D. Winefordner, Anal. Chem. 55 (1983) 712A
27. T. Perez-Palacios, J. Ruiz, I. M. Ferreira, C. Petisca, T. Antequera, Meat. Sci. 91 (2012) 369
28. J. K. Knoll, J. Chromatogr. Sci. 23 (1985) 422
29. D. Milojković, T. Anđelković, G. Kocić, in Proceedings of 12th International Conference
on Fundamental and Applied Aspects of Physical Chemistry, Belgrade, Serbia, 2014, p. 925