Article
J. Braz. Chem. Soc., Vol. 22, No. 12, 2330-2336, 2011. Printed in Brazil - ©2011 Sociedade Brasileira de Química 0103 - 5053 $6.00+0.00
A
*e-mail: [email protected]
Optimization of the HS-SPME Technique by using Response Surface Methodology for
Evaluating Chlorine Disinfection by-Products by GC in Drinking Water
Mauricio Aguirre-González,a Gonzalo Taborda-Ocampo,a Carmen Dussan-Lubert,b
Cristina Nerinc and Milton Rosero-Moreano*,a,c
aChemistry Department and bMathematical Department,University of Caldas,
Calle 65 N. 26-10, A. A. 265, Caldas, Colombia
cDepartment of Analytical Chemistry, Aragon Institute of Engineering Research I3A, EINA, Campus Río Ebro,
University of Zaragoza, Torres Quevedo Building, Maria de Luna St. 3, 50018 Zaragoza, Spain
Neste trabalho são descritos os resultados da otimização da técnica de microextração em fase sólida acoplada ao headspace e detecção por cromatografia gasosa com detector de microcaptura de elétrons (HS-SPME/GC-µECD). A melhor condição de extração para os quatro trihalometanos em água potável foi conseguida através de um estudo da metodologia de superfície de resposta, usando um planejamento fatorial composto 25.Cinco variáveis influentes tais como o tipo de fibra,
temperatura de extração e de dessorção e tempo de extração e de dessorção foram avaliadas. As variávies que exerceram maior influência na técnica HS-SPME foram a temperatura de extração e os tempos de dessorção e extração. O tipo de fibra e a temperatura de dessorção foram menos influentes na eficiência da extração. As melhores condições de extração foram obtidas quando empregou-se a fibra de carboxeno / polidimetilsiloxano (CAR/PDMS) de 75 µm, temperatura de dessorção 250 ºC, de extração 37,5 ºC, tempo de extração 30 min e de dessorção 4 min.
In this work the results of the optimization of headspace solid phase microextraction technique and determination by gas chromatography with micro electron capture detector (HS-SPME/GC-µECD) are described. The best condition of extraction for the four trihalomethanes in drinking water was reached through a response surface methodology’s study using a composite 25 factorial design. Five experimental conditions of influence such as the type of fiber, extraction
and desorption temperatures and extraction and desorption times were evaluated. The most influential factors in the technique of HS-SPME were the extraction temperature and extraction and desorption times. The type of fiber and the desorption temperature had little influence on extraction’s efficiency. The best conditions were obtained with a fiber carboxen/polidimetilsiloxane (CAR/PDMS) of 75 µm, desorption temperature 250 ºC, extraction temperature 37.5 ºC , extraction time 30 min and a desorption time 4 min.
Keywords: gas chromatography-µECD, surface response methodology, solid phase
microextraction, trihalomethanes, drinking water
Introduction
The disinfection of water has been conducted regularly since the early twentieth century to remove and deactivate pathogens in drinking water. In addition to removing pathogens, disinfectants also act as oxidants. They are also used to remove the taste and color, oxidized Fe and Mn, preventing the resurgence of biological elements in the water distribution system, improve the efficiency
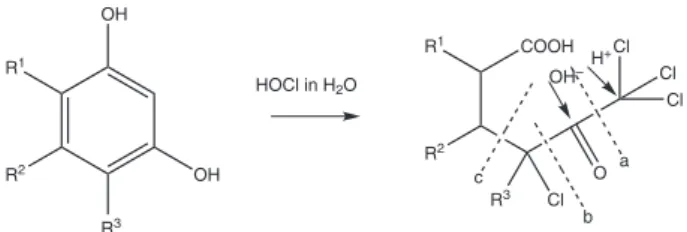
disadvantages in the treatment of surface water with chlorine is related to the reaction of the disinfectant with organic matter in natural waters, promoting the formation of substances classified as disinfection by-products, in which the two main groups during the chlorination process are haloacetic acids (HAAs) and trihalomethanes (THMs). Of all the natural organic matter (MON), only the fraction of dissolved organic matter, where humic substances are divided as humic and fulvic acids, has been recognized as the precursor of disinfection byproducts during water treatment with chlorine.4 The wide variety of organic macromolecules found in aquatic environments, especially refractory substances such as humic acids, are located largely in the dissolved organic matter (DOM), mainly due to the low biodegradability of these materials in aquatic environments.5,6 Rook7 proposed a mechanism for the formation of THMs from resorcinol-type molecules (Figure 1). Oxidation by hypochlorous acid (HOCl) allows halogenation of aromatic ring. Then, a fracture of the molecule (a in Figure 1) forms trihalomethanes. The split by the insertion of an hydroxide (in b) allows the formation of an haloacetic acid while a third fracture (in c) produces haloketones.2
Several studies have established the relationship between the exposure to THM compounds and the generation of cancer, classifying the four trihalomethanes as probable (CHCl3, CHCl2Br and CHBr3) and possible (CHClBr2) human carcinogens.8 Therefore, strategies for continued monitoring and determination of these compounds for human exposure have been developed.
THMs concentrations found in natural and human consumption water are about the order of ng L-1 to µg L-1. For this reason a very sensitive analytical procedure is required. Several methods have been reported for extraction and preconcentration of samples for the determination of THMs, such as liquid-liquid extraction with n-pentane or n-hexane(LLE)9-13 headspace (HS) techniques as static methods (HS-GC),10,13-17 and dynamic headspace purge and trap,10,13,18-25 solid phase extraction (SPE)26 and solid phase microextraction (SPME), which has been widely used for the determination of these analytes using headspace (HS-SPME).23,27-36 Apart from the techniques of preparation and
concentration of samples, these volatile compounds are separated by gas chromatography using capillary columns of medium polarity, followed by electron capture detector (ECD), micro-electron capture (µ-ECD),34 mass detector (MSD) or inductively coupled plasma-mass spectrometry (ICP-MS).37 The HS-SPME has great advantages such as sample extraction and preconcentration as its implementation is fast, simple, provides high sensitivity, is free of organic solvents and reusable and does not require great expense. This technique is based on the extraction of analytes from the sample matrix using a fused silica capilary fiber coated with a sorbent, in most cases a polymer, followed by thermal desorption of the analytes. The sensitivity of this technique largely depends on the type of fiber selected for the analysis. In addition to the type of fiber, there are other parameters that affect the extraction of the analytes and must be optimized, such as the volume of headspace, the addition of salt,30,34,35 stirring of the sample,23,27 extraction and desorption time and extraction and desorption temperatures.34 One of the tools that have brought significant benefits when optimizing analytical processes in which several variables simultaneously affect the analysis, is the experimental design based on factorial design and response surface methodology.4,34,35,38-41
The aim of this work was to optimize the conditions of the HS-SPME technique such as fiber type, extraction and desorption temperatures and extraction and desorption times for the assessment of THMs in drinking water samples through GC-µECD using a 25 factorial design and response surface methodology.
Experimental
Reagents and equipments
A s t a n d a r d m i x t u r e o f T H M s ( c h l o r o f o r m , bromodichloromethane, dibromochloromethane and bromoform) from Supelco with a concentration of 2000 µg mL-1 was used as stock solution and a 200 µg L-1 standard work solution was prepared from it with chromatographic grade methanol. Workingsolutions were prepared in 4 mL vials with PTFE perforated cover filled with the THMs standard mixture up to 50% of the total volume capacity of the vial and a 25% of sodium chloride solution was added. A magnet for constant stirring was also added. Three types of fibers, polydimethylsiloxane (PDMS 100 µm) or red fiber, polydimethyl siloxane/divinylbenzene (PDMS/DVB 65 µm) or blue fiber and carboxen/ polydimethyl siloxane (CAR/PDMS 75 µm) or black fiber were used from Supelco. These fibers were conditioned according to the manufacturer’s recommendations. OH
R1
R2
R3
OH
COOH R1
R2
R3 Cl
Cl
Cl
Cl
O c
b a OH–
H+
HOCl in H2O
For separation and identification of THMs a Hewlett Packard gas chromatograph 6890, equipped with a detector of microelectron capture (µECD) and a AT1701 capillary column (30 m long, 0.53 mm ID, 1.0 µm thick stationary phase of 7% cyanopropyl, 7% phenyl methyl siloxane) was used. The chromatographic conditions are shown in Table 1.
Experimental design DOE
For the evaluation of the variables 2 mL of standard work solution with the mixture of THMs were taken, and transferred to a 4 mL vial containing sodium chloride. Table 2 illustrates the five factors and their levels of study used. Each factor is assigned to a control center value, from which the upper and lower levels are derived. Composite design and the results were evaluated by means of Statgraphics Plus 5.1. For the five factors a composite 25 factorial design with a replica was used. As shown in the Table 3 from run 34 to 38 for fiber type that corresponds to the steepest ascendent way to reach the optimum and
neighbourhood, the model of RSM suggests to test a more polar fiber than the PDMS-DVB but in these four cases was decided to repeat the analysis with the same fiber, the most polar disposable fiber in our laboratory.
Results and Discussion
Correlation between control factors
By applying the analysis of variance to assess the significance of the model obtained, i.e., the statistical incidence of the control factors, both main and cross interactions, the control factors found in the design have an effect on the extraction technique because their p-value was significant (less 0.05) at a significance level of 5%.
Figures 2 and 3 show the effect of five factors to study the response in the extraction efficiency of analytes, which shows that the factors such as desorption and extraction time, extraction temperature and at lesser degree, the fiber type used, have a decisive influence on the response. For the desorption temperature, the slope shows a negative behavior against the expected response by the extraction technique, i.e., there is an inverse relationship between the efficiency of extraction and desorption temperature, which may be caused by the volatility of THMs.
Figure 3 also helps in analyzing the behavior of the interactions and shows the statistical significance of factor controls in the HS-SPME. The interactions between extraction temperature-extraction time, extraction temperature-desorption time, extraction time-desorption time are statistically significant in the extraction efficiency’s response for determining THMs in drinking water for our case. Therefore, it is assumed that the technique of HS-SPME is largely influenced by the values that are selected for the parameters of the extraction temperature, extraction time, desorption time and fiber type to be employed. However, the values of desorption time up to six min do not produce significant effect on the
Table 1. GC conditions
Parameters Setting characteristics
Autosampler Manual injection
Analytical column AT1701 30 m × 0.53 mm × 1.0 µm; 7% cyanopropyl-7% phenyl-methyl-siloxane
Carrier gas Flow rate
Nitrogen (99.99%) 1.5 mL min-1
Make up gas Ar-CH4 60 mL min-1
Injector Temperature
Split/splitless ID 4 mm volume 990 µL 250 ºCa split mode 25:1
Oven 50 ºC during 2 min to 110 ºC at 10 ºC min-1 stand
up 10 min; post run at 200 ºC during 2 min (run time 18 min)
Detector µECD 280 ºC
aOptimized condition that correspond to the desorption temperature.
Table 2. Control factors for the HS-SPME technique with superior,
inferior and center levels
Factors Levels
low (−1) center (0) hig (+1)
X1 Extraction Temperature / ºC 30 37.5 45
X2 Extraction time / min 20 30 40
X3 Desorption Temperaturea / ºC 200 250 300
X4 Desorption time / min 2 4 6
X5 Fiber typeb red black blue
aDesorption temperature means the programmed injector temperature. bRed: polydimethylsiloxane (PDMS) of 100 µm; black: carboxen/
polydimethylsiloxane (carboxen/PDMS) of 75 µm; blue: polydimethyl-siloxane/divinylbenzene (PDMS/DVB) of 65 µm.
300 350 400 450 500 550 600
+ - + - + - + - +
-Fiber type Desorption Temp.
Extraction Temp.
Extraction time
Desorption time
Area
Figure 2. Plot of main effects in control factors for the HS-SPME
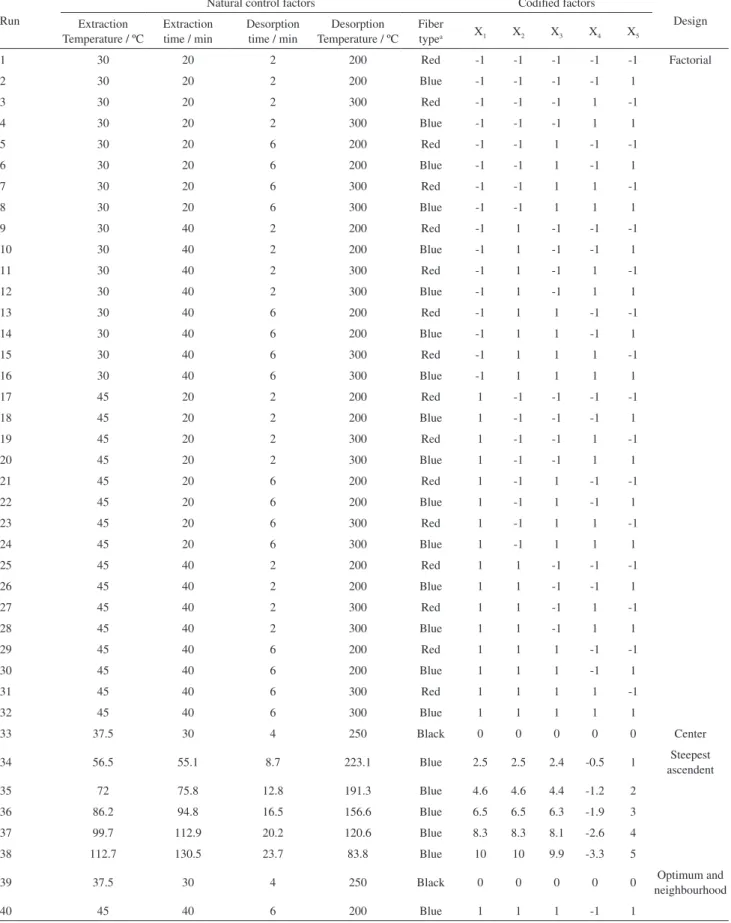
Table 3. Composite design 25 for studying the effects of the variables in the analysis of THMs by HS-SPME-GC-µECD
Run
Natural control factors Codified factors
Design Extraction
Temperature / ºC
Extraction time / min
Desorption time / min
Desorption Temperature / ºC
Fiber
typea X1 X2 X3 X4 X5
1 30 20 2 200 Red -1 -1 -1 -1 -1 Factorial
2 30 20 2 200 Blue -1 -1 -1 -1 1
3 30 20 2 300 Red -1 -1 -1 1 -1
4 30 20 2 300 Blue -1 -1 -1 1 1
5 30 20 6 200 Red -1 -1 1 -1 -1
6 30 20 6 200 Blue -1 -1 1 -1 1
7 30 20 6 300 Red -1 -1 1 1 -1
8 30 20 6 300 Blue -1 -1 1 1 1
9 30 40 2 200 Red -1 1 -1 -1 -1
10 30 40 2 200 Blue -1 1 -1 -1 1
11 30 40 2 300 Red -1 1 -1 1 -1
12 30 40 2 300 Blue -1 1 -1 1 1
13 30 40 6 200 Red -1 1 1 -1 -1
14 30 40 6 200 Blue -1 1 1 -1 1
15 30 40 6 300 Red -1 1 1 1 -1
16 30 40 6 300 Blue -1 1 1 1 1
17 45 20 2 200 Red 1 -1 -1 -1 -1
18 45 20 2 200 Blue 1 -1 -1 -1 1
19 45 20 2 300 Red 1 -1 -1 1 -1
20 45 20 2 300 Blue 1 -1 -1 1 1
21 45 20 6 200 Red 1 -1 1 -1 -1
22 45 20 6 200 Blue 1 -1 1 -1 1
23 45 20 6 300 Red 1 -1 1 1 -1
24 45 20 6 300 Blue 1 -1 1 1 1
25 45 40 2 200 Red 1 1 -1 -1 -1
26 45 40 2 200 Blue 1 1 -1 -1 1
27 45 40 2 300 Red 1 1 -1 1 -1
28 45 40 2 300 Blue 1 1 -1 1 1
29 45 40 6 200 Red 1 1 1 -1 -1
30 45 40 6 200 Blue 1 1 1 -1 1
31 45 40 6 300 Red 1 1 1 1 -1
32 45 40 6 300 Blue 1 1 1 1 1
33 37.5 30 4 250 Black 0 0 0 0 0 Center
34 56.5 55.1 8.7 223.1 Blue 2.5 2.5 2.4 -0.5 1 Steepest
ascendent
35 72 75.8 12.8 191.3 Blue 4.6 4.6 4.4 -1.2 2
36 86.2 94.8 16.5 156.6 Blue 6.5 6.5 6.3 -1.9 3
37 99.7 112.9 20.2 120.6 Blue 8.3 8.3 8.1 -2.6 4
38 112.7 130.5 23.7 83.8 Blue 10 10 9.9 -3.3 5
39 37.5 30 4 250 Black 0 0 0 0 0 Optimum and
neighbourhood
40 45 40 6 200 Blue 1 1 1 -1 1
aRed: polydimethylsiloxane (PDMS) of 100 µm; black: carboxen/polydimethylsiloxane (carboxen/PDMS) of 75 µm; blue: polydimethylsiloxane/
extraction of analytes through the separation technique that is being evaluated.
Optimization of HS-SPME using response surface methodology
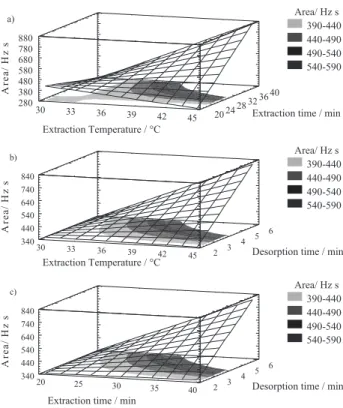
The response surface representations (Figure 4, a-c), show that the interaction between extraction temperature and extraction time (which has the largest impact on the extraction technique, as shown in Figure 3) was stronger when both variables were at high levels in their respective values.
In other words, for a better extraction of the analytes of THMs in the separation and preconcentration technique, higher extraction temperature of 35 ºC and extraction times above 30 min should be used.
However, as the HS-SPME process consists of sampling in the equilibrium established between the aqueous and vapor phases, to achieve the better and more reproducible values, and consequently the maximum extraction of the analytes, a study in depth was carried out. The experiment 39 (Table 3 and Figure 4, a-c) at 37.5 ºC as extraction temperature, 30 min extraction time, 4 min at the desorption time, 250 ºC on the desorption temperature was selected as the best one. This coincides with the values established as a center in our experimental design. This is explained by recalling that the analytical technique study leads to equilibrium, and thus an increase in the values of the factors influencing it, does not alter the values. It is likely for this reason that the steepest ascendant way to reach the maximum efficiency by using this model (Table 3) will get the target with better extraction using higher levels than those set by the experimental design, but chemical equilibrium establish other more realistic conditions.
Comparison between different values of the levels for the control factors studied
Figure 5 shows the results obtained in the optimization of the parameters for the analysis of THM by HS-SPME. As can be seen, Figure 5 identifies the type of fiber CAR/ PDMS (75µm) as one that provides the best response of target compounds, which agrees with the findings in the design.
This behavior is due to the chemical characteristics of polarity of the fiber in question, since the dual component carboxen/polydimethyl-siloxane provides bipolarity and allows the selectivity for analytes of medium and low polarity, in contrast to the PDMS fiber that is selective for nonpolar compounds.
Differences between fiber CAR/PDMS and PDMS/DVB are not very deep, because both contain the PDMS group, so that bipolar behavior is expected for both fibers, although the group divinylbenzene (DVB) gives a slightly higher degree
Standardized effect
0 2 4 6 8
AB BC BD BE AE AD B: Desorption Temperature A: Fyber type AC DE C: Extraction Temperature D: Extraction time E: Desorption time CE CD
+
-Figure 3. Standardized chart Pareto for the extraction efficiency’s response
in the HS-SPME technique for analyzing THMs in drinking water.
Figure 4. Estimated response surface for bromodichloromethane obtained
with the composite design: a) extraction Temperature and extraction time; b) extraction Temperature and desorption time; c) extraction and desorption time.
0 500 1000 1500 2000 2500 3000
PDMS/DVB
Fiber type Desorption Temperature / °C Extraction Temperature / °C PDMS CAR/PDMS 200 250 300 30 37.5 45 Chloroform Bromodichloromethane Dibromochloromethane Bromoform
Area /Hz s
Figure 5. Extraction efficiency versus different control factors in
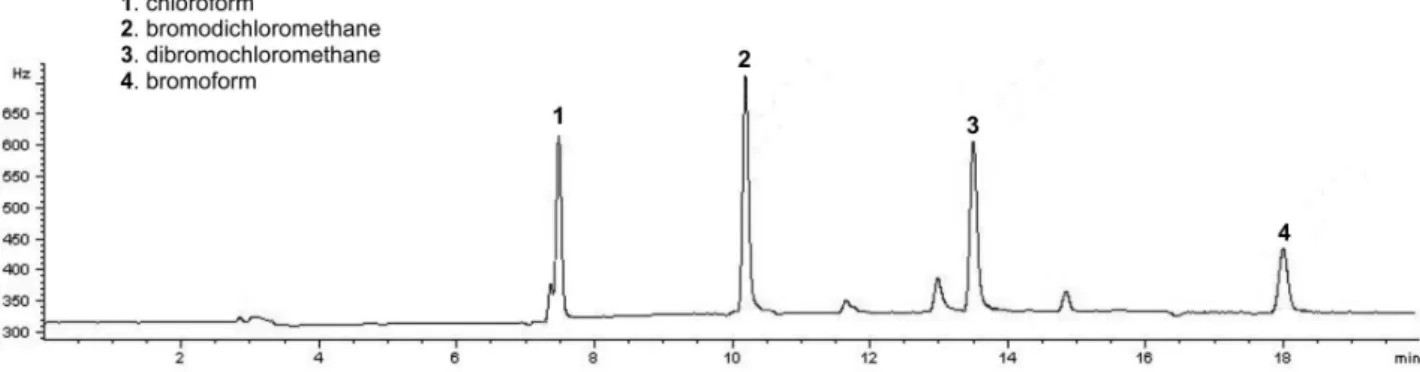
Figure 6. Chromatogram of a sample drinking water treatment plant “El Mirador” Viterbo-Caldas, Colombia under the best conditions of HS-SPME-GC-µECD (run 39 in the DOE).
of polarity. Therefore, to establish an order in terms of better extraction the order CAR/PDMS >>> PDMS/DVB > PDMS
can be mentioned. Other authors have reported that fiber CAR/PDMS provides better extraction of analytes.23,27,30,32,34 However, the versatility of the different types of fiber can also be found in the literature, where fiber PDMS/DVB showed better results for the extraction of THMs compounds35 and in a few exceptions, also PDMS fiber was proposed for the analysis of THMs by HS-SPME.33
Other variables were the desorption and extraction temperatures showing that at 250 ºC as desorption temperature, the response is maximized, which coincides with James and co-workers36 (and Horng cited in reference 36) who indicated that the effect of temperature on the absorption of the analytes shows that at low temperatures, the ratio of diffusion is low and the time to reach equilibrium is longer. With an increase in temperature the distribution constant decreases, and as the absorption is generally an exothermic process, then the amount of analyte absorbed into the fiber decreases. For this reason, it was found that the desorption temperature better corresponds to 250 ºC, and other authors confirmed this as well by obtaining specific temperature or close to this value.
For the extraction temperature there was a more efficient response of 37.5 ºC, being the central level in the DOE 30 ºC and 45 ºC (the lower and upper levels of the variable ), thus agreeing with those reported by other authors.23,27,35
In the evaluation of extraction and desorption times, the values were 30 and 4 min, respectively, which in chemical terms is logical, due to the chemical equilibrium theory. These values represent better extraction, taking into account that the THMs compounds are low molecular weight and have low values of Henry’s constant.27
Analysis of drinking water samples
The optimization of HS-SPME technique, through a composite 25 factorial design and response surface
methodology has been carried out to establish the operating factors that have the greatest impact for the better extraction trihalomethanes. Subsequent determination of THM in real water samples was done by gas chromatography µECD.
Figure 6 shows the chromatogram under the best conditions above mentioned for the five control factors, obtaining a good separation of THMs in terms of resolution and shape peak with a relative short run time (7.358 min for CHCl3; 10.183 min for CHCl2Br; 13.488 min for CHClBr2 and 18.008 for CHBr3).
Conclusions
Acknowledgments
The authors thanks to company Obras Sanitarias de Caldas EMPOCALDAS S.A. E.S.P., the Departments of Chemistry and Mathematics and the Vice-Rector for Research and Post Graduate of the University of Caldas.
References
1. U.S. EPA (United States Environmental Protection Agency), 1999a, EPA Guidance Manual - Alternative Disinfectants and Oxidants, EPA-815-R-99-014, U.S. EPA, Washington, DC, April 1999.
2. Rodríguez, J. M.; Interciencia2007, 32, 11.
3. Zogorski, J. S.; Ivahnenko.T.; U.S. Geological Survey2006, 13. <http://pubs.er.usgs.gov/publication/sir20065015>.
4. Rodrigues, P. M. S. M.; Esteves da Silva, J. C. G.; Antunes, M. C. G.; Anal. Chim. Acta2007, 595, 266.
5. Gonzalez-Vila, F. J.; Lankes, U.; Ludemann, H. D.; J. Anal. Appl. Pyrolysis2001, 58-59, 349.
6. Junkers, J.; Schmitt-Kopplin, P.; J. Chromatogr., A 2003,
998, 1.
7. Rook, J. J.; Water Treatment Examination1974, 23, 234. <https://scifinder.cas.org.roble.unizar.es:9443/scifinder/view/ scifinder/scifinderExplore.jsf>.
8. Zhao, R. S.; Lao, W. J.; Xu, X. B.; Talanta2004, 62,751. 9. US Environmental Protection Agency; EPA method 551.1, Rev.
1.0., Cincinnati, OH, 1995. <http://nlquery.epa.gov/epasearch/ epasearch?querytext=method+551.1&fld=&areaname=&ty peofsearch=epa&areacontacts=http%3A%2F%2Fwww.epa. gov%2Fepahome%2Fcomments.htm&areasearchurl=&result_ template=epafiles_default.xsl&filter=sample4filt.hts>. 10. Golfinopoulos, S. K.; Lekas, T. D.; Nikolaou, A. D.;
Chemosphere 2001, 45, 275.
11. Leivadara, S. V.; Nikolaou, A. D.; Lekkas, T. D.; Food Chem.
2008, 108, 277.
12. Nikolaou, A.; Desalination2005, 176, 25.
13. Nikolaou, A. D.; Lekkas, T. D.; Golfinopoulos, S. K.; Kostopoulou, M. N.; Talanta2002, 56, 717.
14. Caro, J.; Serrano, A.; Gallego, M.; J. Chromatogr., A2007,
1138, 244.
15. Gallard, H.; Von Gunten, U.; Water Res.2002, 36, 65. 16. Kuivinen, J.; Johnsson, H.; Water Res.1999, 33, 1201. 17. Serrano, A.; Gallego, M.; J. Chromatogr., A2007, 1154, 26. 18. Allonier, A.; Khalanski, M.; Bermond, A.; Camel, V.; Talanta
2000, 51, 467.
19. Campillo, N.; Viñas, P.; López-García, I.; Aguinaga, N.; Hernández-Córdoba, M.: J. Chromatogr., A2004, 1035, 1. 20. Chen, T. C.; Her, G. R.; J. Chromatogr., A2001, 927, 229. 21. Ekdahl, A.; Abrahamsson, K.; Anal. Chim. Acta1997, 357, 197. 22. Kampioti, A. A.; Stephanou, E. G.; J. Chromatogr., A1999,
857, 217.
23. Lara-Gonzalo, A.; Sánchez-Uría, J. E.; Segovía-García, E.; Sanz-Medel, A.; Talanta2008, 74, 1455.
24. Zoccolillo, L.; Amendola, L.; Cafaro, C.; Insogna, S.;
J. Chromatogr., A2005, 1077,181.
25. Zygmunt, B.; J. Chromatogr., A1996, 725, 157.
26. Di Gioia, M. L.; Leggio, A.; Pera, A.; Liguori, A.;
Chromatographia2004, 60, 319.
27. Antoniou, C. V.; Koukouraki, E. E.; Diamadopoulos, E.;
J. Chromatogr., A2006, 1132, 310.
28. Cancho, B.; Ventura, F.; Galceran, M. T.; J. Chromatogr. A1999, 841, 197.
29. Chen, M.-L.; Mao, I.-F.; Hsu, C.-C.; Toxicol. Environ. Chem.
1997, 60, 39.
30. Cho, D.-H.; Kong, S.-H.; Oh, S.-G.; Water Res.2003, 37, 402. 31. Frazey, P. A.; Barkley, R. M. Sievers, R. E.; Anal. Chem.1998,
70, 638.
32. Guimaraes, A. D.; Carvalho, J. J.; Goncalves, C.; Alpendurada, M. D.; Int. J. Environ. Anal. Chem.2008, 88, 151.
33. Nakamura, S.; Daishima, S.; Anal. Chim. Acta2005, 548, 79. 34. Rosero, M.; Aguirre, M.; Pezo, D.; Taborda, G.; Dussan,
C.; Nerín, C.; Water, Air, Soil Pollut.2011, 1.http://dx.doi. org/10.1007/s11270-011-0891-9
35. San Juan, P. M.; Carrillo, J. D.; Tena, M. T.; J. Chromatogr., A
2007, 1139, 27.
36. Stack, M. A.; Fitzgerald, G.; O’Connell, S.; James, K. J.;
Chemosphere2000, 41, 1821.
37. Gonzalez-Gago, A.; Marchante-Gayón, J. M.; García Alonso, J. I.; J. Anal. At. Spectrom.2007, 22, 1138.
38. Batlle, R.; Sanchez, C.; Nerin, C.; Anal. Chem.1999, 71, 2417. 39. Platikanov, S.; Tauler, R.; Rodrigues, P. M.; Antunes, M. C.;
Pereira, D.; Environ. Sci. Pollut. Res. 2010, 17, 1389. 40. Salafranca, J.; Domeño, C.; Fernández, C.; Nerín, C.; Anal.
Chim. Acta2003, 477, 257.
41. Sun, A. D.; Chen, W.; Lin, T.; Xu, Q.; Clean - Soil, Air, Water
2010, 38, 353.
Submitted: March 30, 2011