ABSTRACT
http://dx.doi.org/10.1590/1678-775720130658
after repeated acidic beverage exposures:
consequences of clusters dislodgments
Nádia da Rocha SVIZERO1, Adriana Regina Cruz Grando de GÓES2, Tamires de Luccas BUENO2, Vinicius DI
HIPÓLITO3, Linda WANG2, Paulo Henrique Perlatti D'ALPINO3
1- Hospital for Rehabilitation of Craniofacial Anomalies (HRAC-USP), University of São Paulo, Bauru, SP, Brazil.
2- Department of Operative Dentistry, Endodontics and Dental Materials, Bauru School of Dentistry, University of São Paulo, Bauru, SP, Brazil. 3- Biomaterials Research Group, Universidade Anhanguera de São Paulo (UNIAN-SP), São Paulo, SP, Brazil.
Corresponding address: Nádia da Rocha Svizero - Hospital de Reabilitação de Anomalias Craniofaciais - Setor de Dentística - Universidade de São Paulo - Rua Silvio Marchione, 3-20 - Vila Universitária - 17012-900 - Bauru - SP - Brazil - Phone: +55 14 3235 8180 - e-mail: [email protected]
!
O
bjective: To evaluate the hardness (KHN), color stability (∆micromorphology of two categories of composites after immersion in either distilled water or grape juice for up to 45 days. Material and Methods: Cylindrical specimens (6 mm diameter x 2 mm thick) were obtained according to the factors: composite [Opallis (FGM) and Filtek Z350XT (3M ESPE)]; immersion solution (distilled water and grape juice); and evaluation time: 24 h and 7, 14, 21, 28, and 45 days. After photoactivation, the specimens
were stored at 37°C for 24 h. KHN (50 g/15 s) and ∆E were then repeatedly assessed
according to the immersion solutions. Data were analyzed (three-way ANOVA/Tukey’s test). Scanning electron microscopy (SEM) topographic analysis was also performed. Results: In general, KHN of both composites reduced after 24 h, irrespective of the immersion solution !"#$%&'*+9<
all parameters. An increase in ∆E over time was noted for both composites, irrespective
!#=##>!$%&'*+9< in grape juice compared with Opallis, regardless of the evaluation time. The grape juice
##∆E compared with water in all periods. SEM analysis showed
eroded areas for Filtek Z350XT but not for Opallis. Conclusions: The compositions and ?###@B! #####@## the microhybrid when immersed in an acidic dyed solution.
Keywords: Composite resins. Color. Hardness. Time factor.
INTRODUCTION
Resin composites have been widely used in clinical practice to restore dental structures with J=#@L in 1963, composites have been basically composed !J#
# J12. Despite
UU#!! have mainly addressed improving properties
# #2,10,28. Once in
the oral environment, the esthetic restorations are susceptible to staining, since the consumption of
food and its fermentation produce dyed byproducts that can change the tooth surface even in a short period of time8. Composite discoloration can occur
due to extrinsic or intrinsic factors. The main !#
the resin matrix13#JW!4,
and incomplete curing of the material6. The
presence of the photoinitiator system, especially
camphorquinone6?
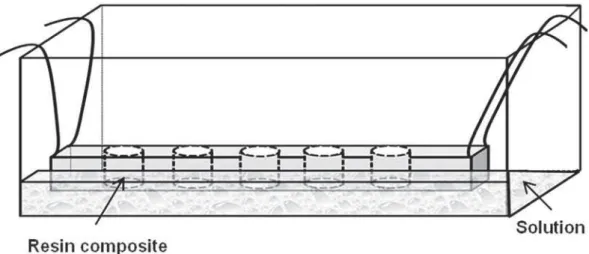
Figure 1- Schematic representation of the ethylene vinyl acetate (EVA) sheet rack used for the color change evaluation
absorption18. The extrinsic discoloration may result
from smoking pigments, poor oral hygiene, and especially the absorption of dyes from different foods and drinks30.
<#J!!# surface polish and the susceptibility to extrinsic staining of bonded restorations25. Composites with
@U@@
#JW!30. This interface has high
sensibility to sorption22. The absorbed water may
#!#JW! hydrolytic degradation of the particles resulting in color change of the restorative material19,30. Thus,
the hydrolytic degradation results from breakage of the chemical structure of the resin composite or softening through the plasticization action exerted
by water27
developed in order to offer optimized mechanical properties, and considering the increased demand for a universal restorative material, they were indicated for anterior and posterior teeth21. It
is believed that the packing and distribution of #! improve their resistance to chemical challenges, preventing an earlier color change. Thus, the aim of this study was to evaluate the color stability of two resin composites (a microhybrid composite and a nanofilled composite) after immersion in a dye solution or distilled water for different periods of time. Drawing upon two hypotheses, this study attempts to investigate the effects of immersion protocols and several evaluation times on the Knoop hardness and color changes of two commercial resin composites. The hypotheses tested were as follows: (1) the immersion solutions affect the hardness of the composites, irrespective of the evaluation time; and (2) the color change will be altered as a function of the immersion protocol and evaluation time.
MATERIAL AND METHODS
Experimental design
In this in vitro study, the hardness and
the color change evaluations were performed according to the factors: (1) composites, at two levels: microhybrid composite Opallis (shade EA2) $% &'*+9< Y# A2E); (2) immersion solution at two levels: control (distilled water) and grape juice; and (3) U U U\ ^_ # ` {* days, 30 days, 45 days. The characteristics of the resin composites selected are described in Figure 1. Twenty experimental groups were obtained among the combinations of the factors under study for each one of the evaluations performed.
Specimen fabrication
<?Y^ mm thick, 6 mm diameter) and photoactivated according to manufacturers’ directions (20 s curing time). After insertion, a polyester strip was applied to the surface of the unpolymerized material and a microscope slide was pressed against the composite surface to adapt the material completely to the inner portion of the B # ? @ ! and similar composite volumes were obtained. The excess material was removed and the specimens were then photoactivated at the top surface. A quartz-tungsten-halogen (QTH) curing light was used to polymerize the specimens (Ivoclar Vivadent Astralis 3, Schann, Liechtenstein) with a power density of 600 mW/cm2. Prior to testing
and throughout the experiment, the power density was monitored using a handheld radiometer (Model 100, Demetron Research Corp., Danbury, CT, USA).
Hardness test
Material Organic matrix * Fillers * Weight (W) / Volume (V)*
Opallis (FGM Produtos Odontológicos LTDA,
Joinville SC, Brazil)
Bis-GMA, UDMA, TEGDMA, and Bis-EMA
Silanized barium-aluminum-silicate glass, pigments, and
W: 78.5 % V: ~58 %
Filtek Z350XT (3M ESPE, St. Paul, MN, USA)
Bis-GMA, UDMA, TEGDMA, PEGDMA, and Bis-EMA
Silica (20 nm); Zirconia (4-11 nm); Clusters of particles
aggregate of silica/zirconia (20 nm and 4-11 nm)
W: 78.5 % V: 63.3 %
*Manufacturer's information
Bis-GMA - Bis-phenol A di-Glycidyl methacrylate; Bis-EMA - Bis-phenol A di-Glycidyl ethoxylate methacrylate; TEGDMA - Triethylene glycol dimethacrylate; UDMA - Urethane dimethacrylate; PEGDMA - Polyethylene glycol dimethacrylate
Figure 2- Composition of evaluated resin composites
photoactivation, the specimens were removed !##! with an indelible mark. A single operator prepared the specimens. The specimens were then stored in lightproof recipients for 24 h. After storage, the specimens were placed in the testing table were stabilized with the same standardized acrylic matrix used during the polishing procedures. The microhardness test was performed in a digital Knoop hardness-measuring instrument under load (Shimadzu HMV-M Microhardness Tester; Newage Testing instruments Inc., Southampton, PA, USA). Six randomized indentations (3 on both the top and bottom surfaces) were made with a 50 g load for 15 s, with a dwell time of 15 s. For randomization, specimens were arbitrarily rotated before indentations. The specimens were tested by a single operator throughout the evaluation times.
After the initial hardness evaluation, the specimens of each material were distributed in two groups (n=5), according to the immersion solution protocols: distilled water and grape juice (Salton, Bento Gonçalves, RS, Brazil - pH 2.8). After the initial hardness evaluation (irradiated top !#J# vinyl acetate (EVA) sheet rack (Figure 1) and @ #! maintain only the irradiated surfaces exposed to the immersion solutions. The specimens of both resin composites (n=5) were daily submitted to two immersion cycles of 10 min in 100 mL of grape juice, which was renewed in all of the immersion cycles. Care was taken in order to guarantee that the pH value of the grape juice was the same previously the immersion time. In the remaining time, the specimens were washed and immersed in distilled water, which was also renewed daily. The remaining specimens (n=5) were immersed in distilled water throughout the experimental period (control group), which was renewed daily as well. The top surface of the specimens (irradiated surface) was subjected to Knoop hardness
assessment according to the evaluation times of 24 h, 7 days, 14 days, 28 days, and 45 days.
Color-change evaluation
In the same way, the cylindrical composite specimens were divided into 2 groups (n=5), according to the immersion solution. The irradiated surfaces were polished with sequential abrasive discs (3M ESPE Sof-Lex, Extra-thin contouring and polishing discs, St. Paul, MN, USA) and mounted in a slow-speed handpiece, according to the protocol, as follows: sanding with a medium-granulation Y^'^ ! {+ # # Y^'^$!{+ #JY^'^=$ !{+<# a standardized acrylic matrix during the polishing procedures. The specimens were then washed in distilled water for 10 s, dried with an absorbent paper and stored in the dark for 24 h before the initial color readings.
The CIEL*a*b* system was used to evaluate the color change. This methodology is based on an analysis with a spectrophotometer with @ ! \ @ @# Internationale de L’Eclairage (CIE, 1976). L* represents the white and black shift which white has a positive value and black has a negative value; a* represents the red and green shift for which red has a positive value and green has a negative value; b* represents the yellow and blue shift for which yellow has a positive value and blue has a negative value. These values were calculated according to the formula:
222]1/2
Resin composite
Immersion solutions
Evaluation Time
24 h 7 days 14 days 28 days 45 days
Distilled water 53.3aA! 43.3aA* 43.2aA* 40.4aA* 38.6aA*
Opallis (2.9) (2.1) (1.8) (1.3) (1.4)
Grape juice 52.1aA! 45.9aA* 41.9aA* 40.2aA* 38.0aA*
(1.7) (1.7) (1.4) (1.6) (0.9)
Distilled water 68.8bA! 58.6bA* 52.2bA* 51.2bA* 50.1bA*
Filtek Z350XT (2.6) (1.1) (1.5) (1.3) (1.0)
Grape juice 67.2bA! 54.2bB* 51.9bA* 48.5bA* 45.6bB*
(1.1) (1.3) (1.5) (1.1) (1.3)
n=5
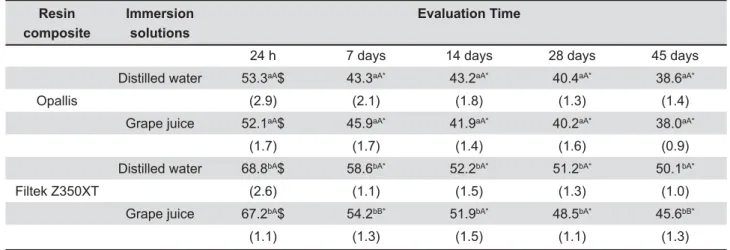
"## $ # $& < >?KQ > Y [\^ # Y > Y immersion solution and same evaluation time.
"##_>>#_&<>?KQ>Y[\^ # Y > Y immersion solutions and same evaluation time.
"##`q{!&<>?KQ>Y[\^Y{##__# the same composite and same immersion solution.
Table 1- Means (standard deviations) of hardness (KHN) of the tested resin composites as a function of the immersion solutions and evaluation time
^@ #! to maintain only the irradiated surfaces exposed # =@ U specimens of both resin composites were daily submitted to two 10-min immersion cycles in 100 mL of the grape juice, which was renewed in all of the cycles. In the remaining time, the specimens were washed and immersed in distilled water, which was renewed daily. The remaining specimens (n=5) were immersed in distilled water throughout the experimental period (control group), which was renewed daily as well. The color changes were analyzed weekly according to the experimental design (7, 14, 21, 28 and 45 days). Before each color measurement, the specimens were carefully dried with an absorbent paper.
Statistical analysis
The assumptions of equality of variances and normal distribution of errors were checked by the Kolmogorov-Smirnov and Bartlett tests, U@ the means of hardness and DE were compared by means of a three-way ANOVA, followed by a multiple comparison test performed with the Tukey test, at a pre-set alpha of 1%.
SEM observation
In order to characterize the topographic aspect of both resin composites after 45 days of storage, three specimens of each experimental group used for the color change evaluation were evaluated under scanning electron microscopy
(SEM). For comparative reasons, control groups (non-stored specimens) were also evaluated. In addition, representative images of selected regions of both resin composites were obtained to characterize the morphological aspects of the # @W% $ this, three additional specimens of non-storage resin composites were immersed into acetone p.a. (Ref. 32201, Sigma-Aldrich, St. Louis, MO, USA) for 3 days in order to dissolve the organic matrix. All of the specimens obtained, regardless of the preliminary process, were then dehydrated over silica gel for 2 h, sputter-coated (40 mA for 120 s) with gold/palladium (SCD 050, Balzers, Schaan, Liechtenstein), and then investigated by means of SEM (JSM 5600LV, JEOL, Tokyo, Japan), under secondary electron mode, operating at 15 -25 kV.
RESULTS
Resin Composite
Immersion Evaluation Time
Solutions 7 days 14 days 21 days 28 days 45 days
Distilled water
1.78aA* 1.96aA* 2.65aA! 2.87aA! 3.20aA!
Opallis (0.09) (0.08) (0.42) (0.33) (0.23)
Grape juice 1.38aA* 1.72aA* 2.78aA! 2.99aA! 5.60aB!
(0.12) (0.19) (0.21) (0.15) (0.35)
Distilled water
1.59aA* 1.66aA* 1.87aA* 1.88aA* 2.25aA!
Filtek Z350XT
(0.14) (0.18) (0.08) (0.07) (0.19)
Grape juice 4.29bB* 6.67bB! 6.84bB! 7.07bB! 9.69bB!
(0.35) (0.27) (0.32) (0.25) (0.37) Table 2-}{{{#`#Y>$Y{Y_{ evaluation time
n=5
"## $ # $& < >?KQ > Y # Y > Y immersion solution and same evaluation time.
"## _>> # _& < >?KQ > Y # Y > Y immersion solutions and same evaluation time.
"##`q{!&<>?KQ>YY{##__# Y>{_>?K
#!# Opallis was noted when the immersion protocols were compared, for all of the evaluation times tested (p>0.01). Conversely, for the composite $% &'*+9< ## noted when immersed in water than in grape juice for the times of 7 and 45 days. Regarding the immersion solution and resin composite, the results indicate that the hardness means of both ! 24 h.
<#U!> presented in Table 2.The triple interaction of the factors of “composite”, “immersion solution”, and U Y++{ <# interactions between “composite” x “immersion solution”, “composite” x “evaluation time”, and “immersion solution” x “evaluation time” were also
Y++{
@ # > ! @# composites when immersed in water (p>0.01). " # # # # >!$%&'*+9<!! the evaluation times. For the composite Opallis, a #>! 45 days for both immersion protocols.Conversely, # # > ! # ! the evaluation times for Filtek Z350XT.Regarding
#U# > ! " ! ^{ irrespective to the immersion solution. For the $%&'*+9< #>!_*# # increase was noted after 14 days of immersion in grape juice.
J
Appl Oral Sci.
378
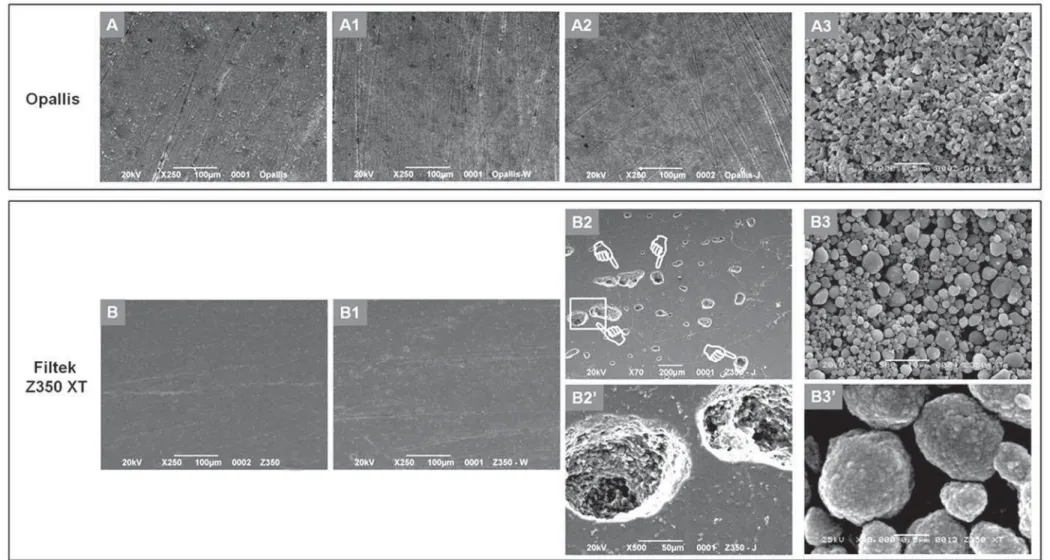
Figure 3- Representative scanning electron microscopy (SEM) images of the topographic aspect of the composites Opallis (control – A, water – A1; grape juice – A2) and Filtek $K>_{Q{Y>YY#Y<#Y>{Y topographic aspect of the composite Opallis after storage in water or grape juice is similar to that of observed for the control group. For Filtek Z350XT, the topographic aspect of Y>#$Y#{Y_>Q_{{$Y#{_<{{{ {{{#Y>_QY$_Y>>Y>#Y>YY<#Y{{` YY>>Y{_<Q$YY>Y${_{{<{ clusters (B3’)
DISCUSSION
<####### immersion solutions affect the hardness of the composites, irrespective of the evaluation time, was accepted. It was found that the hardness of @# after 24 h, irrespective of the immersion protocol. In addition, the hardness means were mainly ?@## were compared, Opallis showed lower KHN values than Filtek Z350XT for all of the evaluated times, irrespective of the immersion protocol (Table 1). Explanations of the difference in the hardness @## " #@! @ #@<#! particles in this composite is 78.5% by weight. Although the same concentration by weight was !!$%&'*+9<#! W For comparative reasons, the KHN of glass is 530, while the KHN of zirconia is 1,16024. Variables such
as size, shape, distribution, and also content per
UW#!##J #U @ ? # # strength, hardness, and modulus of elasticity of composites7,8,24.
The second hypothesis, which anticipated that the color change would be altered as a function of the immersion protocols and evaluation times, !!> was noted for all of the evaluation times when the results of Filtek Z350XT in distilled water were compared to those of grape juice (Table 2). On # # # # > was only noted after 45 days for the composite Opallis in both immersion protocols. It could be argued that the type of particles in the resin composites tested could also be related to the results found, as the more radiopaque glasses contained in the microhybrid composite Opallis present greater dissolution in water. Radiopacity of composites usually results from the incorporation of elements of relatively high atomic number, such as barium and strontium, into the SiO2-based
16,29
least one radiopaque oxide component, such as BaO, ZrO2, or Yb2O3 at varying concentrations26.
In a wet condition, the initiation of the crack/ ?#!!! the adhesion of the particles to the matrix can be destroyed by hydrolysis5. Although barium is
#!="2 glass, barium
ions, once leached out into the water (or oral ? # # !
tissues23. If the material is heterogeneous and
anisotropic as almost all dental materials are, several sizes of defects are present as well. This potential deterioration of the glass is one of the reasons why it is so important to form an organic layer of silane molecules on the surface of the !#U"# other hand, it has been found that the silane treatment remains for at least 6 months, even when specimens are stored in adverse conditions in distilled water22. This would lead to increased
>!"UU # > ! _* days when both the immersion protocols were # ! Filtek Z350XT in all of the evaluation times. In a previous study3, it was also demonstrated that the
$%&'*+9<@# an amorphous as well as a crystalline phase that !!@# this fact may affect clinically relevant parameters such as mechanical/physical properties; fracture toughness, polymer conversion, strength, among others. These results indicate that Filtek Z350XT would be less clinically stable in comparison to other methacrylate-based composites. Clinically, color alterations in composite restorations are U @U # # > ## #
3.36,19 B # >''
for Opallis only after 45 days of immersion in the #!$%&'*+9<# Y!`>''!# same immersion media. Conversely, no clinically noticeable alterations would be noted for both resin composites when immersed in water, irrespective of the evaluation time (up to 45 days).
The topographic analysis demonstrated that eroded areas were observed for the composite Filtek Z350XT in the specimens after 45 days of immersion (Figure 3). Filtek Z350XT exhibited a distinctive and unique erosive pattern in which the agglomerated nano-sized particles were dislodged due to matrix degradation. On the other hand, no evidence of eroded areas was seen for the composite Opallis. This explains why
#>.
The explanations of the results obtained for Filtek Z350XT rely on the fact that this composite is constituted exclusively by silanized nanometric-sized silica particles (20 nm) and clusters of Si/Zr. =J##! to be coated by silane, making the silanization process more critical15 and increasing the chances of an interfacial failure14. It has been reported that a variety of chemical and physical processes # ! J ! # # structure and function of polymeric materials17.
@has been shown to enhance the mechanical stability of the filler-matrix interface and increase the strength and hardness of composite resins20. It has been also claimed
that the nanoclusters may provide a reinforcing #### # ! # # response to loading stresses, thus providing an improved clinical performance1. Nanoclusters has
been also advocated to be useful for improving the wear resistance and for reducing the possibility of restoration resistance to fracture as the silane #U@U in micro-hybrid composites1. Another possible
J!###>!$%&'*+9< could be the weak bonding between the particles and the resin matrix. As long as the eroded areas occurred throughout the evaluation times, the entrance of colored pigments contained in the grape juice was certainly possible after 14 days, at #### in comparison to the initial reading. <# treatment and presence of interspacing caused by poor silanization process can affect the surface !#!# defects to the material and concentrate stress.
This study demonstrated that, despite the ! % # J#!# ! ? # ! hardness and color stability when immersed in different storage media over time. It is important ## ?@# than the microhybrid composite. Moreover, in the present study, the nanofilled composite presented a higher decrease in hardness, which was more evident when immersed in the acidic dyed solution. Improvements, on the other hand, are necessary to improve the color stability of # ! the effectiveness and integrity of the silanization # # # particles, the higher the surface area to be coated by silane, making the silanization process more critical. This is a critical clinical issue in esthetic dentistry and has to be further substantiated by evaluating the longevity of the restorations. Extrapolations to clinically support and validate the results using different categories of composites need to be done with caution since future studies are required.
CONCLUSIONS
Within the limitations of the present study, it can be concluded that:
The hardness and color stability results are
dependent of the material;
Hardness and color stability of both composites progressively decrease as a function of time;
The nanofilled composite Filtek Z350XT presents higher hardness in comparison with the microhybrid Opallis, irrespective of the immersion protocol and evaluation times;
The nanofilled composite Filtek Z350XT is more susceptible to color changes and decrease in hardness when immersed in an acidic dyed solution, irrespective of the immersion time.
ACKNOWLEDGEMENTS
This study was partially supported by grants from CNPq 479744/2010-6 and 163102/2011-2 (P.I. Paulo H. P. D’Alpino), Brazil. The authors are grateful to Dr. Leonardo Fernandes da Cunha for the technical support on color-change analysis.
REFERENCES
1- Curtis AR, Palin WM, Fleming GJ, Shortall AC, Marquis PM. <##!@\ #!@J?J strength. Dent Mater. 2009;25:188-97.
2- D'Alpino PH, Bechtold J, Santos PJ, Alonso RC, Di Hipolito V, Silikas N, et al. Methacrylate- and silorane-based composite restorations: hardness, depth of cure and interfacial gap formation as a function of the energy dose. Dent Mater. 2011;27:1162-9. 3- D'Alpino PH, Vismara MV, Gonzalez AH, Graeff CF. Free radical entrapment and crystallinity of resin composites after accelerated aging as a function of the expiration date. J Mech Behav Biomed Mater. 2014;36C:82-9.
_ !! ! # procedures on color stability of composite resins. J Appl Oral Sci. 2009;17:108-12.
5- Han L, Okamoto A, Fukushima M, Okiji T. Evaluation of physical properties and surface degradation of self-adhesive resin cements. Dent Mater J. 2007;26:906-14.
$ =! = @ ! @ ! # with plasma or halogen light. Eur J Oral Sci. 2005;113:251-7. 7- Lepri CP, Palma-Dibb RG. Surface roughness and color change !\B?!@U@# J. 2012;31:689-96.
8- Manhart J, Kunzelmann KH, Chen HY, Hickel R. Mechanical properties and wear behavior of light-cured packable composite resins. Dent Mater. 2000;16:33-40.
9- Oberholzer TG, Grobler SR, Pameijer CH, Hudson AP. The effects of light intensity and method of exposure on the hardness of four light-cured dental restorative materials. Int Dent J. 2003; 53:211-5.
10- Oliveira GU, Mondelli RF, Charantola Rodrigues M, Franco LB#%=B! @ on roughness and wear of composite resin after simulated toothbrushing. J Appl Oral Sci. 2012;20:510-6.
13- Reis AF, Giannini M, Lovadino JR, Ambrosano GM. Effects of various finishing systems on the surface roughness and staining susceptibility of packable composite resins. Dent Mater. 2003;19:12-8.
14- Rodrigues Junior SA, Zanchi CH, Carvalho RV, Demarco FF. Flexural strength and modulus of elasticity of different types of resin-based composites. Braz Oral Res. 2007;21:16-21. 15- Sabbagh J, Ryelandt L, Bachérius L, Biebuyck JJ, Vreven J, Lambrechts P, et al. Characterization of the inorganic fraction of resin composites. J Oral Rehabil. 2004;31:1090-101.
16- Sabbagh J, Vreven J, Leloup G. Radiopacity of resin-based # ## plate (Digora). Oper Dent. 2004;29:677-84.
17- Santos C, Clarke RL, Braden M, Guitian F, Davy KW. Water absorption characteristics of dental composites incorporating #JL^++^¢^'\{£`£+_
18- Satou N, Khan AM, Matsumae I, Satou J, Shintani H. In vitro
color change of composite-based resins. Dent Mater. 1989;5:384-7.
19- Schulze KA, Marshall SJ, Gansky SA, Marshall GW. Color stability and hardness in dental composites after accelerated aging. Dent Mater. 2003;19:612-9.
^+=#=¡!!!#! @@W< dental composite resins. Biomaterials. 1999;20:1897-908. 21- Silva EM, Almeida GS, Poskus LT, Guimarães JG. Relationship between the degree of conversion, solubility and salivary sorption ! #@ " = 2008;16:161-6.
^^ =¤# ! J composites. J Dent Res. 1981;60:1867-75.
^'=¤#B$#@! experimental dental composites. Eur J Oral Sci. 2000;108:555-60. 24- Ted Pella, Inc. Hardness tables: Mohs hardness scale [online]. 2013 Dec. 10. [cited 2013 Nov 22]. Available from: http://www. tedpella.com/company_html/hardness.htm.
25- Topcu FT, Sahinkesen G, Yamanel K, Erdemir U, Oktay EA, #=B?!!!%#@! dental resin composites. Eur J Dent. 2009;3:50-6.
26- Toyooka H, Taira M, Wakasa K, Yamaki M, Fujita M, Wada T. Radiopacity of 12 visible-light-cured dental composite resins. J Oral Rehabil. 1993;20:615-22.
27- Vouvoudi EC, Sideridou ID. Effect of food/oral-simulating liquids on dynamic mechanical thermal properties of dental nanohybrid light-cured resin composites. Dent Mater. 2013;29:842-50. 28- Wang L, Garcia FC, Amarante de Araújo P, Franco EB, Mondelli RF. Wear resistance of packable resin composites after simulated toothbrushing test. J Esthet Restor Dent. 2004;16:303-15. 29- Watts DC. Radiopacity vs. composition of some barium and strontium glass composites. J Dent. 1987;15:38-43.