33
Ori
gi
na
l A
rti
cle
s
Impact of the diagnosis of diabetes and/or hypertension on healthy
food consumption indicators: a longitudinal study of elderly persons
Francieli Cembranel1
Carla de Oliveira Bernardo1
Silvia Gisele Ibarra Ozcariz1
Eleonora d’Orsi1
1 Universidade Federal de Santa Catarina, Programa de pós-graduação em Saúde Coletiva. Florianópolis, Santa Catarina, Brasil.
Correspondence Francieli Cembranel
E-mail: [email protected]
Abstract
Objective: to evaluate if the prevalence of healthy food consumption indicators among elderly persons with the self-reported diagnosis of diabetes mellitus and/or systemic arterial hypertension (DM and/or SAH) improved after diagnosis of these diseases, and to compare if the prevalence of such indicators was more frequent among elderly persons with DM and/or SAH than in elderly persons without these diseases. Method: a longitudinal study of 1,197 elderly persons aged 60-104 years, living in Florianopolis, Santa Catarina, Brazil, was performed, considering as an outcome the self-reported diagnosis of diabetes and/or hypertension. Healthy consumption indicators (exposures) were considered the maintenance and/or acquisition of the intake of fruit and vegetables ≥3 and ≥2 times/day, respectively, the consumption of fatty meat <2 times/week, and fried foods <2 times/week. Data was analyzed in terms of absolute and relative frequencies, and Poisson Regression was used to obtain the crude and adjusted prevalence of food consumption indicators. Values of p≤0.05 were considered statistically significant. Results: when comparing the prevalences of the indicators of healthy food consumption among elderly persons with DM and/or SAH with those without these diseases, it was observed that only the consumption of fried foods changed positively between the periods 2009-2010 and 2013-2014. This result was statistically significant only for women, with maintaining/acquiring the infrequent consumption of fried foods (<2 times/week) 8.2% higher among elderly women with DM and/or SAH, p=0.043. Conclusion: The prevalence
of healthy food consumption indicators was low and there was almost no difference between older adults with and without DM and/or SAH.
Rev. Bras. Geriatr. Gerontol., Rio de Janeiro, 2017; 20(1): 33-44
34
INTRODUCTION
Chronic noncommunicable diseases (CNCDs) such as diabetes mellitus (DM) and systemic arterial hypertension (SAH) have been identiied as the main causes of death and disability among the elderly. Globally, it is estimated that 25% of elderly persons are carriers of DM and that half have SAH1,2. In Brazil, a time series survey, the Pesquisa Nacional por Amostras de Domicílios (the National Household Sampling Survey) (PNAD), based on a representative sample of around 40,000 elderly people, identiied a signiicant increase in the prevalence of self-reported DM (from 10% to 16%) and SAH (from 44% to 53%)3. These values,
although high, are less severe than high-income countries such as the USA, where the prevalence of DM and SAH among the elderly is estimated at 21.1% and 70.8%, respectively4.
Due to their chronic nature and the severity of complications, the treatment of these diseases does not only include intervention with medication, but above all, lifestyle modiication5. In addition to
regular physical activity, the avoidance of tobacco and alcohol use, and weight control, the World Health Organization (WHO)5,6 emphasizes the importance of the adoption of healthy eating habits (a greater consumption of fruits and vegetables, and lower consumption of sodium, sugars and saturated fats) as an important means of controlling these CNCDs and their secondary complications for health.
Although literature, mainly international6-8, emphasizes the importance of adopting healthy eating habits as one of the most effective means of secondary prevention of DM and SAH, there is still little information in Brazil about the dietary habits of elderly persons with these diseases through population studies9.
Considering the importance of this type of information for health planning, especially in middle-income countries such as Brazil, where CNCDs are responsible for the majority of the spending of the country’s public health system on medicines and hospitalizations10, the primary
objective of the present study was to estimate the prevalence of indicators of healthy and unhealthy
food consumption among elderly persons living in southern Brazil, comparing those with and without the self-reported diagnosis of DM and/ or SAH. The main aims of this study were to evaluate whether the prevalence of healthy food consumption indicators among elderly men and women with self-reported diagnosis of DM and/ or SAH improved following the diagnosis of these diseases, and to compare whether the prevalence of these indicators was more frequent among elderly persons with DM and/or SAH than among elderly persons without these diseases.
METHODS
A prospective, population-based and home-based cohort study was carried out, the research sample of which consisted of elderly individuals aged 60 years or older residing in Florianópolis, Santa Catarina, in the south of Brazil. The study is part of a comprehensive longitudinal survey entitled EpiFloripa Idoso (EpiFloripa Elderly) (http://www.epiloripa.ufsc.br).
EpiFloripa Elderly began in 2009-2010 (baseline) with the objective of examining the living and health conditions of a representative sample of the elderly population of Florianópolis. The initial survey included non-institutionalized elderly people living in the urban area of the city, a population group that represented approximately 10.8% of the total population of Florianópolis in that year (44,460 elderly persons, 18,844 of whom were men and 25,616 of whom were women). In 2013-2014, with the aim of continuing the investigation, the second phase of the study was carried out.
35 for adjustment for possible confounding factors,
the sample size was increased by a further 15%, resulting in a minimum sample of 1,599 individuals.
The sample selection process was carried out by the clustering method in two stages. In the irst stage, all 420 urban census tracts in Florianópolis were placed in increasing order of the average monthly income of the head of the family (R$314.76 to R$5,057.77), allowing 80 of these sectors to be systematically drawn (eight in each income decile). The units of the second stage were households. To select these, the number of private households inhabited in each unit was irst updated, as the registration of households in each sector dates to the year 2000 (the last census conducted before the study). After the recount (amplitude of 61-725 households per sector), sectors with less than 150 households were grouped, while those with more than 500 households were divided in two, considering their respective income deciles. This procedure resulted in 83 census tracts and reduced the initial coeficient of variation from 52.7% to 35.2%. Next, 60 households were randomly selected by census tract, with all the elderly persons residing in the households being considered eligible (an estimated average of one elderly person in every three households or 102 persons per census tract).
In 2009-2010, all the elderly persons living in the randomly selected households were invited to participate in the study (n=1.911). Losses were considered elderly persons who were not located after four visits (with at least one visit at night and one visit at the weekend), and refusals those who refused to answer the questionnaire, resulting in a inal sample of 1,705 elderly persons interviewed at baseline.
The second stage of EpiFloripa Elderly was carried out in 2013-2014. In this phase, all the elderly interviewed in 2009-2010 were considered eligible for a new interview. Hospitalized elderly persons, those who had moved from the city and those who were not located after four attempts (at least one visit at night and one at the weekend) were considered to be losses. Individuals who refused to answer the questionnaire by personal choice were considered refusals. The inal sample resulted in 1,197 elderly people interviewed in the second phase of the study.
It is noteworthy that in both study phases the interview could be answered by a caregiver and/or family member in cases where the elderly person was identiied as suffering cognitive impairment. However, in the present study, such elderly persons were excluded from the data analysis stage (n=49), to avoid the occurrence of information bias.
With respect to data collection, in both phases of the study the interviews were carried out by a team trained in home interviews, and the questionnaires used were pretested. Control of the consistency and quality of the weekly data was also performed, with key questions repeated by telephone among a random sample of 10% of the respondents in both 2009-2010 and 2013-2014. Kappa values for all quality control questions ranged from 0.5-0.9 in both phases of the study.
The dependent variable was established based on the following questionnaire questions: "Has any doctor or health professional ever told you that you have diabetes?"; "Has any doctor or health professional ever said that you have hypertension (high blood pressure)?". Yes and no answers were accepted. The answers of both questions were grouped, thus establishing the outcome variable: self-reported diagnosis of DM and/or SAH, categorized as yes or no. This variable refers to the self-reporting of a CNCD made by the participant at the baseline of the EpiFloripa Elderly study in 2009-2010.
The independent variables, meanwhile, (i.e. the indicators of healthy or unhealthy food consumption) were collected by the EpiFloripa Elderly study in 2009-2010 and in 2013-2014, using the same food questionnaire used in the national study Vigilância de Fatores de Risco e Proteção para Doenças Crônicas por Inquérito Telefônico (Surveillance of Risk and Protection Factors for Chronic Diseases by Telephone Inquiry) (VIGITEL). This instrument includes questions about the daily and weekly frequency of the consumption of food, such as fruit, vegetable, fatty meat/chicken and fried foods11. Monteiro
Rev. Bras. Geriatr. Gerontol., Rio de Janeiro, 2017; 20(1): 33-44
36
achieving satisfactory validity for the majority of the indicators evaluated (sensitivity and speciicity of approximately 80% for indicators of unhealthy food consumption and 42-80% for indicators of healthy food consumption).
From the questions of the food frequency questionnaire, polytomous variables indicative of changes or otherwise in food consumption between the 2009-2010 and 2013-2014 phases were determined. As an indicator of healthy food consumption, a daily dietary intake of fruit (≥3 times/day) and vegetables (≥2 times/day) was considered. A positive diagnosis for this variable refers to the consumption of fruit and vegetables on each of the seven days of the week and at the above mentioned frequency (≥3 times/day for fruit and ≥2 times/day for vegetables)5,13. Therefore, this variable was categorized as: maintained consumption of <3 times/day for fruit and <2 times/day for vegetables between phases, reduced consumption to <3 times/ day for fruit and <2 times/day for vegetables between phases, maintained consumption of ≥3 times/day for fruit and ≥2 times/day for vegetables between phases, and, increased consumption to ≥3 times/day for fruit and ≥2 times/day for vegetables between phases.
Polytomous variables indicative of unhealthy food consumption were also determined. The regular consumption of fatty meat (both red fatty meat and fatty chicken) and the regular consumption of fried foods (foods considered sources of saturated fat) were considered as the consumption of unhealthy food5,13. A negative diagnosis of each of these two variables was determined as consumption ≥2 times/week. Therefore, both variables were categorized as: maintained consumption at ≥2 times/week between phases, increased consumption to ≥2 times / week between phases, maintained consumption at <2 times/week between phases, reduced consumption to <2 times/week between phases.
Finally, a scale of indicators of healthy food consumption was created based on the three variables established above. On this scale, one point was assigned for the maintenance and/or acquisition of a daily food intake of fruit and vegetables (≥3 and ≥2 times/day, respectively), one point was given for
the maintenance and/or acquisition of the infrequent consumption of fatty meats (<2 times/week), and one point was given for the maintenance and/or acquisition of the infrequent food consumption of fried foods (<2 times/week). Thus, a scale of zero to three points was established, where zero represented no indicators of healthy food consumption, and three represented all the indicators of healthy food consumption. The scale was established by considering the positive changes in food consumption indicators between the baseline and the second phase of the study in the construction of the variables (healthy food consumption associated with a lower risk of CNCDs or the health complications arising from the same)5,13.
Demographic and socioeconomic variables such as age (60-69, 70-79, ≥80 years), self-reported skin color (White/Caucasian, Black/Afro-Brazilian, Yellow/Asian-Brazilian and indigenous), schooling (0-8, 9-11, ≥12 years) and monthly family income per capita (in 2013-2014, upper tercile: >R$2000.00, intermediate tercile: ≤R$2000.00 to >R$ 774.00, lower tercile: ≤R$774.00), were used in the present study as confounding variables.
To describe the characteristics of the sample, descriptive analyzes were performed, presenting the results in absolute and relative frequencies with their respective 95% conidence intervals (95% CI). The chi-squared test with Rao-Scott correction was used in these analyzes.
Poisson regression was used to obtain the crude and adjusted prevalence of food consumption indicators among elderly persons with and without the self-reported diagnosis of DM and/or SAH. Demographic and socioeconomic variables that presented a p-value <0.20 in the bivariate association analysis were included in the adjusted analysis as possible confounding factors. The analyzes were further stratiied according to gender, assuming that this variable may exert an important modifying effect on the associations between CNCD status and food consumption14,15. The level of statistical signiicance adopted in all analyzes was p≤0.05.
37 Catarina Federal University) (protocol nº 352/2008
at base line and CAAE nº 16731313.0.0000.0121 for the second phase) and all the participants signed a Free and Informed Consent Form. No conlict of interest was declared.
RESULTS
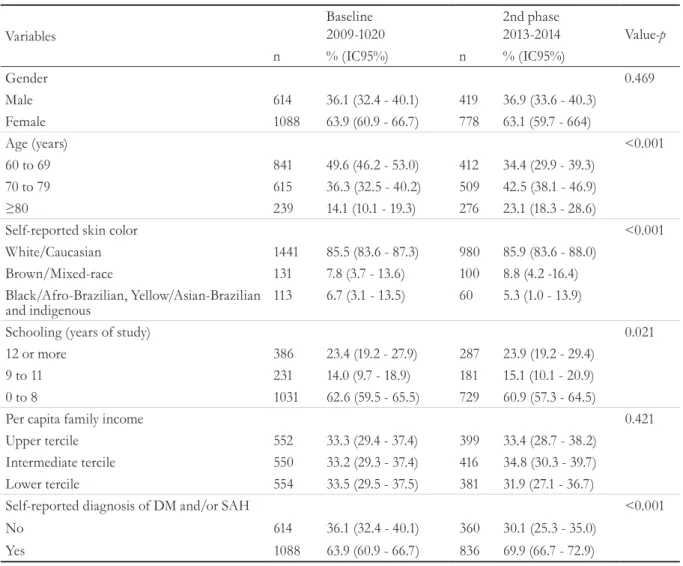
A total of 1,705 elderly persons were interviewed at the baseline of the EpiFloripa Elderly study in 2009-2010. Of these, 1,197 elderly people were located and interviewed again in 2013-2014 (70.2% of baseline respondents). Between the irst and second phases of the study (Table 1), there was no selective lost to follow-up, except for the age variable, a fact explained by the aging of the population evaluated and the
high number of deaths in the sample (n=217) (not shown in the table).
Regarding the characteristics of the study participants, Table 2 shows that in both phases, women presented a higher percentage of self-reported diagnosis of DM and/or SAH than men (p <0.001). In addition, data in this table shows that the majority of respondents did not reach the recommended frequency of daily consumption of fruit and vegetables (≥3 and ≥2 times/day, respectively). Furthermore, the percentage of men and women that consumed or began to consume fatty meat and fried foods with a frequency ≥2 times/week between 2009-2010 and 2013-2014 was high (p=0.031 and p<0.001, respectively).
Table 1. Description of characteristics of sample of EpiFloripa Elderly survey, comparing baseline interviews in 2009-2010 and those in the second phase of the study in 2013-2014. Florianópolis, Santa Catarina, Brazil, 2014.
Variables
Baseline
2009-1020 2nd phase2013-2014 Value-p
n % (IC95%) n % (IC95%)
Gender 0.469
Male 614 36.1 (32.4 - 40.1) 419 36.9 (33.6 - 40.3)
Female 1088 63.9 (60.9 - 66.7) 778 63.1 (59.7 - 664)
Age (years) <0.001
60 to 69 841 49.6 (46.2 - 53.0) 412 34.4 (29.9 - 39.3)
70 to 79 615 36.3 (32.5 - 40.2) 509 42.5 (38.1 - 46.9)
≥80 239 14.1 (10.1 - 19.3) 276 23.1 (18.3 - 28.6)
Self-reported skin color <0.001
White/Caucasian 1441 85.5 (83.6 - 87.3) 980 85.9 (83.6 - 88.0)
Brown/Mixed-race 131 7.8 (3.7 - 13.6) 100 8.8 (4.2 -16.4)
Black/Afro-Brazilian, Yellow/Asian-Brazilian
and indigenous 113 6.7 (3.1 - 13.5)
60 5.3 (1.0 - 13.9)
Schooling (years of study) 0.021
12 or more 386 23.4 (19.2 - 27.9) 287 23.9 (19.2 - 29.4)
9 to 11 231 14.0 (9.7 - 18.9) 181 15.1 (10.1 - 20.9)
0 to 8 1031 62.6 (59.5 - 65.5) 729 60.9 (57.3 - 64.5)
Per capita family income 0.421
Upper tercile 552 33.3 (29.4 - 37.4) 399 33.4 (28.7 - 38.2)
Intermediate tercile 550 33.2 (29.3 - 37.4) 416 34.8 (30.3 - 39.7)
Lower tercile 554 33.5 (29.5 - 37.5) 381 31.9 (27.1 - 36.7)
Self-reported diagnosis of DM and/or SAH <0.001
No 614 36.1 (32.4 - 40.1) 360 30.1 (25.3 - 35.0)
Yes 1088 63.9 (60.9 - 66.7) 836 69.9 (66.7 - 72.9)
Rev. Bras. Geriatr. Gerontol., Rio de Janeiro, 2017; 20(1): 33-44
38
Table 2. Description of sample characteristics related to chronic diseases (diabetes mellitus and/or systemic arterial hypertension) and changes in food consumption indicators between 2009-2010 and 2013-2014, stratified by gender (EpiFloripa Elderly survey 2009-2010 and 2013-2014). Florianópolis, Santa Catarina, Brazil, 2014.
Variables Men Women
n % (IC95%) n % (IC95%) Value-p
Self-reported diagnosis of DM and/or
SAH 2009-2010 (n=1702)* <0.001
No 277 45.1 (41.2 - 49.1) 337 30.9 (28.2 - 33.7)
Yes 337 54.9 (50.9 - 58.8) 751 69.1 (66.3 - 71.8)
Self-reported diagnosis of DM and/or
SAH 2013-2014 (n=1197) <0.001
No 198 48.0 (42.4 - 53.7) 241 31.8 (27.8 - 35.8)
Yes 221 52.0 (46.3 - 57.6) 537 68.2 (64.1 - 72.1)
Changes in daily consumption of fruit
(≥3 times/day) and vegetables 0.154
(≥2 times/day) (n=1193) * * (≥2 vezes/dia) (n=1193)* *
Maintained consumption at <3 for fruit
and <2 for vegetables 341 79.0 (73.7 - 83.5) 550 71.9 (67.5 - 76.9) Reduced consumption to <3 for fruit
and <2 for vegetables 23 6.4 (4.4 - 9.3) 67 7.6 (5.5 - 10.4) Maintained consumption at ≥3 for fruit
and ≥2 for vegetables 10 3.3 (1.3 - 7.9) 42 5.8 (4.0 - 8.3) Increased consumption to ≥3 for fruit
and ≥2 for vegetables 44 11.3 (7.9 - 15.7) 116 14.7 (11.5 - 18.6) Changes in the consumption of fatty meat
(times/week) (n=1194)* ** 0.031
Maintained consumption at ≥2 98 22.8 (17.0 - 29.9) 98 13.6 (8.5 - 21.0) Increased consumption to ≥2 61 19.1 (12.8 - 27.5) 141 19.8 (14.5 - 26.4) Maintained consumption at <2 169 42.1 (33.7 - 50.8) 361 46.5 (38.2 - 55.0) Reduced consumption to <2 90 16.1 (12.0 - 21.2) 176 20.1 (15.1 - 26.3) Changes in the consumption of fried foods
(times/week) (n=1194) * <0.001
Maintained consumption at ≥2 74 16.5 (12.6 - 21.4) 64 7.4 (5.4 - 10.1) Increased consumption to ≥2 39 9.5 (6.3 - 14.2) 63 7.1 (5.4 - 9.3) Maintained consumption at <2 192 48.9 (41.8 - 56.1) 495 66.5 (61.4 - 71.1) Reduced consumption to <2 113 25.0 (19.8 - 31.0) 154 19.0 (15.6 - 22.9)
%: prevalence of food consumption indicators; CI95%: Confidence interval of 95%; p-value of Chi-squared test; * Variables with data ignored; ** Seven days/week consumption; *** Includes the consumption of fat of red meat fat and chicken skin; DM: diabetes mellitus; SAH: systemic arterial hypertension.
Table 3, meanwhile, shows the changes that occurred in the food consumption indicators of the sample, comparing participants with and without the self-reported diagnosis of DM and/ or SAH. Regarding the consumption of fruits and vegetables, the results show that regardless of the diagnosis of DM and/or SAH, most of the sample did not consume fruit or vegetables at the recommended daily frequency, and the percentage
39 Table 3. Description of changes in food consumption indicators between 2009-2010 and 2013-2014, stratified
according to chronic disease status (diabetes mellitus and/or systemic arterial hypertension) (EpiFloripa Elderly Study 2009-2010 and 2013-2014). Florianópolis, Santa Catarina, Brazil, 2014.
Variables of change in food consumption between 2009-2010 and 2013-2014 phases
Without DM and/or SAH With DM and/or SAH
Value-p
n % (IC95%) n % (IC95%)
Changes in daily consumption of fruit (≥3 times/ day) and vegetables (≥2 times/day) (n=1193) **
0.184
Maintained consumption at <3 for fruit and <2 for vegetables
334 78.2 (73.7 - 82.7) 557 72.2 (68.4 - 76.1)
Reduced consumption to <3 for fruit and <2 for vegetables
27 5.8 (3.5 - 8.0) 63 8.1 (5.1 - 11.0)
Maintained consumption at ≥3 for fruit and ≥2 for vegetables
16 3.2 (1.6 - 4.9) 36 5.9 (2.8 - 8.9)
Increased consumption to ≥3 for fruit and ≥2 for vegetables
61 12.8 (8.8 - 16.7) 99 13.8 (10.5 - 17.2)
Changes in the consumption of fatty meat (times/ week) (n=1194) ***
0.669
Maintained consumption at ≥2 79 18.7 (12.3 - 25.1) 117 15.9 (10.6 - 21.2) Increased consumption to ≥2 73 19.2 (13.0 - 24.7) 129 19.7 (13.3 - 26.1) Maintained consumption at <2 191 43.2 (34.4 - 52.1) 339 45.9 (37.7 - 54.1) Reduced consumption to <2 95 18.9 (13.1 - 24.7) 171 18.5 (13.9 - 23.1) Changes in the consumption of fried foods (times/
week) (n=1194) *
0.018
Maintained consumption at ≥2 65 12.8 (8.8 - 17.0) 73 9.5 (6.9 - 12.2) Increased consumption to ≥2 45 10.9 (7.2 - 14.7) 57 6.2 (4.1 - 8.3) Maintained consumption at <2 234 56.2 (48.6 - 63.7) 453 62.3 (57.5 - 67.2) Reduced consumption to <2 94 20.0 (15.5 - 24.6) 173 21.9 (17.8 - 26.1)
%: prevalence of food consumption indicators; CI95%: confidence interval of 95%; p-value of Chi-squared test; * Variables with data ignored; ** Seven days/week consumption; *** Includes consumption of red meat fat and chicken skin; DM: diabetes mellitus; SAH: systemic arterial hypertension.
Table 4 shows the results of the crude and adjusted associations between the food consumption indicators and chronic disease status. In men, in both the crude and the adjusted analysis, the maintenance and/or acquisition of a healthy food consumption of fruits and vegetables, fatty meat and fried foods was more prevalent among elderly persons with DM and/or SAH than among elderly persons without such diseases. However, the differences between these groups were not statistically signiicant. Among women the maintenance and/or acquisition of the infrequent consumption of fried food (<2 times/week) in the adjusted analysis was 8.2% higher among those with DM and/or SAH than among elderly persons without these diseases (p=0.043). However, none of the results found were statistically signiicant.
Re
v. B
ras
. G
eri
at
r. G
ero
nt
ol.,
Rio
de
Jane
iro
, 2
01
7; 2
0(1
): 3
3-4
4
40
Table 4. Crude and adjusted prevalence of consumption of healthy food among elderly persons with and without self-reported diagnosis of diabetes mellitus and/or systemic
arterial hypertension, stratified according to gender (EpiFloripa Elderly study 2009-2010 and 2013-2014). Florianópolis, Santa Catarina, Brazil, 2014.
Men Women
Type of
analysis
Without DM and/or SAH
(n=198)
With
DM and/or SAH
(n=220)
Value-p Without DM and/or SAH
(n=240)
With
DM and/or SAH
(n=535)
Value-p
% (IC95%) % (IC95%) % (IC95%) % (IC95%)
Maintenance and/or acquisition of daily consumption of fruit
(≥3 times/day) and vegetables (≥2 times/day)** CrudeAdjusted* 13.9 (8.9 - 19.0)12.8 (7.8 - 17.7) 15.1 (8.1 - 22.2)13.8 (7.7 - 19.8) 0.7770.802 17.9 (12.0 - 23.7)16.5 (11.3 - 21.8) 21.8 (17.3 - 26.2)23.0 (18.3 - 27.7) 0.2820.079
Maintenance and/or acquisition of infrequent consumption
of fatty meat (<2 times/week)*** CrudeAdjusted* 56.1 (45.9 - 66.2)55.8 (45.0 - 66.5) 60.1 (49.5 - 70.6)60.3 (50.1 - 70.6) 0.4720.430 67.4 (56.7 - 78.1)68.9 (57.5 - 80.4) 66.3 (57.2 - 75.4)65.6 (56.9 - 74.4) 0.8290.510
Maintenance and/or acquisition of infrequent consumption
of fried foods (<2 times/week) CrudeAdjusted* 69.3 (61.2 - 77.4)68.4 (60.4 - 76.3) 78.2 (72.5 - 84.0)78.0 (72.3 - 83.7) 0.1050.080 82.3 (77.0 - 87.7)80.9 (75.3 - 86.6) 86.9 (84.1 - 89.7)87.5 (85.0 - 90.1) 0.1340.043
41
Figure 1. Scale of indicators of healthy food consumption among elderly persons with and without self-reported diagnosis of diabetes mellitus and/or systemic arterial hypertension (DM and/or SAH), stratified according to gender (EpiFloripa Elderly story 2009-2010 and 2013-2014. Florianópolis, Santa Catarina, Brazil, 2014.
Points attributed: one point for maintenance and/or acquisition of daily food consumption of fruit and vegetables (≥3 times/day and ≥2 times/ day, respectively), one point for the maintenance and/or acquisition of infrequent food consumption of fatty meat (<2 times/week); and one point for the maintenance and/or acquisition of infrequent food consumption of fried foods (<2 times/week). As such, 0=no indicators of healthy food consumption, and 3=all indicators of consumption of healthy food consumption. The three variables considered the maintenance or acquisition of healthy food consumption between baseline (2009-2010) and the second phase of the study (2013-2014). *p-value of Chi-squared test comparing indicators of healthy food consumption among participants of study with and without DM and/or SAH; **p-value of Chi-squared test comparing the indicators of healthy food consumption of men with and without DM and/or SAH; ***p-value of Chi-squared test comparing the indicators of healthy food consumption of women with and without DM and/or SAH.
DISCUSSION
The present study represents the irst Brazilian longitudinal study to investigate healthy food consumption indicators among elderly people living in the community with and without the diagnosis of DM and/or SAH. The results revealed that after a three-year follow-up period elderly men and women with DM and/or SA did not generally modify their food consumption as a means of supporting the secondary treatment of these diseases. In addition, the results of the study showed that there were no statistically signiicant differences in the prevalence of food consumption indicators among elderly
persons with and without DM and/or SAH, except for the consumption of fried foods among women, thus corroborating previous results in literature8,9,16.
In Brazil, a cross-sectional survey with representative data of elderly persons from 26 Brazilian state capitals (n=5007) showed that among participants with hypertension, eating habits that are harmful to health, such as the low consumption of fruits and vegetables and the high consumption of saturated fats and sodium, continued even after diagnosis of this disease9. A similar inding was also
found in a longitudinal study in the United States,
Without DM and/or SAH
Without DM and/or SAH With DM
and/or SAH
With DM and/or SAH
Mem
p=0,144**
Womem
Rev. Bras. Geriatr. Gerontol., Rio de Janeiro, 2017; 20(1): 33-44
42
where elderly persons also reported no change in their diet in terms of the consumption of saturated fats, fruit and vegetables after the diagnosis of diabetes8. Another longitudinal study in the United States, with data from the National Health and Nutrition Examination Survey (NHANES 2001-2006), found that 74.0% of participants with DM and/or SAH reported an inadequate regular dietary intake of fruits and vegetables, without any differences between participants with and without such CNCDs in terms of adherence to a healthy lifestyle16.
These results are troubling, considering that studies show that a regular intake of fruits and vegetables and the infrequent consumption of foods that are sources of saturated fat can reduce both blood pressure levels and blood glucose levels16-20. An example of this is the indings of the American Associations of Cardiology19 and
Diabetes20 which show a possibility of reduction of up to 3 to 6 mmHg in blood pressure, as well as an important reduction in insulin resistance (more than 40% in 20 years) following the adoption of healthy food consumption.
Despite this evidence, data from the Pesquisas de Orçamentos Familiares (Family Budget Surveys) survey in Brazil shows that in the last three decades there has been an excessive increase in the acquisition of food sources of saturated fat and reined sugar (300-400%), while the consumption of fruit and vegetables has remained below the recommended level (representing only 3.0% total dietary calories)21.
Considering this, and considering that studies in literature10,22 have associated these negative changes in food consumption patterns with the increase in the prevalence of other CNCDs in Brazil, increasing attention has been paid to the health behavior of the population in recent decades. In 2011, to control and reduce the occurrence of chronic diseases, the Brazilian Ministry of Health launched the “Strategic Action Plan for Coping with Chronic Noncommunicable Diseases in Brazil, 2011-2022”23. Three years later (in 2014), in
a new Ministry of Health initiative, a new edition of the "Food Guide for the Brazilian Population”13
was published, aimed at promoting healthier dietary habits among the population and consequently the primary and secondary prevention of CNCDs. This
is because CNCDs do not only have harmful effects on the health of individuals, but have a major impact on the Brazilian public health system. It is estimated that in Brazil, CNCDs represent an approximate annual cost of R$3.8 billion for outpatient services and R$3.7 billion for hospitalizations10.
As a result, changes in lifestyle are fundamental. However, it is necessary to consider that even in the face of the seriousness of the issue of CNCDs, promoting changes in eating habits is not always an easy task. According to Viebig et al.24, in Brazil, differences in gender, income and schooling are determining factors for the adoption of a balanced diet. These indings may help to explain to a large degree the results of the present study, which identiied higher prevalences among women than men, as well as changes in indicators for the consumption of fried foods after adjustment for income and schooling. Another study carried out in the city of Florianópolis identiied healthier eating habits among women than men25. Although the indings of the aforementioned study are not directly comparable to those of the present study because the sample included only adults, the results of both studies seem to indicate a behavior of healthier eating among women (including those with DM and/or SAH), which probably begins when young and tends to continue until more advanced ages.
43 to negatively affect the secondary prevention of
the diseases investigated, such as ultra-processed products (foods high in reined sugar, sodium and saturated fat). Finally, as a further limitation of the study, there is the diagnosis of fruit and vegetable consumption as healthy at a frequency of ≥3 times/day for fruit and ≥2 times/day for vegetables, as an approximate representation of the recommendations of oficial bodies (≥3 servings/ day for fruit and ≥2 servings/day for vegetables)5,13.
CONCLUSION
In conclusion, the results of the present study revealed that the prevalence of healthy food consumption indicators among elderly persons
in Florianópolis with and without the diagnosis of diabetes mellitus and/or systemic arterial hypertension was low. Furthermore, the longitudinal investigation allowed the inding that there were no signiicant changes in dietary intake between the baseline and the second phase of the study. Considering that changes in lifestyle, especially in relation to eating habits, are a fundamental part of the secondary treatment of diseases such as diabetes and hypertension, it is recommended that more effective public health actions directed at individuals with chronic diseases are elaborated, involving both those responsible for public policies and professionals in different areas of health, with the aim of reaching this population more effectively, in order to improve the prognosis of these diseases and quality of life.
REFERENCES
1. World Health Organization. The World Health Statistics 2012 [Internet]. Geneva: WHO; 2012 [acesso em 12 dez. 2015]. Disponível em: http:// www.who.int/mediacentre/news/releases/2012/ world_health_statistics_20120516/en/
2. World Health Organization. Raised blood pressure: situation and trends. Global Health Observatory (GHO) [Internet]. Geneva: WHO; 2014 [acesso em 12 dez. 2015]. Disponível em: http://www.who.int/gho/ ncd/risk_factors/blood_pressure_prevalence_text/en/ 3. Lima-Costa MF, Matos DL, Camargos VP, Maconko
J. Tendências em dez anos das condições de saúde de idosos brasileiros: evidências da Pesquisa Nacional por Amostras de Domicílio (1998, 2003, 2008). Ciênc Saúde Coletiva. 2011;16(9):3689-96.
4. Mcdonald M, Hertz RP, Unger AN, Lustik MB. Prevalence, awareness, and management of hypertension, dyslipidemia, and diabetes among United States adults aged 65 and older. J Gerontol Ser A Biol Sci Med Sci [Internet]. 2009 [acesso em 12 dez. 2015];64A(2):256-63. Disponível em: https:// academic.oup.com/biomedgerontology/article-lookup/doi/10.1093/gerona/gln016
5. World Health Organization. Diet, nutrition and the prevention of chronic diseases: report WHO Consultation [Internet]. Geneva: WHO; 2003 [acesso em 12 dez. 2015]. (WHO Technical Report Series, 916). Disponível em: http://whqlibdoc.who.int/trs/ who_trs_916.pdf
6. World Health Organization. Global status report on noncommunicable diseases 2014 [Internet]. Geneva: World Health Organization; 2014 [acesso em 30 dez. 2016]. Disponível em: http://apps.who.int/iris/ bitstream/10665/148114/1/9789241564854_eng. pdf?ua=1
7. Gillett M, Royle P, Snaith A, Scotland G, Poobalan A, Inamura M, et al. Non-pharmacological interventions to reduce the risk of diabetes in people with impaired glucose regulation: a systematic review and economic evaluation. Health Technol Assess. 2012;16(33):1-254. 8. Nelson KM, Reiber G, Boyko EJ. Diet and exercise
among adults with type 2 diabetes. Diabetes Care. 2002;25(10):1722-28.
9. Lima-Costa MFF, Peixoto SV, César CC, Malta DC, Moura EC. Comportamentos em saúde entre idosos hipertensos, Brasil, 2006. Rev Saude Pública. 2009;43(Supl 2):18-26.
10. Malta DC, Cezário AC, Moura L, Morais Neto OL, Silva Junior JB. Building surveillance and prevention for chronic non communicable diseases in the National Unified Health System. Epidemiol Serv Saúde 2006;15(1):47-65.
Rev. Bras. Geriatr. Gerontol., Rio de Janeiro, 2017; 20(1): 33-44
44
Received: May 03, 2016 Revised: December 27, 2016 Accepted: February 02, 2017
12. Monteiro CA, Moura EC, Jaime PC, Claro RM. Validity of food and beverage intake data obtained by telephone survey. Rev Saúde Pública [Internet]. 2008 [acesso em 12 dez. 2015];42(4):582-89. Disponível em: http://www. scielo.br/scielo.php?script=sci_arttext&pid=S0034-89102008000400002&lng=en&nrm=iso&tlng=en 13. Brasil. Ministério da Saúde,Secretaria de Atenção
à Saúde, Departamento de Atenção Básica. Guia Alimentar para a População Brasileira. 2ª. ed. Brasília, DF: Ministério da Saúde; 2014 [acesso em 12 dez. 2015]. Disponível em: http://bvsms.saude.gov. br/bvs/publicacoes/guia_alimentar_populacao_ brasileira_2ed.pdf
14. Leblanc V, Bégin C, Corneau L, Dodin S, Lemieux, S. Gender differences in dietary intakes: what is the contribution of motivational variables? J Hum Nutr Diet [Internet]. 2015 [acesso em 16 dez. 2016];28(1):37-46. Disponível em: http://onlinelibrary. wiley.com/doi/10.1111/jhn.12213/abstract;jsessionid= 1E9489989C49C8FAAB6446845C9FF6BC.f04t02 15. Kent JA, Patel V, Varela NA. Gender Disparities in
Health Care. Mount Sinai J Med [Internet]. 2012 [acesso em 12 dez. 2015];79(5):555-9. Disponível em: https:// www.ncbi.nlm.nih.gov/pubmed/22976361
16. King DE, Mainous AG, Carnemolla M, Everett CJ. Adherence to healthy lifestyle habits in US adults, 1988-2006. Am J Med [Internet]. 2009 [acesso em 12 dez. 2015];122(6):528-34. Disponível em: http://www. amjmed.com/article/S0002-9343(08)01207-2/pdf 17. Boeing H, Bechthold A, Bub A, Ellinger S, Haller
D, Kroke A, et al. Critical review: vegetables and fruit in the prevention of chronic diseases. Eur J Nutr [Internet]. 2012 [acesso em 12 dez. 2015];51(6):637-63. Disponível em: https://www.ncbi.nlm.nih.gov/pmc/ articles/PMC3419346/
18. Williams DEM, Prevost AT, Whichelow MJ, Cox BD, Day NE, Wareham N J. A Cross-sectional study of dietary patterns with glucose intolerance and others features of the metabolic syndrome. Br J Nutr [Internet]. 2000 [acesso em 12 dez. 2015];83(3):257-66. Disponível em: Disponível em: acrescentar a URL do documento consultado.
19. Eckel RH, Jakicic JM, Ard JD, Jesus JM, Lee I, Lichtenstein AH, et al. AHA/ACC Guideline on Lifestyle Management to Reduce Cardiovascular Risk: a Report of the American College of Cardiology/ American Heart Association Task Force on Practice Guidelines. Circulation. 2013.
20. American Diabetes Association. Standarts of medical care in diabetes-2013. Diabetes Care. 2013;36 Suppl:11-66.
21. Martins APB, Levy RB, Claro RM, Moubarac JC, Monteiro CA. Increased contribution of ultra-processed food products in the Brazilian diet (1987-2009). Rev Saúde Pública. 2013;47(4):656-65. 22. Monteiro CA, Levy RB, Claro RM, Castro IRR,
Cannon G. Increasing consumption of ultra-processed foods and likely impact on human health: evidence from Brazil. Public Health Nutr [Internet] 2011 [acesso em 12 dez. 2015];14(1):5-13. Disponível em: http://www.wphna.org/htdocs/ downloadsdec2012/2011_PHN_Monteiro_et_al.pdf 23. Malta DC, Silva Jr JBD. O plano de ações estratégicas
para o enfrentamento das doenças crônicas não transmissíveis no Brasil e a definição das metas globais para o enfrentamento dessas doenças até 2025: uma revisão. Epidemiol Serv Saúde. 2013;22(1):151-64. 24. Viebig RF, Pastor-Valero M, Scazufca M, Menezes
PR. Consumo de frutas e hortaliças por idosos de baixa renda na cidade de São Paulo. Rev Saúde Pública. 2009;43(5):806-13.