Chaotic analysis of heart rate dynamics after an exercise
with lexible pole
Ana M. S. AntonioI, David M. GarnerII, Rodrigo D. RaimundoIII,IV, Luiz Carlos de AbreuIII, Marcelo T. NavegaV, Vitor E. ValentiI
DOI: 10.5935/MedicalExpress.2016.05.05
I Universidade Estadual Paulista (UNESP), Faculdade de Ciências e Tecnologia, Centro de Estudos do Sistema Nervoso Autônomo (CESNA), Programa de
Pós--Graduação em Fisioterapia, Presidente Prudente, SP, Brazil.
II Oxford Brookes University, Faculty of Health and Life Sciences, Department of Biological and Medical Sciences, Cardiorespiratory Research Group, Gipsy Lane,
Oxford, United Kingdom.
III Faculdade de Medicina do ABC, Laboratório de Delineamento de Estudos e Escrita Cientiica, Santo André, SP, Brazil. IV Universidade de São Paulo (USP), Faculdade de Saúde Pública, São Paulo, SP, Brazil.
V Universidade Estadual Paulista (UNESP), Faculdade de Filosoia e Ciências, Departamento de Fisioterapia e Terapia Ocupacional, Marília, SP, Brazil.
INTRODUCTION: Exercises with a lexible pole have been applied in clinical practice for upper limb rehabilitation. Nevertheless, its acute efects on cardiac autonomic regulation are unclear.
OBJECTIVE: To evaluate the acute efects of exercise with lexible pole on complex behavior of heart rate variability (HRV).
METHOD: We investigated 32 healthy female volunteers aged between 18 and 25 years who performed a session of exercise with a lexible pole. HRV was analyzed 10 minutes before and 10 minutes immediately after the exercise. RESULTS: Exercises with a lexible pole did not signiicantly change time and frequency domain indices of HRV. Non-linear analysis of HRV through the Higuchi Fractal Dimension was not signiicantly changed during recovery from exercise compared to the control reading at rest.
CONCLUSION: Exercises with the lexible pole were unable to acutely change chaotic behavior of heart rate dynamics. This is advantageous for assessments of levels of rehabilitative treatment required in such patients; and their susceptibility to dynamical diseases.
KEYWORDS: Autonomic Nervous System; Higuchi Fractal Dimension Rehabilitation Medicine.
Antonio AMS, Garner DM, Rodrigo D. Raimundo RD, Abreu LC, Navega MT, Valenti VE. Chaotic analysis of heart rate dynamics after an exercise with lexible pole. MedicalExpress (São Paulo, online): 2016;3(5):M160505
Received for Publication on August 31, 2016; First review on September 27, 2016; Accepted for publication on October 11, 2016; Online on
October 25, 2016
E-mail: [email protected]
■
INTRODUCTIONThe physiological response of the Autonomic Nervous System to exercise is characterized by an initial parasympathetic (vagal) withdrawal and a subsequent increase in sympathetic activity. Following exercise, parasympathetic reactivation is involved in the recovery of heart rate to the basal level.1,2 Accordingly, heart rate variability (HRV) has been widely used to evaluate heart rate autonomic modulation. This is usually measured through traditional time and frequency domain indices.3
A recently introduced technique of exercise
protocol has received attention based on the flexible
pole. It is an apparatus with a mass of 0.8 kg and length
of approximately 150 cm. The flexible pole provides
oscillations induced by movements of the upper limbs.
Exercise protocols using the flexible pole have been
proved to present positive results in shoulder muscle function training.4
Recently, studies assessed HRV responses after
a session of exercise with a flexible pole.5-8 They investigated HRV immediately after an exercise with
flexible pole through traditional time, frequency domain
the Autonomic Nervous System. Subjects were not evaluated on days 10-15 and 20-25 after the beginning of the menstrual cycle.19 We also excluded physically active women based on the International Physical Activity Questionnaire (IPAQ).20
Initial Evaluation
The initial evaluation included measurement of height, age, mass and calculation of body mass index. A digital scale (W 200/5, Welmy, Brazil) with a precision of 0.1 kg was used to assess mass. Height was measured by a Stadiometer (ES 2020, Sanny, Brazil) with 220 cm of extension and a precision of 0.1 cm. BMI was calculated as mass/height2 (mass in kilograms and height in metres).
Exercise with lexible pole
The flexible pole exercise protocol was performed by the volunteers with shoulders flexed, in a standing position
with feet apart (wide base). Exercises were undertaken for 15 seconds with 50 to 60 seconds of rest between each exercise. Three repetitions were executed for each exercise.
Exercises were performed in the following positions:
Shoulders at approximately 180° of flexion; flexible pole parallel to the ground in the frontal plane;
Shoulders at approximately 90° of flexion; flexible pole in the transverse plane;
One shoulder at approximately 90° of flexion; flexible
pole perpendicular to the ground on the sagittal plane.5,6
HRV analysis
The RR intervals were recorded with a mobile HR monitor at a sampling rate of 1 kHz. RR intervals were downloaded through the Polar Precision Performance program (v.3.0, Polar Electro, Finland): this software
enabled the extraction of RR interval file in “txt” format. For data analysis we used 500 RR intervals; initial digital filtering was complemented with manual filtering for the
elimination of artefacts and intrusions. We only included series with more than 95% of the cardiac cycles in sinus rhythm. HRV was analysed in the 10-minute period before the performance of the exercise (control protocol) and in the 10-minute period immediately after the performance
of the exercise with flexible pole (experimental protocol).
Linear analysis of HRV
The spectral components of low frequency (LF: 0.04 - 0.15 Hz) and high frequency (HF: 0.15 - 0.40 Hz) in absolute (ms2) and normalized units were applied for HRV analysis in the frequency domain. The Fast Fourier Transform (FFT) algorithm was necessary to perform the spectral analysis of HRV.21
The pNN50 (percentage of adjacent RR intervals with durations differing by more than 50ms), SDNN (average standard deviation of normal RR intervals) and RMSSD
performance of HRV in response to this specific exercise is
poorly understood. Furthermore, it has been suggested that linear measurements of HRV provide limited information because nonlinear mechanisms are known to participate in the foundation of heart rate dynamics.9
We are assuming that RR intervals behave in a non-linear way analogous to what has been described for Chronic Obstructive Pulmonary Disorder,10 Attention
Deficit Hyperactivity Disorder11 and Epilepsy12,13 as dynamical conditions.14 The benefit of investigating the association with HRV through nonlinear analysis is that it
provides an indicator of the risk of “dynamical diseases”.14 Furthermore, it assesses the level of rehabilitative and physiotherapeutic interventions required for such patients.
The assessment by chaotic global analysis of HRV
in response to flexible pole exercise was inconclusive.7 A examination of HRV provides qualitative measurement of cardiovascular physiology.9 Moreover, it may be expected that a non-linear analysis of heart rate dynamics in response
to flexible pole exercise will provide new information
regarding physiological performance in this type of exercise. Consequently, this study was undertaken to evaluate the
acute effects of flexible pole exercise on nonlinear HRV
behavior analyzed by computing the Higuchi Fractal Dimension.15-16 The current study is part of a general project analyzing HRV in response to different circumstances to determine whether nonlinear dynamic methods have clinical and prognostic applicability and whether dynamic analysis based on chaos theory may complement traditional analysis.17-18
■
METHODStudy Population
To determine the sample size a priori an estimation was required, based on Moreno et al:2 a sample size of 18 participants was stipulated by a two-tailed test hypothesis,
with 5% level of significance and 80% power.
For this study we included 32 healthy female student volunteer subjects, all nonsmokers, aged 19.8 ± 1.6 years height 1.62 ± 0.01 m, mass 58.8 ± 10.0 kg and body mass index (BMI) of 22.2 ± 3.7 m/kg2.
All volunteers were informed with regard to
the procedures of the study and signed a confidential
informed consent letter. Study procedures were approved by the Ethics Committee in Research of UNESP (Case # 0554-2012), and followed the National Health Resolution 466/2012 of October 10, 1996.
We excluded subjects (a) with systolic blood pressure >140 mmHg or diastolic blood pressure >90 mmHg (at
rest); body mass index >35 kg/m2; (b) with cardiovascular,
respiratory, endocrine, neurological disorders; (c) with any
condition that would not allow the subjects to perform the
(square root of the average square differences between normal adjacent RR intervals) indices were used for time domain HRV analysis. For analysis of linear indices (time and frequency domains) we used the Kubios HRV® analysis software.22
Protocol
The exercise protocol was performed in the same room for all volunteers. The recorded temperature ranged from 21°C to 25°C and the humidity from 50% to 60%. Volunteers were instructed not to drink caffeinated
beverages, alcohol or other substances that influence the
autonomic nervous system for 24 hours before the study protocols. Data was always collected between 18:00 and
21:00 to standardize circadian influences.23 All procedures were explained to each subject separately and the subjects were instructed not to talk during the entire protocol.
Statistical Analysis of HRV Linear Indices
To define the sample size, as previously noted, we
performed a sample calculation based on the study of Moreno et al2 considering the RMSSD index. We aimed at
a significant difference for 11 msec, assuming a standard
deviation of 16.2 msec, with an alpha risk of 5% and beta risk of 80%. We obtained a minimum number of 18 subjects per group.
Normal Gaussian distribution of the variables was
verified by the Shapiro-Wilk goodness-of-fit test (z value
>1.0). We applied the paired Student t-test for parametric distributions, or the Wilcoxon test for non-parametric
distributions. We considered differences significant when
the probability of a Type I error was lower than 5% (p < 0.05). To undertake the mathematical analysis, we used the Biostat® 2009 Professional 5.8.4 software.
Higuchi’s Fractal Dimension
As previously noted Higuchi developed an algorithm for measuring the fractal dimension of discrete time sequences.16 It is based on a measure of the length, L(k), of the curve that represents the considered time series while using a segment of k samples as a unit. In this study we used sequences of 500 RR intervals.
If L(k) scales are such that
L(k) ~ k-Df, this defines a curve that will express fractal dimension Df. A simple curve has dimension equal to 1, but a plane has a dimension equal to 2. Df is always between 1 and 2 and quantifies the complexity of the curve. The time series of this curve can be represented on a graph. From a given time series, X(1), X(2), ... , X(N), the algorithm builds k new time series:
where, m is the initial moment, k is the time interval and int(r) is the integer part of a real number r.
For example, for an interval k=4 and a sample of
N=1000 items, the algorithm produces 4 time-series:
:
,
,
, ...,
X
kmX m x m
Q
V
Q
+
k X m
V
Q
+
2
k
V
, , ... ,
int
X m
T
+
TQ
N
-
k
m
V
Y$
k for m
Y
=
1 2
K
: , , , .... ,
: , , , ... , : , , , ... ,
: , , , ... ,
X X X X X
X X X X X
X X X X X
X X X X X
1 5 9 997
2 6 10 998
3 7 11 999
4 8 12 1000
41 42 43 44 Q Q Q Q Q Q Q Q Q Q Q Q Q Q Q Q V V V V V V V V V V V V V V V V
The “length” Lm(k) of each curve Xkm is then calculated as:
int
L k X m i k X m i k
k
N m
k N
1 int / 1 1
m
i N m k
1 $ $ #
$ = + - + -=
-U Q Q Q
TQ
V V VZ V
Y V V
#
/
&Where, N is total number of samples:
Lm(k) is not “length” in the Euclidean sense; in fact,
it represents the normalized sum of absolute values of
difference in ordinates of pair of points distant k (with initial
point m). The “length” of curve for the time interval k, L(k), is calculated as the mean of the k values Lm(k) for m= 1, 2, ... , k:
L k
1
k
mL
mk
k
1
=
=Q
V
/
Q
V
The value of fractal dimension, Df, is calculated by a
least-squares linear best-fitting procedure as the angular coefficient of the linear regression of the log-log graph.
So, when L(k) is plotted against 1/k on a double logarithmic scale, with k = 1,2..., kmax, the data should reside on a straight line, with a slope equal to the Fractal Dimension of X.
Thus, Higuchi Fractal Dimension is defined as the slope of the line that fits the pairs {ln[L(k)], ln(1/k)} in a least-squares sense. In order to choose an appropriate value for the parameter kmax,
Higuchi Fractal Dimension values were plotted against a range of
kmax. The point at which the Fractal Dimension reaches a plateau is considered as a saturation point and that represents the kmax
value which should be selected. At this point the appropriate
level of statistical significance should be maximal.
With a = Df, according to the following formulae: y
= ax + b
D
n
x
x
n
x y
x
y
f
k k
k k k k
2 2
$
=
-R R W W/
/
/ /
/
where, yk=ln L(k),x(k)=ln(1/k).
k=k1, ..., kmax, and n denotes the number of k values for which the linear regression is calculated (2 ≤ n ≤ kmax).
■
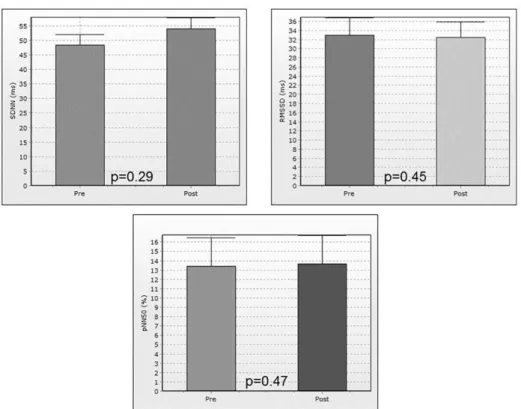
RESULTSLinear Indices of HRV
Figure 1 indicates time domain behavior of HRV
Figure 1 - Time domain indices of HRV before (pre) and immediately after exercise (post) with lexible lexible pole. RMSSD: root-mean square of diferences between adjacent normal RR intervals in a time interval; pNN50: percentage of adjacent RR intervals with a diference of duration greater than 50ms; SDNN: standard deviation of normal-to-normal RR intervals; ms: milliseconds.
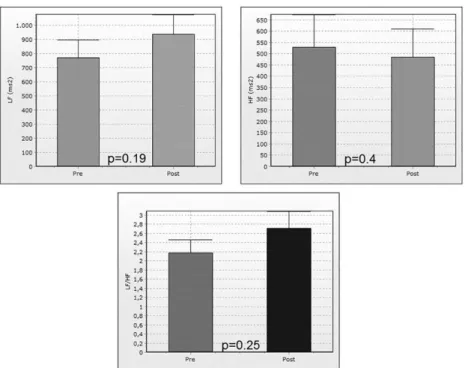
Spectral analysis of HRV indicated no significant
difference for HF, LF and LF/HF ratio between before and im-mediately after the standardized exercise, as shown in Figure 2.
Kmax & Higuchi Fractal Dimension
The box-and-whiskers plot for Higuchi Fractal Dimension of RR intervals. The line in the centre of the box is the median; the whiskers of the outer points are the 10th and 90th percentiles, with the outer edge of the boxes representing the 25th and 75th percentiles. The difference between the outer box edges is the inter-quartile range (Figure 3). All points computed for the Higuchi Fractal Dimension are between 1 and 2.
Normalization tests
Normalization of the data is essential to comprehend
the relevant statistical test of significance to apply. Here we
applied the Anderson-Darling21 and Lilliefors tests.22 The Anderson–Darling test for normality applies an empirical cumulative distribution function. The Lilliefors test is most suitable when the number of subjects is low. Here, there are 32 subjects in each cohort. The results from both tests were inconclusive.
Therefore the parametric one-way analysis of variance;
(ANOVA1) and the non-parametric Kruskal-Wallis23 tests of
significance must be applied, as shown in Figure 4, left. We considered dissimilarities significant when the probability
of a type I error was lower than 5% (p<0.05). The
Kruskal-Wallis test of significance provided a p-value of 0.1433. The
aforesaid optimum value was obtained at a value of Kmax of 80. Observing non-parametric statistics for this optimum value p<0.05 we can recognize that the median value for Higuchi Fractal Dimension increases from 1.9556 to 1.9830 in this cohort - see Figure 4, right.
■
DISCUSSIONPrevious studies have reported the acute effects of
flexible pole exercise performance on cardiovascular and HRV responses. The effects of flexible pole exercise on HRV through
time and frequency domain and geometric indices analysis was considered.5,6 In this project, we investigated HRV through the Higuchi Fractal Dimension analysis and reported an absence of chaotic behavior of HRV before and immediately after a 10
minute session of exercise with the flexible pole.
As ascertained by our statistical analysis, the time and
frequency domain indices of HRV did not significantly vary after
the exercise protocol. The Higuchi Fractal Dimension established lower p-values compared to those calculated from traditional linear indices. Thus, it revealed that HRV analysis by the Higuchi Fractal Dimension may be more sensitive at detecting heart rate changes compared to standard linear techniques.
Ogata et al6 recognized that a period of exercise
Figure 2 - Frequency domain analysis of HRV before (pre) and immediately after exercise (post) with lexible pole. HF: high frequency; LF: low frequency; LF/HF: low frequency/ high frequency ratio. nu: normalized units; msec: milliseconds.
Figure 3 - The mean value in both categories is given by (+). For the Higuchi Fractal Dimension of the RR intervals before lexible pole exercise (left) and after lexible pole exercise (right) subjects calculated multiple times between 10 and 200; equidistantly for diferent levels of Kmax. The number of RR-intervals was 500 and number of female subjects was 32.
Figure 4 - The levels of signiicance (left) - parametric (ANOVA1) and non-parametric (Kruskal-Wallis) for values of the Higuchi Fractal Dimension at speciic levels of Kmax between 10 and 200 at equidistant intervals of 10. The groups compared here are the Higuchi Fractal Dimensions calculated for the 32 female subjects before and after lexible pole exer-cises. Then for this sole optimum value of Kmax of 80 the Higuchi Fractal Dimension (right) before and after lexible pole exercises. Where the line in the central of the box is the
median, the whiskers of the outer points are the 10th and 90th percentiles, with the outer edge of the boxes representing the 25th and 75th percentiles. The diference between the
Furthermore, parasympathetic recovery was noted approximately 30 minutes after the protocol. The authors analyzed the linear, time and frequency domain indices of
HRV. However, they did not report significant HRV responses in the first 10 minutes after exercise. Likewise, we did not detect significant non-linear HRV responses in the initial 10
minutes during recovery from the exercise protocol. This indicates that chaotic behavior of HRV analysed through the Higuchi Fractal Dimension was unaltered during this period. Equally, a previous study5 by our group indicated an absence of HRV responses after a protocol of exercise with
flexible pole. The project successfully analyzed HRV through
time, frequency domain and geometric indices.
Generally, our conclusions support the Higuchi Fractal Dimension as a method of greater sensitivity for analysis and to identify HRV changes.
HRV analysis and its independence provide an improved application of these assessments in order to advance the investigation of new techniques and the physiological rationale.3 It is important to understand that Higuchi Fractal Dimension analysis of HRV does not discriminate the parasympathetic or sympathetic components of cardiac autonomic regulation. It indicates the complexity of HRV. The greater the complexity, the more physiologically adapted the organism.22
It would be advantageous to have larger sets of subjects – there were only 32 here. Superior statistical
significance would have been achieved if the time-series
were longer exceeding, for example 1000 RR intervals, as is
typical as is typical in such studies. Further significance could
be achieved by substituting the Higuchi Fractal Dimension algorithm with Approximate Entropy,24-26 Sample Entropy,27-29 Correlation Dimension algorithms or combinations thereof.30
The present study presents additional findings
compared to previous studies published.5-8 Dos Santos et al8
evaluated the acute effects of flexible pole exercise on heart
rate dynamics through time and frequency domain HRV
indices. The authors did not report significant differences on
SDNN, RMSSD, pNN50, LF (nu), LF (ms2), HF (nu), HF (ms2) and LF/HF ratio. Those indices represent the linear behavior of HRV. Our results provide further information indicating the complex behavior of heart rate autonomic control during
recovery from exercise with flexible pole. The mathematical
method of Higuchi Fractal Dimension applied on RR interval is completely different from the classical mathematical methods used on time and frequency domain analysis.
We also evaluated HRV in different post-exercise periods compared to the references cited.5-8 While we investigated
HRV in the initial five minutes post-exercise, previous studies
evaluated it during the initial 60 minutes after exercise. In this
context, we did not find significant change in complex behavior of HRV after an acute session of flexible pole exercise.
Application of flexible pole exercises has been widely
used in rehabilitation and physiotherapy clinics. Even so,
there are few scientific studies supporting its effectiveness.
Knowledge of the feasibility of its use can bring greater safety to patients with neurological, cardiac and/or metabolic disorders. The application of the protocol to young adults and the lack of research in this area could be a criterion addressed in this study. However, here we evaluated only females in order to avoid gender related effects.
■
CONCLUSIONAn acute session of flexible pole exercise did not significantly modify the chaotic behavior of heart rate
dynamics through Higuchi Fractal Dimension. We suggest this protocol as a procedure to moderate exercise intensity.
■
ACKNOWLEDGEMENTSThe study received financial support from FAPESP
(number 2012/09043-1).
■
CONFLICT OF INTERESTSAuthors declare no conflict of interest concerning
this project.
■
AUTHOR PARTICIPATIONSAll authors participated in the acquisition of data and revision of the manuscript, Antonio, Garner and Raimundo per-formed statistical analysis and drafted the manuscript. Antonio, Navega, Abreu and Valenti designed the project, interpreted the
data and drafted the manuscript. All authors read and gave final
approval for the version submitted for publication.
ANÁLISE CAÓTICA DA DINÂMICA DA FREQUÊNCIA CARDÍACA APÓS EXERCÍCIO COM BARRA FLEXÍVEL
INTRODUÇÃO: Exercícios com uma barra flexível
têm sido usados na prática clínica para a reabilitação do membro superior. No entanto, os seus efeitos agudos sobre a regulação autonômica cardíaca não estão bem esclarecidas.
OBJETIVO: Avaliar os efeitos agudos do exercício
com barra flexível sobre o comportamento complexo da
variabilidade da frequência cardíaca (VFC).
MÉTODO: Foram investigadas 32 voluntárias saudáveis com idades entre 18 e 25 anos que realizaram
uma sessão de exercício com barra flexível. A VFC foi
analisada 10 minutos antes e 10 minutos imediatamente depois do exercício.
RESULTADOS: Os exercícios com a barra flexível não alteraram significativamente os domínios de tempo
da Dimensão Fractal Higuchi mostra que a mesma não
foi significativamente alterada durante a recuperação do
exercício em relação ao controle pré-exercício.
CONCLUSÃO: O exercício com a barra flexível não
alterou profundamente o comportamento caótico da dinâmica da frequência cardíaca. Isto é vantajoso para a avaliação de níveis de tratamento de reabilitação necessário
em tais pacientes; e sua suscetibilidade a doenças dinâmicas. PALAVRAS-CHAVE: Sistema Nervoso Autônomo; Dimensão Fractal Higuchi; Medicina de Reabilitação.
■
REFERENCES1. Pescatello LS, Guidry MA, Blanchard BE, Kerr A, Taylor AL, Johnson AN, et al. Exercise intensity alters postexercise hypotension. Journal of hypertension; 2004; 22:1881-1888. J Hypertens. 2004;22(10):1881-8. http://dx.doi.org/10.1097/00004872-200410000-00009
2. Moreno IL, Pastre CM, Ferreira C, de Abreu LC, Valenti VE, Vanderlei LC. Effects of an isotonic beverage on autonomic regulation during and after exercise, J Int Soc Sports Nutr. 2013;10(1):2. http://dx.doi. org/10.1186/1550-2783-10-2.
3. Camm AJ, Malik M, Bigger JT, Breithardt G, Cerutti S, Cohen RJ, et alHeart rate variability: standards of measurement, physiological interpretation and clinical use. Task Force of the European Society of Cardiology and the North American Society of Pacing and Electrophy-siology Circulation; 1996: 93:1043-65. http://dx.doi.org/10.1161/01. CIR.93.5.1043.
4. Sugimoto D, Blanpied P. Flexible foil exercise and shoulder internal and external rotation strength. J Athl Train. 2006; 41(3): 280-5. 5. Oliveira LS, Moreira PS, Antonio AM, Cardoso MA, de Abreu LC, Navega
MT, et al. Acute effects of flexible pole exercise on heart rate dyna
-mics. Rev Portuguesa de Cardiologia; 2015:(34)35-42. http://dx.doi. org/10.1016/j.repc.2014.07.009.
6. Ogata CM., Navega MT, de Abreu LC Ferreira C, Cardoso MA, Raimundo
RD, et al. A single bout of exercise with a flexible pole induces signifi
-cant cardiac autonomic responses in healthy men. Clinics 2014:(69) 595-600. http://dx.doi.org/10.6061/clinics/2014(09)04.
7. Antonio AMS, Garner DM, Cardoso MA, Abreu LC, Raimundo RD, Navega MT, et al. Behaviour of globally chaotic parameters of heart rate variability follo-wing a protocol of exercise with flexible pole. Russ J Cardiol. 2015;4(120):24-8. DOI: http://dx.doi.org/10.15829/1560-4071-2015-04-22-26. 8. Dos Santos António AM, Navega MT, Cardoso MA, Abreu LC, Valenti
VE. Cardiac autonomic responses induced by a single bout of exer-cise with flexible pole. Int Arch Med. 2014;7(1):40. http://dx.doi. org/10.1186/1755-7682-7-40.
9. Krstacic G, Krstacic A, Smalcelj A, Milicic D, Jembrek-Gostovic M. The “Chaos Theory” and Nonlinear Dynamics in Heart Rate Variability Analysis: Does it Work in Short-Time Series in Patients with Coronary Heart Disease? Ann Noninvasive Electrocardiol. 2007;12(2):130-6. http://dx.doi.org/10.1111/j.1542-474X.2007.00151.x
10. Bernardo AFB, Vanderlei LCM, Garner DM. HRV Analysis - A clini-cal and diagnostic tool in Chronic Obstructive Pulmonary Disease.
Int Scholarly Res Notices; 2014:2014(2) 673232. http://dx.doi.
org/10.1155/2014/673232.
11. Wajnsztejn R, De Carvalho TD, Garner DM, Vanderlei LCM, Godoy MF, Raimundo, RD, et al. Heart rate variability analysis by chaotic global techniques in children with attention deficit hyperactivity disorder. Complexity, 2016;21:412-9. http://dx.doi.org/10.1002/cplx.21700. 12. Ponnusamy A, Marques JL, Reuber M. Comparison of heart rate
varia-bility parameters during complex partial seizures and psychogenic nonepileptic seizures. Epilepsia; 2012;53(8):1314-21. http://dx.doi. org/10.1111/j.1528-1167.2012.03518.x.
13. Ponnusamy A, Marques JL, Reuber M. Heart rate variability measures as biomarkers in patients with psychogenic nonepileptic seizures: potential and limitations. Epilepsy and Behavior; 2011;22(4):685-91. http://dx.doi.org/10.1016/j.yebeh.2011.08.020.
14. Mackey MC, Milton JG. Dynamical diseases, Annals of the New York Academy of Sciences; 1987;504:16-32.
15. Anier A, Lipping T, Melto S, Hovilehto S. Higuchi fractal dimension and spectral entropy as measures of depth of sedation in intensive care unit,” in Engineering in Medicine and Biology Society, 2004. IEMBS’04. 26th Annual International Conference of the IEEE, 2004:526-9. 16. Higuchi T. Approach to an irregular time series on the basis of the
fractal theory. Physica D: Nonlinear Phenomena; 1988;31(2):277-83. http://dx.doi.org/10.1016/0167-2789(88)90081-4.
17. Porto AA, Ferreira C, Abreu LC, Garner DM, Gonzaga L, Valenti V. Symbolic analysis of heart rate variability and its interaction with p-value of normality tests applied on RR intervals. MedicalExpress.
2016;3(2):M160204. http://dx.doi.org/10.5935/MedicalEx
-press.2016.02.04.
18. Nogueira ML, Garner DM, Osório E, Abreu LC, Valenti VE. Globally cha-otic analysis of Heart Rate Variability during acute auditory stimulus
by heavy metal music. MedicalExpress. 2015;2(5):M150504. http://
dx.doi.org/10.5935/MedicalExpress.2015.05.04.
19. Bai X, Li J, Zhou L, Li X. Influence of the menstrual cycle on nonlinear properties of heart rate variability in young women. American Journal of Physiology-Heart and Circulatory Physiology; 2009;297(2):H765-74. http://dx.doi.org/10.1152/ajpheart.01283.2008.
20. Rzewnicki R, Auweele YV, Bourdeaudhuij ID. Addressing overreporting on the International Physical Activity Questionnaire (IPAQ) telephone survey with a population sample. Public Health Nutr. 2003;6(3):299-305. http://dx.doi.org/10.1079/PHN2002427.
21. Blackman RB, Tukey JW. The Measurement of Power Spectra From the Point of View of Communication Engineering. Part II. Bell Sys Tech J. 1958;37(2):289-338. http://dx.doi.org/10.1002/j.1538-7305.1958. tb01523.x.
22. Tarvainen MP, Niskanen JP, Lipponen JA, Ranta-Aho PO, Karjalainen PA. Kubios HRV–heart rate variability analysis software. Comput Methods Programs Biomed. 2014;113(1):210-20. http://dx.doi.org/10.1016/j. cmpb.2013.07.024.
23. Klevecz RR, Kauffman SA, Shymko RM. Cellular clocks and oscillators. Int Rev Cytol. 1984;86:97-128. http://dx.doi.org/10.1016/S0074-7696(08)60178-3.
24. Pincus SM. Approximate entropy as a measure of system complexity. Proceedings of the National Academy of Sciences. 1991;(88)2297-2301. http://dx.doi.org/10.1073/pnas.88.6.2297.
25. Pincus S.M. Approximate entropy (ApEn) as a complexity mea-sure. Chaos: An Interdisciplinary Journal of Nonlinear Science. 1995;5(1):110-7.
26. Hornero R, Abasolo D, Escudero J, Gomez C. Nonlinear analysis of electroencephalogram and magnetoencephalogram recordings in patients with Alzheimer’s disease. Philos Trans A Math Phys Eng Sci. 2009;367(1887):317-36. http://dx.doi.org/10.1098/ rsta.2008.0197.
27. Richman JS, Moorman JR. Physiological time-series analysis using approximate entropy and sample entropy. Am J Physiol Heart Circ Physiol. 2000 Jun;278(6):H2039-49.
28. Ramdani S, Bouchara F, Lagarde J. Influence of noise on the sam
-ple entropy algorithm. Chaos. 2009;19(1):123-31. http://dx.doi. org/10.1063/1.3081406
29. Skinner JE, Carpeggiani C, Landisman CE, Fulton KW. Correlation dimension of heartbeat intervals is reduced in conscious pigs by myo-cardial ischemia. Circulation Research Archives; 1991;68(4):966-76. http://dx.doi.org/10.1161/01.RES.68.4.966