Factors associated with
nutritional status of 7-10
year-old schoolchildren:
sociodemographic variables,
dietary and parental nutritional
status
Fatores associados ao estado
nutricional de escolares de 7 a 10
anos: aspectos sociodemográicos,
de consumo alimentar e estado
nutricional dos pais
Carla de O. Bernardo
IKátia J. Pudla
IIGiana Z. Longo
IIIFrancisco de A. G. de Vasconcelos
IVI Programa de Pós-Graduação em Saúde Coletiva do Centro de Ciências da Saúde da Universidade Federal de Santa Catarina.
II Programa de Pós-Graduação em Nutrição do Centro de Ciências da Saúde da Universidade Federal de Santa Catarina.
III Curso de Graduação em Nutrição do Centro de Ciências da Saúde da Universidade Federal de Santa Catarina.
IV Departamento de Nutrição do Centro de Ciências da Saúde da Universidade Federal de Santa Catarina.
Financiamento: Conselho Nacional de Desenvolvimento Cientíico e Tecnológico (CNPq), proces-so nº. 402322/2005-3.
Correspondência: Carla de Oliveira Bernardo. Departamento de Nutrição, Centro de Ciências da Saúde, Universidade Federal de Santa Catarina, Campus Universitário Trindade, CEP 88040-900 Florianópolis, SC. E-mail: [email protected]
Abstract
Objective: To estimate the prevalence of overweight / obesity in schoolchildren, and to investigate its association with parents’ nutritional status, socioeconomic factors and food consumption. Methods: Cross-sectional study with 1,223 schoolchildren, 7 to 10 years old from Florianópolis, SC. We collected anthropometric measures directly and dietary intake of previous day; parents’ data were collected from a socioeconomic and self-reported anthropometric question-naire. Schoolchildren’s nutritional status was defined using the Body Mass Index (BMI) for age and sex according to the refer-ence data of the World Health Organization (2007), and parents’ nutritional status was defined according to the World Health Organization BMI cutoff points (1995). We performed bivariate and multivariate analysis using Poisson regression. Results:
Prevalence of overweight/obesity was 36.2% in boys and 32.7% among girls. The preva-lence was 56.3% and 27.5% in fathers and mothers, respectively. In the final model, mother’s (p = 0.001) and father’s nutritional status (p = 0.050) remained directly associ-ated with schoolchildren’s overweight/obe-sity. The prevalence of overweight/obesity was 1.58 times higher in schoolchildren with overweight/obese mothers, and 1.41 times higher in schoolchildren with overweight/ obese fathers, compared to mothers and fathers without the condition. Conclusion:
There was a high prevalence of overweight/ obesity among schoolchildren, which was associated with the nutritional status of mothers and fathers.These results confirm the need to prevent overweight/obesity in schoolchildren with actions that also involve the family environment in order to reduce obesity in this population.
Resumo
Objetivo: Estimar a prevalência de sobrepe-so/obesidade em escolares e investigar sua associação com o estado nutricional dos pais, fatores sociodemográficos e de consumo alimentar. Método: Estudo transversal realizado com 1.223 escolares de 7 a 10 anos de Florianópolis, SC. Foram coletados dados socioeconômicos e me-didas antropométricas autorreferidas dos pais, e medidas antropométricas diretas e de consumo alimentar do dia anterior dos escolares. O diagnóstico nutricional dos escolares foi definido a partir do Índice de Massa Corporal (IMC) para idade e sexo de acordo com dados de referência da Organização Mundial de Saúde (2007) e o dos pais segundo os pontos de corte do IMC também da Organização Mundial de Saúde (1995). Realizou-se análise bivariada e mul-tivariada por meio da regressão de Poisson.
Resultados: Prevalência de sobrepeso/ obesidade de 36,2% nos meninos e 32,7% nas meninas. Nos pais e mães a prevalência foi de, respectivamente, 56,3% e 27,5%. Dos fatores investigados, no modelo final per-maneceram associados ao sobrepeso/obe-sidade nos escolares o estado nutricional das mães (p = 0,001) e dos pais (p = 0,050). A prevalência de sobrepeso/obesidade foi 1,58 vezes maior em escolares com mães e 1,41 vezes maior em escolares com pais com sobrepeso/obesidade, quando comparados a mães e pais sem o problema. Conclusão:
Observou-se elevada prevalência de so-brepeso/obesidade nos escolares, e esta se associou ao estado nutricional de pais e mães. Isso evidencia a necessidade de ações de prevenção do ganho excessivo de peso ainda na infância que atuem também no ambiente familiar do escolar, a fim de re-duzir a obesidade neste grupo populacional.
Palavras-chaves: Avaliação nutricional. Sobrepeso. Obesidade. Relações pais-filho. Estudantes. Consumo alimentar.
Introduction
In the last decades there has been a growing interest in the investigation of the prevalence and factors associated with overweight and obesity in 7-10 year-old schoolchildren. 1-12. Some of the key factors
associated with overweight and obesity in schoolchildren, such as inappropriate diets, physical inactivity, parental overweight and obesity, as well as socio-economic and envi-ronmental conditions are widely discussed in the literature in an attempt to understand the genesis of the problem, which has a multi-causal origin. 11,12,13,14
Regarding the socioeconomic factors, according to the Latin American Consensus on Obesity the emerging obesity issue in developing countries is particularly criti-cal and affects not only the economicriti-cally privileged groups but also the less favored13.
In middle-income countries like Brazil, overweight and obesity are more prevalent among the wealthier population, unlike other high-income countries where most of the overweight or obese children and adolescents belong to poorer families. 15,16
Literature has shown that one of the most important risk factors for the devel-opment of overweight/obesity in children is parental overweight or obesity.1,2,10 It also
highlights that the genetic factors are not the only ones to influence its high prevalence because there are sound evidences that the family lifestyle and the development of eating habits and preferences affect the children’s nutritional status3,17
Considering the current worldwide interest in studying the factors linked to schoolchildren overweight/obesity, and observing the literature findings about the relationship between overweight/obesity and socio-economic and demographic vari-ables, this study was performed with a dif-ferential focus on the analysis of the school-children’s eating patterns too. Therefore, the study aims to estimate the overweight/ obesity prevalence in 7 to 10 year-old schoolchildren in the city of Florianópolis, SC, and investigating its connection with the parents’ nutritional status, socio-economic factors and eating habits.
Methods
Design and sampling
This is a cross-sectional study. We used a probabilistic sample of the schoolchildren population at the age of 7 to 10 years old, en-rolled at public and private primary schools in Florianópolis, SC. According to the city’s Municipal Health Secretariat (MSH), in 2006 the number of students in this age range was 25,619.
To calculate the sample size, we consid-ered 10% of prevalence of obesity for chil-dren aged 7 to 10 years 18, with error margin
of 2 percentage points and design effect of 1.3. We added 10% for possible sample losses, resulting in a total final sample of 1230 schoolchildren.
The study applied sampling design in two stages. In the first stage, the schools in Florianópolis were stratified into four strata according to two geographic areas (downtown/continental and beaches ) and the school category (public or private). In each stratum the schools were selected randomly for a total of 17 schools (11 public and 6 private). In the second stage, in each school the children were selected randomly to reach the total necessary sample of 1230 individuals. In the analyses to estimate the prevalence and the associated factors, the design effect and the sampling plan were considered.
The study included schoolchildren in the age range of 7-10 years who were enrolled in the public and private primary schools in Florianópolis, SC, and whose par-ents signed the Term of Free and Informed Consent. Orphans or adopted children were also included in the study, and in this case we considered the age, weight and stature of their respective guardians.
Data collection
The study protocol included the chil-dren’s anthropometric data (weight and height) and information on their typical diet. A questionnaire was sent to the stu-dents’ houses with questions on socio-eco-nomic (education, total monthly income, number of persons living at the domicile), demographic (age and sex) and anthropo-metric (weight and height) data of their parents and it was returned when data were collected from the children.
Ten measurers duly trained to ensure standardized and reliable measurements collected the anthropometric and dietary data in 2007. 19 The children’s
anthropomet-ric measures were taken at school, in accor-dance with Lohman, Roche and Martolell
20 standardized procedures and as
recom-mended by the World Health Organization.21
The children’s weight was taken in ki-lograms, using a Marte digital scale of up to 180 kg, precision of 100 grams, and the schoolchildren were barefoot, wearing light clothes, and positioned at the center of the scale platform.
The stature was measured (in centime-ters) by a Alturexata anthropometer, preci-sion of 1 mm, and the children were still barefoot, in orthostatic position, with the body mass distributed on both legs, arms hanging freely, heels together, straight knees and the head orientated in the Frankfurt plane.
overweight diagnosis was > score-z +1 and ≤ score-z +2 , and for obesity it was > score-z +2. For the analyses of this study, grouped overweight/obesity was considered (> score-z +1).
To obtain the dietary data related to the consumption of foods that protect against risks to health, we used the third version of the Previous Day Food Questionnaire (PDFQ), an illustrated and structured questionnaire designed for schoolchildren.
23 The instrument had its second version
validated by comparing the schoolchildren’s responses with direct observation of school lunch consumption 24, and to consider the
changes suggested in the validation study and in order to better suit the dietary pat-tern of the students to the age range under study, we developed PDFQ-3 23, which was
used in this study. The changes for the third version included adjustments of the figures to represent the body image of older chil-dren and adolescents, and the addition of five foods and one meal after dinner. Thus, PDFQ-3 has six chronologically arranged meals (breakfast, morning snack, lunch, afternoon snack, dinner and evening snack), and each meal was illustrated with 21 foods or food groups. The foods were selected con-sidering the foods availability, the menus offered in the public schools and the Food Guide for the Brazilian Population 25, besides
the dietary patterns of the children in the age range under study. To introduce the questionnaire to the children, four posters (90x120cm) were built, each one showing two meals, identical to those contained in the questionnaire. After delivering the questionnaires, the researchers explained all meals and foods in the figures, and the children were then instructed to draw a circle around the foods illustrated in the questionnaire corresponding to those that they ate at each meal in the day before. To accomplish it, for each meal presented in the poster, the researcher reminded all foods that might be available and at which time of the day the children probably had each meal. If a child did not have one of the meals, he/she should leave blank the
respective part relating to that meal, without underlining any food.
For the study, we considered as protec-tive foods those belonging to the group of fruits, natural fruit juices, vegetables and soups of vegetables. As risk foods we considered those of the group of packaged chocolate-flavored milk, soda drinks, can-dies, packaged snacks, potato chips, pizza and hamburgers.
The variables age, weigh, height and the parents’ education level, besides total monthly income and the number of people leaving in the house (to calculate the month-ly per capita income) were obtained from the socio-demographic and anthropometric questionnaire administered to the parents. The parents’ BMI variable was calculated based on the weight and height informed on the questionnaires. Thus, according to the World Health Organization21, we considered
as underweight those with BMI <18.5 kg/m2,
as eutrophic or with normal weigh those with 18.5≤ BMI <25 kg/m2, as pre-obese
those with 25≤ BMI <30 kg/m2 and obese
those with BMI ≥30 kg/m2
Data Analysis
The dependent variable was the school-children’s nutritional status, categorized as overweight/obese and not overweight/ obese. The independent variable studied were: sex, age, the schoolchildren’s con-sumption of protective foods and consump-tion of risk foods; parents’ educaconsump-tion level and nutritional status; monthly per capita income.
Regarding the protective foods con-sumption, we classified as: appropriate (if the child consumes foods of this category five or six times a day) and inappropriate (if he/she consumes it up to four times a day), according to the World Health Organization14, which recommends
(if consumed twice or more times a day), since the recommended limit for this type of foods, rich in sugars, fats and salt, is one serving per day.25
The schoolchildren’s age was classified as 7, 8, 9 or 10 years. With respect to the parents, the age ranges were: 20 to 29 years, 30 to 39 years and ≥ 40 years, and education level as: never been to school; complete primary education; incomplete/complete secondary education; complete/incomplete higher education. Regarding the nutritional status of the schoolchildren and their par-ents they were classified into two groups: pre-obese/obese and not pre-obese/obese. The monthly per capita income was subdi-vided into three tertiles: 1st (≤R$166.67); 2nd
(R$166.68 to R$375.00) and 3rd (≥R$375.01).
After checking for data consistency, we performed statistical analyses with the soft-ware STATA 10.0, adjusted for the effect of design and sampling methods of the study by using the SVY command. We decided for the Poisson26 bivariate and multivariate
regression because the overweight/obesity prevalence among the schoolchildren was higher than 20%.
At first, bivariate analysis was performed to determine the relation between the de-pendent variable (prevalence of overweight/ obesity) and each independent variable, thus obtaining the prevalence ratios and respective confidence intervals of 95%. Then, multivariate analysis was performed. To select the variables, we used the forward method, remaining in the model only those with value p≤0.20. In the final model, we maintained the variables with statistical significance (p≤0.05). The results were pre-sented in prevalence rations and respective confidence intervals of 95%.
The study was approved by the Ethics Committee for Human Research of the Federal University of Santa Catarina/Center of Health Sciences on April 24, 2006 (under no. 028/06), according to the rules estab-lished by Resolution 196/96 of the National Health Council. There was no conflict of interests in the study.
Results
For the study 1232 schoolchildren were selected, and of this total 9 (0.07%) were excluded for not agreeing to participate in the anthropometric measurements, result-ing in a total final sample of 1223 individuals (99.4%), 602 (49.2%) males and 621 (50.8%) females. With respect to the participation of the schoolchildren’s parents, the response rates were 94.4% for mothers and 82.0% for fathers.
Figure 1 shows the schoolchildren average BMI, per sex, for each age under analysis. The averages between boys and girls were similar, except at 9 years old, where the mean BMI of boys, 18.39kg/m2
(CI95%:17.9-18.9) was significantly higher than of girls, 17.58kg/m2 (CI95%:17.2-17.9).
In spite of that, there was no statistically sig-nificant difference between the prevalence of overweight/obesity between boys and girls at different ages (data not presented).
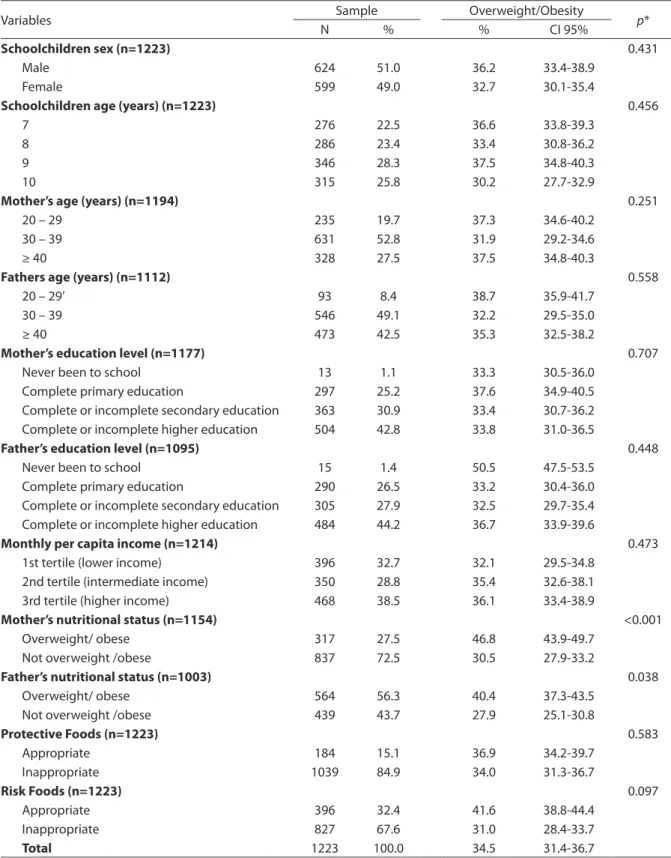
Table 1 presents the sample distribution and prevalence of overweight/obesity in schoolchildren according to the socio-eco-nomic, demographic and anthropometric variables.
We can see that the ratio between genders was similar and most of the inves-tigated individuals were 9 years old. With respect to the schoolchildren’s parents, the predominant age range was 30-39 years. The education level of fathers and mothers was very similar in all categories. Monthly per capita income was also similar in ranges, from the poorest to the richest.
Concerning the mothers’ nutritional sta-tus, we found that nearly one third of them (27.5%) were pre-obese/obese, and in this group the prevalence of overweight/obese schoolchildren was significantly higher than in the group of mothers without the prob-lem (p<0.001). A similar relationship was ob-served in the fathers’ nutritional status, and the higher prevalence of overweight/obesity was found in the group of schoolchildren with pre-obese/obese fathers (p=0.038).
a day, whereas 67.6% of the schoolchildren consumed risk foods twice or more times a day, indicating habits contrary to a healthy diet.
The bivariate analysis showed a p-value <0.20, and the following variables were selected for the final model: the mother’s nutritional status, the father’s nutritional status and health risk diet (data not shown). In the multivariate analysis, the prevalence of overweight/obesity in schoolchildren was associated with the mother’s nutri-tional status (PR:1.58; CI95%:1.26-1.98) and the father’s nutritional status (PR:1.41; CI 95%:1.00-1.99), but less intensive with the other socio-demographic variables added to the model. According to Table 2, we can see that children having pre-obese/obese mothers have 58% more risks of being over-weight/obese than the reference category, whereas schoolchildren whose parents have the problem have 41% more risks than those not having pre-obese/obese parents.
Discussion
According to this study, the prevalence of overweight/obesity (34.5%) among school-children is very high, i.e., 36.2% for boys and 32.7% for girls, without significant statisti-cal difference between gender (p=0.431). By comparing this prevalence with that of
the latest survey conducted on household budgets in 2008/2009, a similar result was found: 34.8% of boys and 32.0% of girls aged 5 to 9 years were overweight/obese. It is known that within the studied age range, the prevalence of overweight/obesity has increased significantly in Brazil over the past decades15, especially among the
high-income population, and in this aspect the Southern region stands out for having the highest Human Development Index (HDI) in relation to the other Brazilian regions28.
Compared with surveys carried out in the state of Santa Catarina, the result is almost identical to the one found by Bertin et al.29 with 259 schoolchildren aged 8 to10
years in the city of Indaial, which was 33.9% of overweight/obesity.
The prevalence of overweight/obesity found in our study was 1.48 times higher among the schoolchildren having pre-obese/obese mothers and 1.32 times higher in children with pre-obese/obese fathers, if compared to mothers and fathers with-out the problem. The findings followed a expected pattern, since other studies con-ducted in other countries and also in Brazil, in different regions, showed a relationship between parental pre-obesity/obesity and overweight/obesity in children.2,6,7 We
can see then that the pre-obesity/obesity condition in parents seems to be a likely
Figure 1 - Distribution of the mean BMI in schoolchildren by age and sex. Florianopolis, Brazil, 2007.
Table 1 - Sample distribution and prevalence of overweight / obesity in schoolchildren aged 7 to 10 years, according to the independent variables. Florianópolis, Brazil, 2007.
Tabela 1 - Distribuição da amostra e prevalência de sobrepeso/obesidade nos escolares de 7 a 10 anos, segundo as variáveis independentes. Florianópolis, Brasil, 2007.
Variables Sample Overweight/Obesity p*
N % % CI 95%
Schoolchildren sex (n=1223) 0.431
Male 624 51.0 36.2 33.4-38.9
Female 599 49.0 32.7 30.1-35.4
Schoolchildren age (years) (n=1223) 0.456
7 276 22.5 36.6 33.8-39.3
8 286 23.4 33.4 30.8-36.2
9 346 28.3 37.5 34.8-40.3
10 315 25.8 30.2 27.7-32.9
Mother’s age (years) (n=1194) 0.251
20 – 29 235 19.7 37.3 34.6-40.2
30 – 39 631 52.8 31.9 29.2-34.6
≥ 40 328 27.5 37.5 34.8-40.3
Fathers age (years) (n=1112) 0.558
20 – 29’ 93 8.4 38.7 35.9-41.7
30 – 39 546 49.1 32.2 29.5-35.0
≥ 40 473 42.5 35.3 32.5-38.2
Mother’s education level (n=1177) 0.707
Never been to school 13 1.1 33.3 30.5-36.0
Complete primary education 297 25.2 37.6 34.9-40.5
Complete or incomplete secondary education 363 30.9 33.4 30.7-36.2 Complete or incomplete higher education 504 42.8 33.8 31.0-36.5
Father’s education level (n=1095) 0.448
Never been to school 15 1.4 50.5 47.5-53.5
Complete primary education 290 26.5 33.2 30.4-36.0
Complete or incomplete secondary education 305 27.9 32.5 29.7-35.4 Complete or incomplete higher education 484 44.2 36.7 33.9-39.6
Monthly per capita income (n=1214) 0.473
1st tertile (lower income) 396 32.7 32.1 29.5-34.8
2nd tertile (intermediate income) 350 28.8 35.4 32.6-38.1
3rd tertile (higher income) 468 38.5 36.1 33.4-38.9
Mother’s nutritional status (n=1154) <0.001
Overweight/ obese 317 27.5 46.8 43.9-49.7
Not overweight /obese 837 72.5 30.5 27.9-33.2
Father’s nutritional status (n=1003) 0.038
Overweight/ obese 564 56.3 40.4 37.3-43.5
Not overweight /obese 439 43.7 27.9 25.1-30.8
Protective Foods (n=1223) 0.583
Appropriate 184 15.1 36.9 34.2-39.7
Inappropriate 1039 84.9 34.0 31.3-36.7
Risk Foods (n=1223) 0.097
Appropriate 396 32.4 41.6 38.8-44.4
Inappropriate 827 67.6 31.0 28.4-33.7
Total 1223 100.0 34.5 31.4-36.7
predisposing factor to the same problem in their children, indicating the family’s influence in creating habits and lifestyles in their children, inclusive eating habits and physical activity, key factors to define the individual’s nutritional status.
The research did not show a significant relation between the household income and overweight/obesity, which corroborates the findings of Alves, Siqueira and Figueiroa30
in a study conducted with 733 children in the city of Recife, PE, but is in disagreement with other surveys, such as of Campos, Leite and Almeida8, conducted with 1158
schoolchildren, in which the prevalence of overweight/obesity was higher in children aged 10-14 year and better socio-economic conditions. An opposite result was observed by Moschonis et al,31 with 9 to 13 year-old
schoolchildren, since the prevalence of overweight/obesity was higher among low/ middle income children. These findings show that there still are controversies re-garding the influence of the socio-economic condition on the schoolchildren’s nutrition-al status, differently from the association already shown in adults. 15
Regarding the parents education back-ground, our study did not find a significant relationship with the schoolchildren’s nutri-tional status. A work performed by Troncon
et al.32with 6 to 14 year-old schoolchildren
did not find a link between the mothers edu-cation level and the children’s nutritional status either, but these results differ from a study on Mexican schoolchildren aged 5 to 10 years, which reported as a risk factor for developing obesity the mothers higher edu-cation background.4 Based on the data from
literature, there is not a consensus about the relationship between the parents’ school-ing and their children’s nutritional status. This is because it is assumed that a higher level represents more knowledge regard-ing healthy lifestyles and habits and might even become a protective factor against overweight/obesity, but this is fallacious because it predisposes to higher income and, consequently, a larger accessibility to all kinds of foods, including fast foods and sedentary lifestyle, which are considered as risk factors for overweight.
In this study, consumption of protective foods or of risk to health has not been related with overweight/obesity in schoolchildren, thus differing from the results of several other studies. Fagundes et al.17 observed that
a diet poor in fruits and vegetables, and the high intake of sugary foods were related to overweight/obese schoolchildren; Lopes, Prado and Colombo12 found soda drinks
as a risk factor for overweight/obesity in
Table 2 -Multiple regression analysis for association of the prevalence of overweight / obesity in schoolchildren with the variables in the model. Florianópolis, 2007.
Tabela 2 - Análise múltipla para associação da prevalência de sobrepeso/obesidade nos escolares com as variáveis incluídas no modelo. Florianópolis, SC, 2007.
Variables PR (CI95%) p value*
Mother's nutritional status 0.001**
Overweight/obese 1.0
Not overweight/obese 1.58 (1.26 – 1.98)
Father’s nutritional status 0.050**
Overweight/obese 1.0
Not overweight/obese 1.41 (1.00 – 1.99)
Consumption of risk foods 0.068
Appropriate 1.0
Inappropriate 0.71 (0.50-1.03)
* valor de p teste de Wald. / * value of p - Wald test.
schoolchildren aged 7 to 10 years, in the same way that Mondini et al.7 identified high
intake of junk food as a risk factor.
The fact that a health risk diet in this study does not appear to be associated with schoolchildren’s overweight/obesity may be due to the PDFQ used for the analyses, since it does not allow to determine the exact amounts of foods consumed, but only the type or the nutritional quality of the foods and the number of meals in which they were eaten in one day 23. Hence, schoolchildren
who ate, for example, a whole pack of sand-wich biscuits, which offers a large amount of calories, were grouped together with chil-dren who ate a single candy. However, the instrument permits to identify the quality of the schoolchildren’s diet and if the health risk foods are consumed more than once a day, which already provides the grounds for suggesting changes and improvements in the dietary habits 23.
Another aspect to consider is related to a diet based on fruits and vegetables, in this study considered as the only protective factor in diets. A healthy diet comprises an increased consumption of these foods25,
which is quite below the recommended lev-els for all age groups in Brazil, including the younger population 33,34. Diets based on this
food group have been investigated for their health protective factor, and findings have been satisfactory even in national surveys. 34
It should be noted that other factors seem to be associated with obesity in the studied age range, which were not included in our study, among them birth weight, missing breakfast, hours watching TV, sleep-ing hours, and parental smoksleep-ing 2,4,6,7 These
and other conditions could be investigated in an attempt to better understand obesity in this population, given its complex eti-ology, which includes biological, genetic and environmental aspects. These aspects, mainly environmental, such as an obeso-genic home environment, with inappro-priate meal times, place and food choices; unhealthy-foods advertising; increased
consumption of ultra-processed foods; physical inactivity; and the accessibility and the low cost of poorly nutritious foods require further in-depth investigations due to the fact that they have been increasing over the years concurrently with increased overweight/obesity.
The use of anthropometric measures as self-reported by the parents could be considered a limitation in this study, as this is a controversial measurement technique. However, investigations have shown that this technique can be used 35,36, because it
offers acceptable information validity levels and has also been used in population-based surveys in Brazil.34
Knowing the difficulties of treating overweigh/obesity in adulthood, especially because of its association with other non-communicable chronic diseases, prevention started early in childhood appears to be the most efficient form to reduce its prevalence. Given this, this study could be considered as having produced more accurate infer-ences about the prevalence of overweight/ obesity in 7 to 10 year-old schoolchildren from Florianopolis, SC, and factors linked to this problem, which can be useful in interventions promoted by the health care and nutrition services to prevent this public health problem. Such actions could be in the form of an increased supply of fruits and vegetables in school meals, as well as increased efforts to enforce the Regulation for School Canteens in the State of Santa Catarina37 to avoid that inappropriate foods
References
1. Whitaker RC, Wright JA, Pepe MS, Seidel KD, Dietz WH. Predicting obesity in young adulthood from childhood
and parental obesity. N Engl J Med 1997; 337: 869-73.
2. Giugliano R, Carneiro EC. Fatores associados à
obesidade em escolares. J Pediatr 2004; 80: 17-22.
3. Assis MAA, Rolland-CacheraMF, GrossemanS,
Vasconcelos FAG, Luna MEP, CalvoMCM. Obesity,
overweight and thinness in schoolchildren of the city
of Florianópolis, Southern Brazil. Eur J Clin Nutr 2005;
59(9): 1015-21.
4. Moraes AS, Rosas JB, Mondini L, Freitas ICM. Prevalência de sobrepeso e obesidade e fatores associados em escolares de área urbana de
Chilpancingo, Guerrero, México, 2004. Cad Saúde
Pública 2006; 22(6): 1289-301.
5. Costa RF, Cintra, IP, Fisberg, M. Prevalência de sobrepeso
e obesidade em escolares da cidade de Santos, SP. Arq
Bras Endocrinol Metab 2006; 50: 60-7.
6. Guimarães LV, Barros MBA, Martins MSAS, Duarte EC.
Fatores associados ao sobrepeso em escolares. Rev Nutr
2006; 19(1): 5-17.
7. Mondini L, Levy RB, Saldiva SRDM, Venâncio SI,
Aguiar JA, Stefanini MLR.Prevalência de sobrepeso e
fatores associados em crianças ingressantes no ensino fundamental em um município da região metropolitana
de São Paulo, Brasil. Cad. Saúde Pública 2007; 23:
1825-34.
8. Campos LA, Leite AJM, Almeida PC. Prevalência de sobrepeso e obesidade em adolescentes escolares do
município de Fortaleza, Brasil. Rev Bras Saúde Matern
Infant 2007; 7: 183-90.
9. Hanley AJG, Harris SB, Gittelsohn J, Wolever TMS, Saksvig B, Zinman B. Overweight among children and adolescents in a Native Canadian community:
prevalence and associated factors. Am J Clin Nutr 2000;
71: 693-700.
10. Bernardo CO, Fernandes PS, Campos RMMB, Adami F, Vasconcelos FAG. Associação entre o índice de massa corporal de pais e de escolares de 7 a 14 anos de
Florianópolis, SC, Brasil.Rev Bras Saúde Matern Infant
2010; 10(2): 183-90.
11. Enes CC, Slater B. Obesidade na adolescência e seus
principais fatores determinantes. Rev Bras Epidemiol
2010; 13(1): 163-71.
12. Lopes PCS, Prado SRLA, Colombo P. Fatores de risco associados à obesidade e sobrepeso em crianças em
idade escolar. Rev Bras Enferm 2010; 63: 73-8.
13. Coutinho W, ed. Documento do consenso latino-americano sobre obesidade [monografia na internet] Rio de Janeiro: ABESO; 1998. Disponível em http:// www.abeso.org.br/pdf/ consenso.pdf [Acessadoem 5 de agosto de 2010]
14. WHO (World Health Organization). Diet, nutrition
and the prevention of chronic diseases. Geneva; 2003.
(Technical Report Series, 916).
15. IBGE - Instituto Brasileiro de Geografia e Estatística. Ministério do Planejamento, Orçamento e Gestão – Pesquisa de Orçamentos Familiares 2008-2009. Antropometria e análise do estado nutricional de
crianças, adolescentes e adultos no Brasil. Rio de Janeiro;
2010.
16. Cardoso LO, Engstrom EM, Leite IC, Castro IRR. Fatores socioeconômicos, demográficos, ambientais e comportamentais associados ao excesso de peso em
adolescentes: uma revisão sistemática da literatura. Rev
Bras Epidemiol 2009; 12(3): 378-403.
17. Fagundes ALN, Ribeiro DC, Naspitz L, Garbelini LEB, Vieira JKP, Silva, AP. Prevalência de sobrepeso e obesidade em escolares da região de Parelheiros do
município de São Paulo.Rev Paul Pediatr 2008; 26(3):
212-7.
18. Abrantes MM, Lamounier JA, Colosimo EA. Comparison of body mass index values proposed by Cole et al. (2000) and Must et al. (1991) for identifying children with weight-for-height index recommended by the World
Health Organization. Public Health Nutr 2003; 6(3):
307-11.
19. Frainer DES, Adami F, Vasconcelos FAG, Assis MAA, Calvo MCM, Kerpel R. Padronização e confiabilidade das medidas antropométricas para pesquisa populacional.
Arch Latinoam Nutr 2007; 57: 335-42.
20. Lohman TG, Roche AF, Martolell R. Anthropometric
standardization reference manual. Illinois: Human
Kinetics Books; 1988.
21. WHO (World Health Organization). Physical status: the
use and interpretation of anthropometry. Geneva; 1995.
452 p. (Technical Report Series, 854).
22. Onis M, Onyango AW, Borghi E, Siyam A, Nishida C, Siekmann J. Development of a WHO growth reference
for school-aged children and adolescents. Bull World
Health Organ 2007; 85(9): Falta inserir números de
páginas
23. Assis MAA, Benedet J, Kerpel R, Vasconcelos FAG, Di Pietro PF, Kupek E. Validação da terceira versão do Questionário Alimentar do Dia Anterior (QUADA-3) para
escolares de 6 a 11 anos. Cad Saúde Pública 2009; 25(8):
1816-26.
24. Assis MAA, Kupek E, Guimaraes D, Calvo MC, Andrade DF, Bellisle F. Test-retest reliability and external validity of the previous day food questionnaire for 7-10-year-old
school children. Appetite 2008; 51(1): 187-93.
25. BRASIL. Ministério da Saúde. Secretaria de Política
de Saúde, Departamento de Atenção Básica. Guia
alimentar para a população brasileira. Brasília - DF:
26. Barros AJ, Hirakata VN. Alternatives for logistic regression in cross-sectional studies: an empirical comparison of models that directly estimate the
prevalence ratio. BMC Med Res Methodol 2003; 3: 21.
27. Pelegrini A, Silva DAS, Petroski EL, Gaya ACA. Sobrepeso e obesidade em escolares brasileiros de sete a nove anos:
dados do projeto Esporte Brasil. Rev Paul Pediatr 2010;
28(3): 290-5.
28. Programa das Nações Unidas para o Desenvolvimento. Instituto de Pesquisa Econômica Aplicada. Fundação João Pinheiro. Fundação Instituto Brasileiro de Geografia e Estatística. Atlas do Desenvolvimento Humano no Brasil. Brasília: PNUD; 2003.
29. Bertin RL, Malkowski IL, Zutter LCL, Ulbrich AZ. Estado nutricional, hábitos alimentares e conhecimentos de
nutrição em escolares. Rev Paul Pediatr 2010; 28(3):
303-8.
30. Alves JGB, Siqueira PP, Figueiroa JN. Overweight and physical inactivity in children living in favelas in the
metropolitan region of Recife, Brazil.J Pediatr 2009; 85:
67-71.
31. Moschonis G, Tanagra S, Vandorou A, Kyriakou AE, Dede V, Siatitsa PE et al. Social, economic and demographic correlates of overweight and obesity in primary-school children: preliminary data from the Healthy Growth
Study. Public Health Nutr 2010; 13(10A): 1693-700.
32. Troncon JK, Gomes JP, Guerra-Júnior G, Lalli CA. Prevalência de obesidade em crianças de uma escola pública e de um ambulatório geral de Pediatria de
hospital universitário. Rev Paul Pediatr 2007; 25: 305-10.
33. Toral N, Slater B, Cintra IdP, Fisberg M. Comportamento alimentar de adolescentes em relação ao consumo de
frutas e verduras. Rev Nutr 2006; 19: 331-40.
34. Moura EC, Morais Neto OL, Malta DC, Moura L, Silva NN, Bernal R, et al. Vigilância de Fatores de Risco para Doenças Crônicas por Inquérito Telefônico nas capitais dos 26 estados brasileiros e no Distrito Federal (2006).
Rev Bras Epidemiol 2008; 11: 20-37.
35.
35. Neto GAB, Polito MD, Lira VA. Fidedignidade entre peso e estatura reportados e medidos e a influência do histórico de atividade física em indivíduos que
procuram a prática supervisionada de exercícios. Rev
Bras Med Esporte 2005; 11: 141-5.
36. Fonseca MJM, Faerstein E, Chor D, Lopes CS. Validade de peso e estatura informados e índice de massa
corporal: estudo pró-saúde. Rev Saúde Pública 2004; 38:
392-8.
37. Santa Catarina. Lei nº 12.061, de 18 de dezembro de 2001. Dispõe sobre critérios de concessão de serviços de lanches e bebidas nas unidades educacionais, localizadas no Estado de Santa Catarina. Lex: Diário Oficial do Estado de Santa Catarina, p.1, 20 de dezembro de 2001.