T E C H N I C A L A R T I C L E
Design of a Dry Cover Pilot Test for Acid Mine Drainage
Abatement in Southern Brazil. I: Materials Characterization
and Numerical Modeling
Anderson Borghetti SoaresÆMariluce de Oliveira UbaldoÆ
Vicente Paulo de SouzaÆPaulo Se´rgio Moreira SoaresÆ
Maria Claudia BarbosaÆ Rose Mary Gondim Mendonc¸a
Received: 4 October 2008 / Accepted: 28 May 2009 / Published online: 18 June 2009 Springer-Verlag 2009
Abstract Pyritic coal wastes produced by a coal benefi-ciation plant in the State of Santa Catarina in southern Brazil are acid generating. In this paper, we report the results from the first phase of a study evaluating the per-formance of dry covers for minimizing generation of acid mine drainage and its release to the environment. The first phase includes our investigation of locally available materials for dry covers. Numerical modeling led to four configurations being selected for testing: a dry cover using a double capillary barrier with bottom ash, a dry cover with a single layer of clay, a dry cover with mixed waste, and waste with no cover. Modeling also showed that the best position for the lysimeter was at the bottom of the exca-vation, where it would not interfere with the water flux in the waste. A subsequent paper will describe the construc-tion of the experimental unit and the results of the geo-technical and geochemical studies.
Keywords Acid mine drainageCapillary barrier
Dry coversPyriteWater flow
Introduction
Acid mine drainage (AMD) is generated when the minerals to be exploited during mining are sulfides or associated with sulfides in the rock matrix, especially iron sulfides such as pyrite. This acidic water can leach metals from the rock matrix, contaminate surface and ground water, and potentially cause serious environmental impacts, such as those outlined in CETEM (2001):
• acidification of surface waters
• increases in metal concentrations in soil, surface water, and ground water
• a reduction in the biological productivity of rivers • ground water contamination
Acid mine drainage results not only in landscape and natural environment degradation but can also cause health problems for the nearby population, with potentially detrimental social and economic impact. In severe cases, the use of water for recreation, agriculture, and consumption may be prohibited (CETEM 2001). AMD and mobilized contaminants can be transported by surface or ground water over large distances. Also, AMD production can last for many years or decades, even after the mineral deposit is exhausted and the mine is closed. The reactions associated with acid drainage generation have been extensively reviewed by Rose and Cravota III (1998).
Brazilian bituminous and sub-bituminous coal tends to have high ash content and high levels of pyrite (FeS2) and
associated metals such as Mn, Al, Zn, and Fe (Borma et al.
2003). The coal reserves in the State of Santa Catarina in southern Brazil comprise 46.3% of the Brazil’s annual production (DNPM 2008). The coal is mostly used in thermoelectric power plants. Coal mining in this region began nearly 140 years ago and has caused substantial A. Borghetti Soares (&)
V. P. de SouzaP. S. M. Soares
Center for Mineral Technology, Brazilian Science and Technology Ministry, Rio de Janeiro, RJ, Brazil e-mail: [email protected]; [email protected]
M. O. UbaldoM. C. Barbosa
Federal University of Rio de Janeiro, COPPE/UFRJ, Rio de Janeiro, RJ, Brazil
R. M. G. Mendonc¸a
Federal University of Tocantins (UFT), Palmas, TO, Brazil
environmental degradation including soil, water, and air contamination (CETEM 2001). The most significant of these is the water pollution caused by AMD (Alexandre and Krebs1995).
From 2000 to 2007, the Center of Mineral Technology (CETEM) coordinated a project entitled ‘Process Optimi-zation for Electrical Energy Generation from Coal and Environmental Reclamation of Areas Degraded by Mining.’ This project was financed jointly by the Brazilian Ministry of Science and Technology and Carbonifera Criciu´ma SA (CCSA) and was directed at achieving five goals. Our study described in this paper addresses one of these goals, which was to evaluate the use of dry covers on coal waste to minimize AMD and its environmental impacts. This study was part of a larger research project lead by CETEM in cooperation with researchers from other Brazilian universities.
Dry Cover Design for AMD Control
Approach
One method for minimizing the impact of AMD is to place a dry cover over pyritic waste deposits. The objective of the cover is to reduce the flux of oxygen and water through the cover into the waste and thereby minimize the rate of oxidation of pyrite and associated generation of an acid drainage (Vanapalli et al. 1996). Covers are generally designed with locally available soil. The performance of a dry cover depends both on the characteristics of the materials used and on climatic conditions. Several researchers have studied dry covers with different config-urations and materials (including Barbour1990; Nicholson et al.1989; O’Kane1996; Skousen 2000; Swanson 1995; Yanful et al.1993).
The most common approach for designing dry covers is to rely on numerical models of hydrological performance in combination with field experiments that are adequately instrumented with monitoring equipment (CETEM, 2001; Soares et al. 2000; Souza et al. 2003; Mendonc¸a et al.
2003a). This approach is outlined in the following steps (O’Kane et al.2002):
• Step 1: investigation of the available materials in the area (sampling, field characterization, and laboratory testing).
• Step 2: numerical modeling of the cover system performance at the specific local climatic conditions. • Step 3: pilot testing at the site with adequate
instru-mentation for monitoring the cover performance under field conditions, such as described by Adu-Wusu and Yanful (2006); Wilson et al. (1995); Woyshner and Yanful (1995); Yanful et al. (1993).
This paper presents Steps 1 and 2 for a project started in 2000 at a CCSA coal mine site, which encompasses a beneficiation plant, a coal waste deposit, and the mine. The coal produced at the mine is shipped by railroad to a thermoelectric power plant nearly 100 km away. The waste was characterized as acid generating by acid-base Fig. 1 Aerial view of the mine site
a
b
accounting (ABA) (Mendonc¸a et al. 2003b), following procedures described by Sobek et al. (1978). After assessing the topography and climatic conditions of the mine site, a dry cover was selected as a most appropriate option to mitigate AMD from the waste, based on both technical and economic considerations.
Fly ash and bottom ash from the thermoelectric power plant were investigated as prospective capillary barriers in the dry covers. At present, the fly ash is shipped to a cement plant and the bottom ash is landfilled. Previous studies, including laboratory column tests and numerical simulations, indicated that the bottom ash would perform well as a dry cover material because it reduced water infiltration and oxygen diffusion into the waste; fly ash was less suitable (Ubaldo2005; Ubaldo et al.2006,2009). One aspect specific to the Brazilian bottom ash is that it does not provide much acid neutralizing capacity (Borma et al.
2003; Mendonc¸a2007), in contrast to bottom ashes tested elsewhere (Wang et al. 2006).
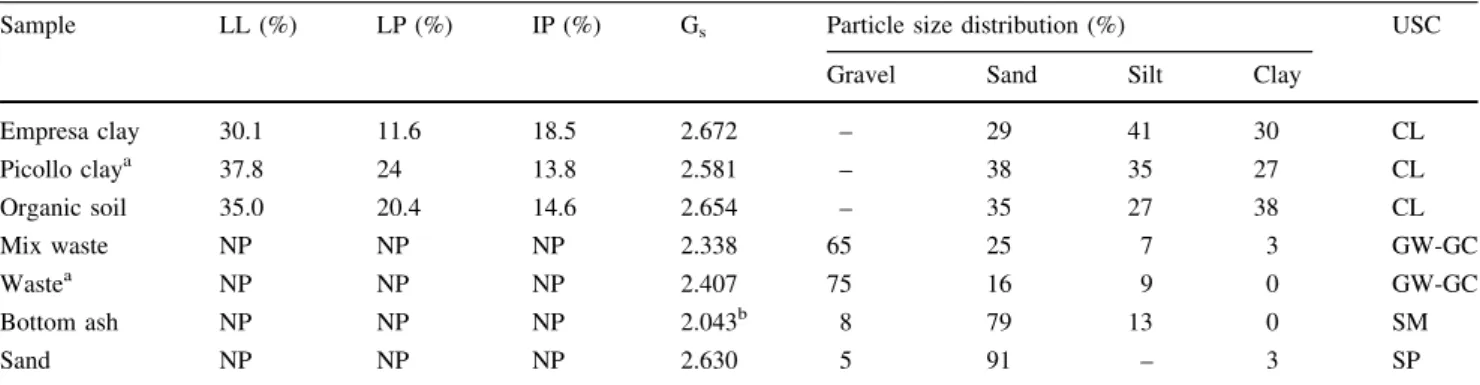
In our study, we selected materials for the covers and analyzed their characteristics. Next, we carried out numerical modeling to design the covers. The modeling was carried out with two objectives: to analyze the hydrological efficiency of different configurations of dry covers and to design experimental cells to test the covers. Table 1 Results of characterization tests: particle size distribution (ABNT–NBR 7181), specific gravity of solids (GS) (ABNT–NBR 7181),
Atterberg limits (LL, LP) (ABNT–NBR 6459, ABNT–NBR 7180) and classification according to the unified soil classification (USC)
Sample LL (%) LP (%) IP (%) Gs Particle size distribution (%) USC
Gravel Sand Silt Clay
Empresa clay 30.1 11.6 18.5 2.672 – 29 41 30 CL
Picollo claya 37.8 24 13.8 2.581 – 38 35 27 CL
Organic soil 35.0 20.4 14.6 2.654 – 35 27 38 CL
Mix waste NP NP NP 2.338 65 25 7 3 GW-GC
Wastea NP NP NP 2.407 75 16 9 0 GW-GC
Bottom ash NP NP NP 2.043b 8 79 13 0 SM
Sand NP NP NP 2.630 5 91 – 3 SP
a Mendonc¸a (2007) b Ubaldo (2005)
Table 2 Compaction parameters
Sample xotm(%) cd(g/cm3)
Empresa clay 16.3 1,680
Bottom ash 42.0 0,990
Picollo claya 25.8 1,408
Organic soil 23.5 1,545
a Mendonc¸a (2007)
Table 3 Results of the saturated hydraulic conductivity tests
Sample ksat(cm/s)
Empresa clay 3.25910-6
Sand 1.72910-2
Bottom ash 2.45910-4
Picollo claya 1.12910-7
Organic soil 5.22910-6
a Mendonc¸a (2007)
0.1 1 10 100 1000 10000 100000 1000000
0 20 30 40 50 60
10
Volumetric water content (%)
0 20 30 40 50 60
10
Volumetric water content (%)
Suction (kPa)
0.1 1 10 100 1000 10000 100000 1000000
Suction (kPa)
Organic Soil
Empresa clay
Coarse waste
Mixed waste Curve of Organic Soil
Curve of Empresa Clay
Curve of C. Waste
Curve of M. Waste
a
b
The modeling results were used to design the dry cover configurations to be evaluated in the pilot tests.
Mine Site Description and Climate Conditions
The annual coal production of the CCSA is about 2.769106 tons per year. An aerial view of the site is shown in Fig.1. The coal layer occurs stratigraphically under recent sedimentary cover comprised of impervious clayey soil (3–5 m) and alluvial pebbles and gravel (15– 25 m) deposited in an erosive unconformity in the sedi-mentary sequence of the Parana´ Basin. This sequence consists of silts and stratified clayish rocks that overlay sandstones and sandy silts that interfinger the coal layers of the Rio Bonito formation, forming extensive lateral for-mations at depths of 100–250 m (Mendonc¸a 2007). The run of mine (ROM) product has an ash content of 58% and a sulfur content of 3.2%. About 65% of the ROM is waste and 35% is coal (CETEM 2001). After processing, the ROM yields two wastes, both with high pyrite contents: a coarse waste (B25 mm) and a fine waste (approximate mean diameter of 1 mm).
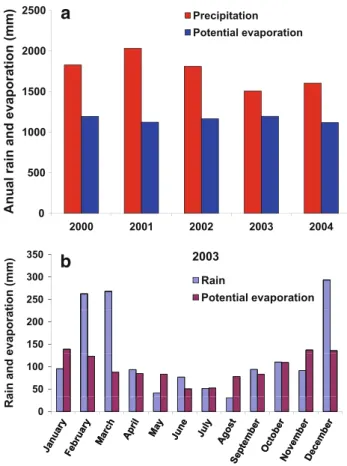
The climate in the State of Santa Catarina is mesother-mic-seasonal, characterized by the collision of hot inter-tropic and cold polar air masses. The polar front oscillations that reach the area have a major influence on the climate and cause two particular features of the regional climate: instability and high rainfall (Borma et al. 2002). A rainy summer and a dry winter characterize the climate; the warmest months are December–February and the coldest
from June to August. The average annual precipitation is 1480 mm/year, with the highest monthly averages recorded from September to March and the lowest values recorded from April to August. Evaporation is governed by tem-perature and solar radiation, which are both higher during the summer months; potential evapotranspiration is highest from October to March and lowest from April to September.
The meteorological data used in the numerical modeling studies were obtained from the Urussunga Meteorological Station for the period 2000–2004. This station was the closest to the mine site with data of sufficient detail required for the model development. Figure2 shows the evaporation and rain data for the 2000–2004 period of record that was used for numerical modeling, and also the monthly data on rainfall and evaporation for 2003.
Laboratory and Field Tests
The first step was to sample the materials that could be employed as dry covers. Samples (sand, Empresa clay, Picollo clay, waste, mixed waste, organic soil, and bottom ash) were collected in plastic bags and characterized, and their in situ water content was determined (ABNT1986c). Laboratory tests (particle size distribution, specific gravity of soils, Atterberg limits, saturated hydraulic conductivity, soil water characteristic curve, consolidation, and com-paction) were conducted at the Laboratory of Geotechnics– COPPE/UFRJ. The test results for particle size distribution tests (ABNT1984a), specific gravity of solids (GS) (ABNT
1984a) and Atterberg limits (LL, LP) (ABNT1984b,c) are shown in Table1. The samples were classified according to the unified soil classification (USC). In a preceding study, Mendonc¸a (2007) performed tests in a double reservoir laboratory cell to define the relationship between the oxy-gen diffusion coefficient and geotechnical parameters such as degree of saturation, water content, porosity and suction using samples from the mine site.
Table 4 Coefficients of volume change
Material mv(1/kPa)
Bottom ash 6.4910-4
Empresa clay 4.2910-4
Picollo claya 4.2910-4
a Mendonc¸a (2007)
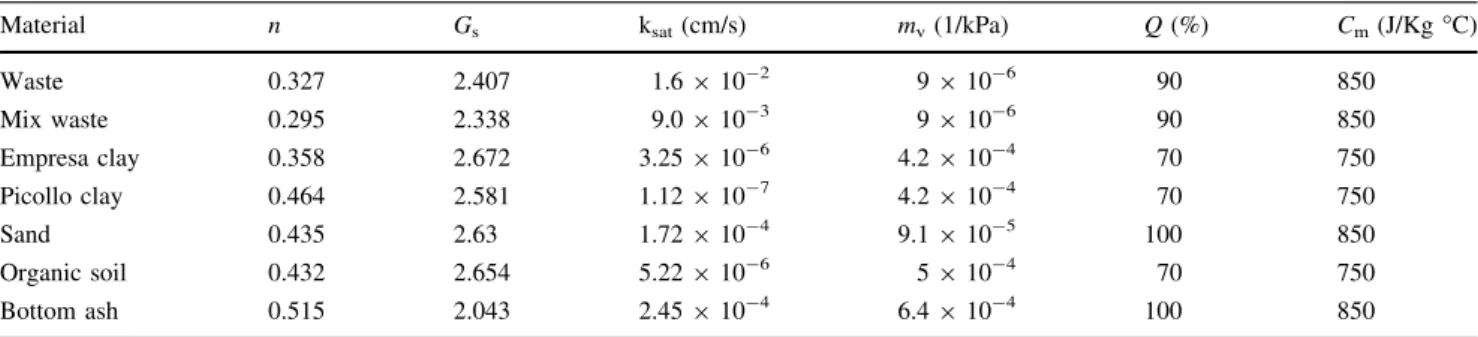
Table 5 Parameters used in the simulations with SoilCover
Material n Gs ksat(cm/s) mv(1/kPa) Q(%) Cm(J/KgC)
Waste 0.327 2.407 1.6910-2 9910-6 90 850
Mix waste 0.295 2.338 9.0910-3 9910-6 90 850
Empresa clay 0.358 2.672 3.25910-6 4.2910-4 70 750
Picollo clay 0.464 2.581 1.12910-7 4.2910-4 70 750
Sand 0.435 2.63 1.72910-4 9.1910-5 100 850
Organic soil 0.432 2.654 5.22910-6 5910-4 70 750
Bottom ash 0.515 2.043 2.45910-4 6.4910-4 100 850
nporosity,Gsspecific gravity solids,ksatsaturated hydraulic conductivity,mv coefficient of volume change,Q sample quartz percent, and
Compaction tests were carried out according to the standard ABNT (1986b), on a sample drying in air. Results of optimum water content (xotm) and maximum dry unit
weight (cd), for the normal proctor compaction energy are
shown in Table2. The dry unit weight of a compacted soil, for a certain compaction energy, depends on the water content of the soil so that there is an optimum water con-tent to compact the soil that corresponds to a maximum dry unit weight (smaller saturated hydraulic conductivity).
In the saturated hydraulic conductivity tests (ABNT
1985, 2000), the samples were compacted in cylinders with diameter of 14.14 cm, at the optimum water con-tent, except for the organic soil, which was compacted at 2% below the optimum (Table3). The hydraulic conductivity of the waste was determined in the field (waste=1.6910-2
cm/s).
The soil water characteristic curve of the samples was obtained using the filter paper method (ASTM D5298-03) and the Richards extractor. Calibration curves of paper fil-ters are generally used to determine suction values above 80 kPa (Chandler and Gutierrez1986). We used a calibra-tion curve proposed by Chandler et al. (1992) that allows the determination of suction values from 0 to 29 MPa. The samples were tested with the same initial water content and dry unit weight as was used for the tests of saturated hydraulic conductivity. The experimental points of the soil
water characteristic curves were adjusted using the Fredl-und and Xing method (1994a), except for the curves of the waste that were obtained from the particle size distribution curve, using the Kovacs method modified by Aubertin et al. (2003). The curves are presented in Fig. 3.
The variation of the unsaturated hydraulic conductivity with the suction (or volumetric water content) was esti-mated from the soil water characteristic curve using equations available in the literature that provide a good fit to experimental data (Fredlund and Xing 1994b; Van Genuchten1980). The use of this method is well documented. The soil water characteristic curves of the waste are similar to the curve of the sand, with an abrupt drop of the water content as the suction increases, a low air-entry value (lower than 1 kPa) and a residual water content associate to the low suction value (\100 kPa). For the clayed materials (organic soil, picollo clay and empresa clay) the air-entry value is typical and the curves decrease smoothly. The bottom ash has an intermediate behavior, between the sandy and the clayed samples, with a high air-entry value and, an accentuated drop of the water content as the suction increases.
The consolidation test (procedure ABNT1986a) deter-mined the coefficient of volume change (mv), which is an input of the numeric modeling. The mv values are pre-sented in Table4.
Fig. 4 Cases studies in simulation 1 (no scale, quotes in meters)
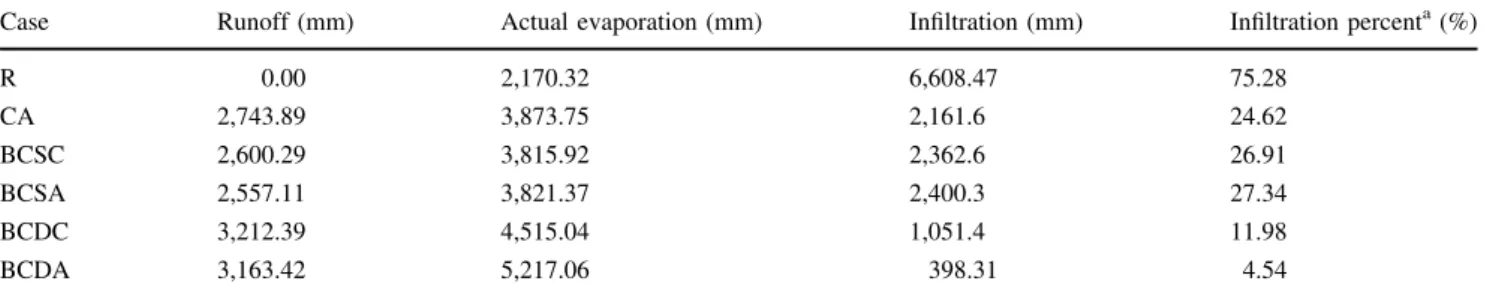
Table 6 Results of Simulation 1 for the period 2000–2004 (cumulative precipitation 8,777 mm)
Case Runoff (mm) Actual evaporation (mm) Infiltration (mm) Infiltration percenta(%)
R 0.00 2,170.32 6,608.47 75.28
CA 2,743.89 3,873.75 2,161.6 24.62
BCSC 2,600.29 3,815.92 2,362.6 26.91
BCSA 2,557.11 3,821.37 2,400.3 27.34
BCDC 3,212.39 4,515.04 1,051.4 11.98
BCDA 3,163.42 5,217.06 398.31 4.54
Numerical Modeling of the Water Flow
The water flow was modeled with two software packages: (1) SoilCover (GeoAnalysis 2000), a one-dimensional, finite element program used to simulate water movement in an unsaturated system of waste and cover layers, incorpo-rating infiltration and evapotranspiration; and (2) SeepW (Geoslope International Ltd 1998), a two-dimensional, finite element program that can mathematically simulate the physical process of water flow through a porous medium.
The SoilCover software relies on the principles of Darcy’s and Fick’s laws to describe the flow liquid and water vapor, and Fourier’s law to describe conductive heat flow (GeoAnalysis 2000). The relationship between weather parameters and potencial evapotranspiration are based on the Penman formulation (Wilson 1990). Soil-Cover was first used to choose the type of cover; a single
b
a
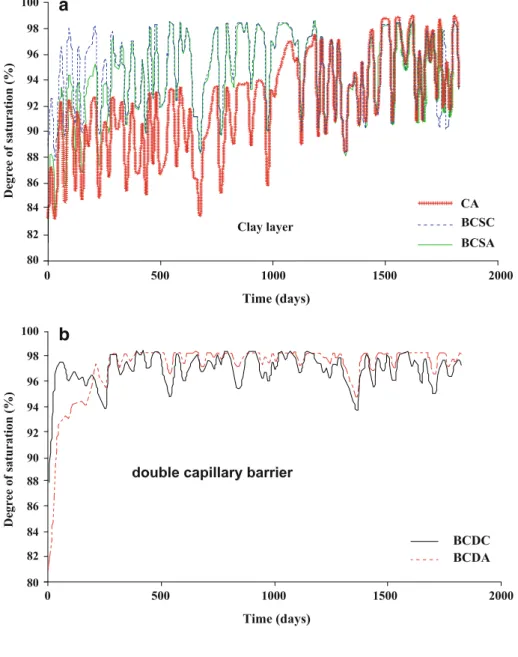
Fig. 5 Simulated degrees of saturation for the clay layer for: aCA, BCSC, and BCSA cases; bBCDC and BCDA (Souza et al.2007)
cover with clay and a capillary-barrier cover were tested. Two alternatives were examined for the capillary barrier cover: a single and a double capillary barrier. Bottom ashes and sand were tested as materials for the capillary barriers. SoilCover was then used, in Simulation 2, to examine the use of a cover with mixed waste and a layer of organic soil as detailed later on. For the SoilCover modeling, a 10 m high waste pile was used to represent an actual waste pile and the cover layers were set as 30 cm thick. Previous modeling studies showed that this thickness led to layers with good performance as hydraulic barriers (Mendonc¸a et al.2003a).
SeepW (Geoslope International Ltd1998) was used to define the best position of the lysimeter.
SoilCover Simulation 1
The input parameters used in SoilCover Simulation 1 are presented in Table5. The initial conditions were set as: constant water content in layers (optimum water content for compacted materials and field water content for non compacted material). Climatic data, from 2000 to 2004 (rain, net radiation, wind speed, etc.) were used as upper boundary conditions and free drainage was used as lower boundary condition. The vertical spacing of the mesh was 10–30 cm for waste and 2–3 cm for all of other materials.
The Picollo clay was tested with capillary barriers, as shown in Fig. 4.
Tests were identified as follows: 1. waste without cover (R); 2. waste ?cover of clay (CA);
3. waste ?simple capillary barrier using bottom ash (BCSC);
4. waste ?simple capillary barrier using sand (BCSA); 5. waste ?double capillary barrier using bottom ash
(BCDC);
6. waste ?barrier double capillary using sand (BCDA). Table6 shows the results of the simulation at a point 60 cm deep into the waste.
SoilCover calculates the runoff from the rates of infil-tration, precipitation, and evaporation. The results shown in Table6 denote that the covers with a simple capillary barrier (BCSC and BCSA) and with a clay layer (CA) had higher infiltration than covers with a double capillary barrier (BCDC and BCDA).
Figure5b shows that the degree of saturation of the clay layer of the covers with a double capillary barrier is always above 85%. This saturation level corresponds to negligible oxygen diffusion into the tailings (Yanful1993). Figure5a shows that for the remaining cases, the degree of saturation sometimes reaches values below 85%.
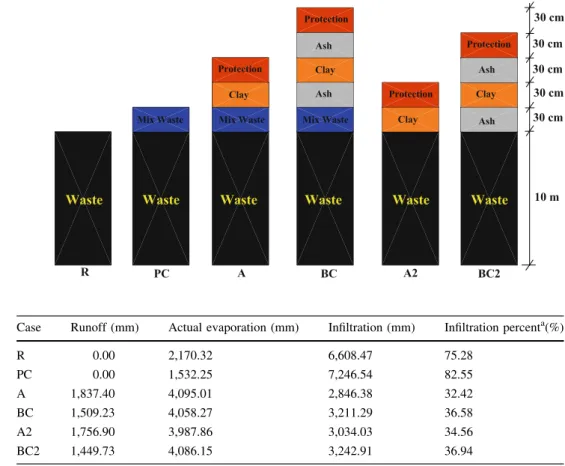
Fig. 7 Waste mixtures and different cover configurations investigated in the second set of simulations
Table 7 Results of Simulation 2 for the period 2000–2004 (cumulative precipitation: 8,777 mm)
a Relative to total precipitation
Case Runoff (mm) Actual evaporation (mm) Infiltration (mm) Infiltration percenta(%)
R 0.00 2,170.32 6,608.47 75.28
PC 0.00 1,532.25 7,246.54 82.55
A 1,837.40 4,095.01 2,846.38 32.42
BC 1,509.23 4,058.27 3,211.29 36.58
A2 1,756.90 3,987.86 3,034.03 34.56
Infiltration into the waste was greater when bottom ashes were used as double capillary barriers. However, the bottom ash used as double capillary barrier kept a higher degree of saturation in the clay layer even in a year of small precipitation (i.e. 2003). Figure6 shows the degree of saturation in the clay layer for the double capillary barrier cases (BCDC and BCDA) in 2003 (the lowest cumulative rainfall between 2000 and 2004). The initial conditions were the same as described before.
Based in the results of Simulation 1, we decided to use covers with double capillary barrier and the bottom ash as the drain material in Simulation 2.
Soilcover Simulations 2
These simulations were run with a more complex dry cover that included a layer of mixed waste (a mixture of coarse and fine particles from two different streams of the coal beneficiation plant, which are used as a cover on the actual waste pile at the mine site). A layer of organic soil was also simulated on top of some covers, as detailed later on.
The Empresa clay was tested with capillary barriers as shown in Fig. 7. The tests were:
1. waste with no cover (R); 2. waste ?mix waste layer (PC); 70
75 80 85 90 95 100
Degree of Saturation (%)
Protection Clay Simulation "A"
70 75 80 85 90 95 100
0 200 400 600 800 1000 1200 1400 1600 1800 2000
Time (days)
0 200 400 600 800 1000 1200 1400 1600 1800 2000
Time (days)
Degree of Saturation (%)
Protection Clay Simulation "BC"
a
b
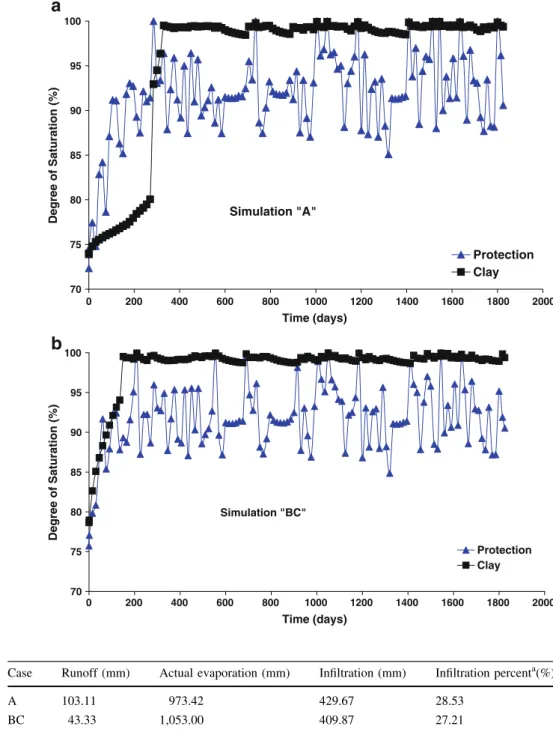
Fig. 8 Degree of saturation in the clay and in the organic soil:asimulation case A; bsimulation case BC
Table 8 Results for the year 2003 (cumulative precipitation: 1,506.02 mm)
a Relative to total precipitation
Case Runoff (mm) Actual evaporation (mm) Infiltration (mm) Infiltration percenta(%)
A 103.11 973.42 429.67 28.53
3. waste?mix waste ?clay layer?organic soil (A); 4. waste?mix waste ?double capillary barrier (with
bottom ash)?organic soil (BC); 5. waste?clay ?organic soil (A2);
6. waste?double capillary barrier (with bottom ash)?organic soil (BC2).
60 65 70 75 80 85 90 95 100
0 40 80 120 160 200 240 280 320 360 400
Time (days)
Degree of Saturation (%)
Protection Clay Simulation "A"
60 65 70 75 80 85 90 95 100
0 40 80 120 160 200 240 280 320 360 400
Time (days)
Degree of saturation (%)
Protection Clay
Simulation "BC"
a
b
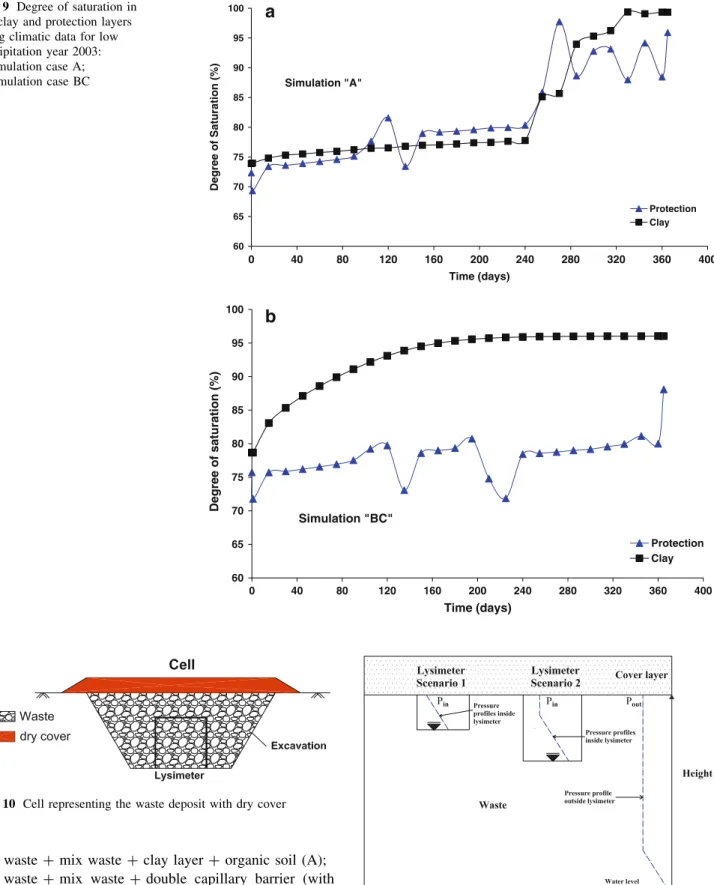
Fig. 9 Degree of saturation in the clay and protection layers using climatic data for low precipitation year 2003: asimulation case A; bsimulation case BC
Fig. 10 Cell representing the waste deposit with dry cover
Simulation 2 was performed with the same initial and boundary conditions and mesh applied for Simulation 1. The results of the Simulations 2 are shown in Table7.
The mixed waste layer (A and BC) did not signifi-cantly reduce water infiltration into the waste, compared
to the cases where it was not used (A2 and BC2). The soil–water characteristic curves for the waste were obtained from the particle size distribution curves (Aubertin et al. 2003). The results for the degree of saturation in the clay for cases A and BC are shown in Fig.8. The clay layer reached a high degree of satura-tion (faster in the BC case) that remained constant. In the organic soil, the degree of saturation oscillated because this layer was more directly influenced by the climatic conditions.
Modeling was repeated using the 2003 data, which had the lowest annual precipitation rate (1,506.02 mm/year). In both cases, the clay layer was less than 85% saturated during most of the year in case A. This saturation degree is not sufficient to minimize oxygen flow into the waste pile. The saturation degree of the clay observed in case BC was higher than 85%. Results are presented below (Table8; Fig.9).
As a result of the SoilCover modeling, the experiment was designed with four different waste deposit configurations: 1. waste (no cover);
2. waste ?mix waste;
3. waste ?mix waste ?clay?organic soil;
4. waste ?mix waste?double capillary barrier (with bottom ash) ?organic soil.
Modeling Seepage in the Cells
The waste deposit was modeled as a cell excavated in the soil containing a lysimeter filled with waste (Fig.10). The lysimeter was simulated inside the excavation to collect the effluent (AMD). This would simulate the upper portion of a waste pile. The excavation, as well as the dimensions and
-28
-24
-20
-16
-12
-8
-4
0
Dimensions in meters
Initial condition
Pore pressure contours (kPa)
Water level
3 4 5 6 7 8 9 10
0 1 2 3 4
Dimensions in meters
Boundary condition: Rain/evaporation data (2001)
Mesh
Boundary condition: drainage Lysimeter wall
Impermeable Excavation
Ground
Waste
2 3 4 5 6 7 8 9 10
0 1 2 3 4
a
b
Fig. 12 Numerical modeling with seep: a geometry, boundary conditions, mesh andbinitial conditions
position of the lysimeter, were based on results from modeling of the water seepage.
The following aspects should be considered when locating lysimeters in a waste pile (Bews et al.1997): 1. material should be the same inside and outside of the
lysimeter (same dry unit weight and hydraulic conductivity);
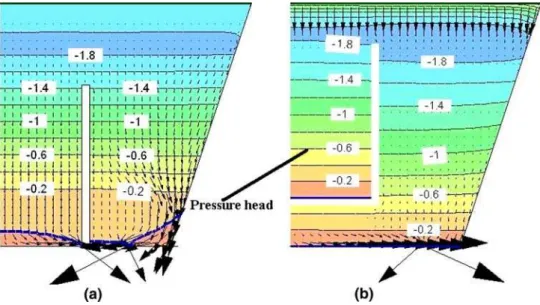
2. lysimeter dimensions (width and height) and depth of its installation should be designed so that they do not interfere with the flow of the water in the waste. A lysimeter installed in waste pile may disturb the water flow. This disturbance can be mitigated if the lysimeters are continuously drained at the bottom (O’Kane and Barbour (2003). O’Kane and Barbour (2003) also showed the influence of a lysimeter on suction profiles inside waste piles. Figure11a shows a scenario where the suction inside the lysimeter is smaller than outside, resulting in water flow outward. In Fig.11b, the suction is the same inside and outside the lysimeter, resulting in no interference to the water flow in the waste.
The excavations were simulated as a 3 m deep pit, 494 m at the bottom and 696 m at the surface. The lysimeter was simulated as a cylindrical vessel 2 m in diameter and 2 m high. Due to the symmetry in the excavations, just half of the outline was used for the modeling. Figure12 shows the dimensions, mesh, boundary and initial conditions used in the numerical simulations.
Figure13shows the suction profiles obtained for cell 1 (only waste). In Fig.13a, the suction is the same inside and outside the lysimeter so that the lysimeter does not interfere with the water flux. On the other hand, in Fig.13b, the suction is smaller inside than outside the lysimeter so that there is flux outward. Therefore, based on the results of the numerical simulations, it was decided that the most appropriate position for the installation of the lysimeter is as shown in Fig.13a.
Dry Covers Designed from Simulations
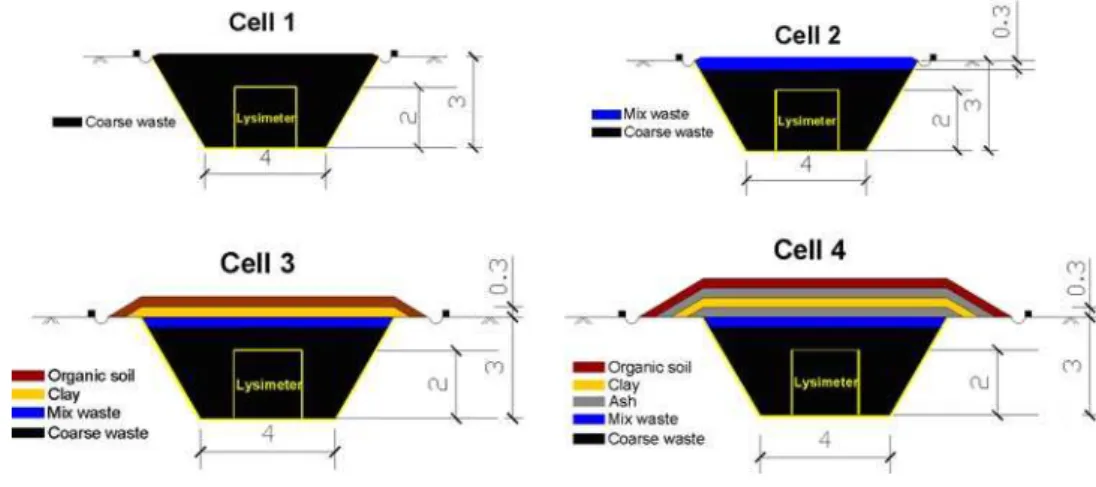
The numerical modeling with SoilCover and SeepW resulted in an experimental design with four experimental cells. Three of them tested different configurations of dry covers. The fourth was not covered to simulate waste exposed to weathering. Figure14 illustrates the four experimental cells tested.
Cell 1: waste without cover layers;
Cell 2: waste, covered with a layer of mix waste (0.3 m thick);
Cell 3: waste covered with a three-layer configuration. Each layer is 0.3 m thick. The first layer is mixed waste, the second layer is compacted clay, and the third is organic soil;
Cell 4: waste covered with a five-layer configuration. Each layer is 0.3 m thick. The first layer is mixed waste, the second is compacted ash (capillary barrier), the third is compacted clay, the fourth is compacted ash (capillary barrier), and the fifth is organic soil.
Conclusions
The paper presents the results of the first phase of a pilot scale test conducted to evaluate the performance of dry covers at a mine site in southern Brazil. Numerical modeling was conducted used the geotechnical data and the climatic data of the region. The results of numerical modeling with SoilCover led to four configurations being tested: a dry cover using a double capillary barrier with bottom ashes, a dry cover with a single layer of clay, a dry cover with mixed waste, and waste with no cover. Cover layers were set as 0.30 m thick. The results of numerical modeling with SeepW showed that the best position for the lysimeter was at the bottom of the excavation, where it would not interfere with the water Fig. 14 Different cover system
flux in the waste. The construction and operation of the tests conducted using the selected dry covers will be reported in a second paper.
Acknowledgments The authors wish to thank the Brazilian Ministry of Science and Technology (FINEP) and the Carbonifera Criciu´ma S/A for their financial support of this research.
References
ABNT (1984a) Solo—Ana´lise Granulome´trica. NBR 7181, Rio de Janeiro, Brazil
ABNT (1984b) Solo—Determinac¸a˜o do Limite de Liquidez. NBR 6459, Rio de Janeiro, Brazil
ABNT (1984c) Solo—Determinac¸a˜o do Limite de Plasticidade. NBR 7180, Rio de Janeiro, Brazil
ABNT (1985) Solo—Determinac¸a˜o do Coeficiente de permeabilidade de solos granulares e de carga constante. NBR 13292, Rio de Janeiro, Brazil
ABNT (Associac¸a˜o Brasileira de Normas Te´cnicas) (1986a) Solo— Ensaio de Adensamento Unidimensional. NBR 12007, Rio de Janeiro, Brazil
ABNT (1986b) Solo—Ensaio de Compactac¸a˜o. NBR 7182, Rio de Janeiro, Brazil
ABNT (1986c) Amostras de solo, Preparac¸a˜o de para Ensaios de Compactac¸a˜o e Ensaios de Caracterizac¸a˜o. NBR 6457, Rio de Janeiro, Brazil
ABNT (2000) Solo – Determinac¸a˜o do Coeficiente de Permeabilidade de Solos Argilosos e de Carga Varia´vel. NBR 13293, Rio de Janeiro, Brazil
Adu-Wusu C, Yanful EK (2006) Performance of engineered test covers on acid-generating waste rock at Whistle mine, Ontario. Canadian Geotech J 43:1–18
Alexandre NZ, Krebs ASJ (1995) Qualidade das A´ guas superficiais do municı´pio de Criciu´ma, SC. Relato´rio Final. PROGESC–Progra-ma de InforPROGESC–Progra-mac¸o˜es Ba´sicas para Gesta˜o-Territorial de Santa Catarina (Se´rie Recursos Hı´dricos, V. 6). CPRM, Porto Alegre Aubertin M, Mbonimpa M, Bussie`re B, Chapuis RP (2003) A model
to predict the water retention curve from basic geotechnical properties. Canadian Geotech J 40:1104–1122
ASTM D5298-03 Standard test method for measurement of soil potential (suction) using filter paper, pp 6
Barbour SL (1990) Reduction of acid generation in mine waste through the use of moisture-retaining cover layers as oxygen barriers. Canadian Geotech J 27:398–401 (discussion)
Bews BE, O’Kane MA, Wilson GW, Willians D (1997) The design of a low flux cover system, including lysimeters, for acid gener-ating waste rock in semi-arid environment. In: Proceedings of 4th international conference on acid rock drainage (ICARD), Vancouver, p 747–762
Borma LS, Mendonc¸a R, Souza VP (2002) Processo de mitigac¸a˜o da formac¸a˜o de drenagens A´ cidas utilizando Coberturas Secas. Projeto Ba´sico da Unidade Piloto e da Instrumentac¸a˜o— Avaliac¸a˜o Preliminar dos Custos de Instalac¸a˜o e Operac¸a˜o de Piloto, RT 2002-038-00; technical report for SIECESC (Syndi-cate of Coal Mining Companies of the State of Santa Catarina), CETEM, Rio de Janeiro, Brazil, pp 126 (in Portuguese) Borma LS, Mendonc¸a RG, Souza VP, Soares PSM (2003) Utilizac¸a˜o
de cinza no contexto da reabilitac¸a˜o de a´reas de minerac¸a˜o de carva˜o. In: Proceedings of 5th Brazilian congress on environ-mental geotechnics, CD ROM, Porto Alegre (in Portuguese) CETEM (2001) Projeto Conceitual para Recuperac¸a˜o Ambiental da
Bacia Carbonı´fera Sul Catarinense, RT/33/2000—technical
report for SIECESC, vol I, II e III. CETEM, Rio de Janeiro (in Portuguese)
Chandler RJ, Gutierrez C (1986) The filter-paper method of suction measurement. Ge´otechnique 6(2):265–268
Chandler RJ, Crilly MS, Montgomery-Smith G (1992) A Low-cost method of assessing clay desiccation for low-rise building. In: Proceedings of the Institute of Civil Engineering, vol 92, no 2, pp 82–89
DNPM (2008) Mineral summary: http://www.dnpm.gov.br/assets/ galeriaDocumento/SumarioMineral2008/carvaomi.neral.pdf. National Department for Mineral Production, Brasil
Fredlund DG, Xing A (1994a) Equations for the soil water characteristic curve. Can Geotech J 31(4):521–532
Fredlund DG, Xing A (1994b) Predicting the permeability function for unsaturated soil using soil–water characteristic curve. Can Geotech J 31(4):533–546
GeoAnalysis (2000) SoilCover Software s. Univ of Saskatchewan, Saskatoon
Geoslope International Ltd (1998) SEEP/W for finite elements seepage analysis. User’s Guide, version 4.2, Canada
Mendonc¸a RG (2007) Estudo da Difusa˜o do Oxigeˆnio em Materiais de Cobertura. D.Sc. Thesis, Program of Civil Engineering. COPPE/UFRJ, Rio de Janeiro, pp 354 (in Portuguese) Mendonc¸a RG, Barbosa MC, Borma LS, Soares PSM (2003a)
Avaliac¸a˜o de sistema de cobertura seca para Regia˜o Sul de Santa Catarina. In: Proceedings of 5th Brazilian congress on environ-mental geotechnics. CD ROM, Porto Alegre (in Portuguese) Mendonc¸a RG, Borma LS, Soares PSM (2003b) Caracterizac¸a˜o do
Potencial de Gerac¸a˜o de Acidez de Resı´duos de Minerac¸a˜o de Carva˜o. In: Proceedings of 5th Brazilian congress on environ-mental geotechnics. CD ROM, Porto Alegre (in Portuguese) Nicholson RV, Gillham RW, Cherry JA, Reardon EJ (1989)
Reduction of acid generation in mine waste through the use of moisture-retaining cover layers as oxygen barriers. Canadian Geotech J 26(2):1–8
O’Kane MA (1996) Instrumentation and monitoring of an engineered soil cover system for acid generating mine waste. M.Sc. Dissertation, Department of Civil Engineering, Univ of Saska-techewan, Saskatoon
O’Kane MA, Barbour SL (2003) Predicting field performance of lysimeters used to evaluate cover systems for mine waste. In: Proceedings of 6th international conference on acid rock drainage, Cairns, p 327–339
O’Kane MA, Ayres B, Christensen D, Meiers G (2002) CANMET-CETEM Manual on cover system design for reactive mine waste. Report 689-01 prepared for CANMET-CETEM
Rose AW, Cravota III CA (1998) Geochemistry of coal mine drainage. In: Brady KBC, Smith MW, Schueck J (eds) Coal mine drainage prediction and prevention in Pennsylvania, PA. Depart-ment of EnvironDepart-mental Protection, Harrisburg, Chap 1, p 1–22 Skousen JG (2000) Static tests for predicting coal mine drainage. In:
Kleinmann RLP (ed) Prediction of water quality at surface coal mines, national mine land reclamation center. West Virginia University, Morgantown, pp 73–98
Soares PSM, Borma LS, Souza VP, Schultze JP (2000) Alternatives for mitigation of acid mine drainage in a coal mine. In: Proceedings of 6th international symposium on environmental issues and waste management in energy and mineral production. Calgary, Alberta, p 589–594
Sobek AA, Schuller WA, Freeman JR, Smith RM (1978) Field and laboratory methods applicable to overburden and mine soils. US Environmental Protection Agency 600/Z-78-054
Souza VP, Soares PSM, Possa MV, Santos MDC, Dalmina LB, Mello MC, Ubaldo MO, Borghetti Soares A, Trindade RBE, Bertolino AVFA, Borma LS, Mendonca RG, Almeida JR, Krebs ASJ, Schneider CL, Schneider CH (2007) Otimizac¸a˜o do processo de gerac¸a˜o de energia ele´trica a partir do carva˜o e recuperac¸a˜o ambiental das a´reas degradadas pela minerac¸a˜o. (internal CTEM research report)
Swanson AD (1995) Predictive modeling of moisture movement in engineered soil covers for acid generating mine waste. M.Sc. Dissertation, Department of Civil Engineering, University of Saskatechewan, Saskatoon
Ubaldo MO (2005) Uso de Cinza de Carva˜o na Composic¸a˜o de uma Cobertura de Rejeitos de Minerac¸a˜o, MSc Diss, Program of Civil Engineering, COPPE/UFRJ, Rio de Janeiro, Brazil, pp 150 (in Portuguese)
Ubaldo MO, Barbosa MC, Borma LS (2006) Technical and environ-mental viability study of the use of coal ash as covering material for mining rejects. In: Proceedings of 5th international congress on environmental geotechnics (5ICEG), Cardiff, Wales, UK, vol 2. AA Balkema, Rotterdam, p 1593–1600
Ubaldo MO, Borma LS, Barbosa, MC (2009) Hydrological perfor-mance of a coal ash layer in a capillary barrier dry cover: laboratory tests and numerical simulations. Can Geotech J (submitted)
Van Genuchten MT (1980) A closed form equation for predicting the hydraulic conductivity of unsaturated soils. Soil Sci Am J 44(5):892–898
Vanapalli SK, Fredlund DG, Pufahl DE, Clifton AW (1996) Model for prediction of shear strength with respect to soil suction. Can Geotech J 33:379–392
Wang HL, Shang JQ, Kovac V, Ho KS (2006) Utilization of Atikokan coal fly ash in acid rock drainage control from Musselwhite mine waste. Can Geotech J 43:229–243
Wilson GW (1990) Soil evaporative fluxes for geotechnical engi-neering problems. Ph.D. Thesis, University of Saskatchewan, Saskatoon
Wilson GW, Barbour SL, Swanson D, O’Kane MA (1995) Instrumen-tation and modeling for saturated/unsaturated performance of soil covers for acid generating waste rock. Hydroge´ologie 4:99–108 Woyshner MR, Yanful EK (1995) Modelling and field measurements
of water percolation through an experimental soil cover on mine waste. Can Geotech J 32:601–609
Yanful EK (1993) Oxygen diffusion through soil cover on sulfidic mill waste. ASCE J Geotech Eng 199(8):1207–1228