Evaluating the wage differential
between public and private sectors in Brazil
DAULINS EMILIO VLADIMIR PONCZEK FERNANDO BOTELHO*
This paper uses a rotating panel of households to analyze wage differentials be-tween public and private sectors in Brazil. Focusing on the transition of individuals between jobs available in the public and private sectors and controlling for indi-vidual time invariant characteristics, we ind evidence of small wage differentials in favor of the public sector.
Keywords: wage differentials; public sector; labor markets. JEL Classiication: J31; J45.
INTRODUCTION
Public and private sector jobs in Brazil differ in several dimensions. Wage dif-ferentials arising from these different dimensions can be explained by the hedonic theory of wages, formalized in Rosen (1974, 1976). In a competitive labor market, average earnings should vary to compensate for different job attributes. One of the main differences between private and public sector jobs in Brazil is the pension scheme of the public sector, where workers expect to receive higher pension ben-efits than their counterparts in the private sector. Another relevant difference is that public workers in Brazil have more stable jobs, that is, they can be dismissed only
Brazilian Journal of Political Economy, vol. 32, nº 1 (126), pp. 72-86, January-March/2012
under very unusual circumstances. It is often claimed that these benefits compensate for lower wages in the public sector, which is in line with the hedonic theory.1
There are some possible explanations for a wage premium in favor of public employees. For instance, Alesina, Baqir and Easterley (2000) argues that politicians may use public employment as a redistributive device. High wages could be the channel through which public employment may affect the income distribution. Another explanation is that the public sector is usually more unionized than the
private one. Freeman (1986, 1988) document and explain the causes of the surge of public sector unionism in the U.S. during the 1970s and 1980s. Robison and Tomes (1984) show that the rents to public sector reflect the increase in the union-ization of this sector in the U.S.
Indeed, many studies in the literature show that wage differentials are in favor of public employees. There are several articles with public-private sector wage com-parisons in the literature. For instance, Smith (1976, 1977) find public sector wage differentials using various public sector and compensation definitions in the U.S. Gunderson, (1979) and Shapiro and Stelcner (1989) also find wage premium in favor of Canadian public employees. Tansel (2005) documents wage differential in favor of male public employees in Turkey. Lassibilee (1998) evaluates the economic surplus that public sector workers receive compared to their private sector counter-parts in Spain. Glinskaya and Lokshin (2007) show that the public sector premium ranges between 62% and 102% over the private-formal sector in India.
There are also some studies measuring the wage differential between private and public sector in Brazil. They usually rely on cross-sectional data. Macedo (1985) compares wages in state-owned companies with wages in similar jobs in private companies. He focuses on ten industries and found that state-owned com-panies did pay higher salaries. The author also estimates a wage gap controlling for other factors, recognizing that differences in workers characteristics could be driv-ing his results. These estimates indicate that public enterprises pay on average higher wages to workers with identical observed characteristics and in the same occupation than their private counterparts. His estimates of the public sector pre-mium vary between 70% and 250% of the average wage in the private sector de-pending on the methodology used. By focusing on very specific occupations for pairs of enterprises in specific industries, he shows that large wage differentials persist even when comparing very similar workers in the same occupation and, in firms of similar size in the same industry.
Tannen (1991) found that returns to education vary within sectors, with high-er returns to education in the public sector for those with elementary school or a
higher education degree, while the return was lower in the public sector for those with high school diplomas.
Fogel et al.(2000)investigate the wage loss public employees leaving the pub-lic sector would suffer if incorporated into the private sector. They use microdata from a 1995 survey of households and calculate the wage gap between the two sectors. They find a positive gap in favor of public employees although this differ-ence gets reduced when they include controls. This last result indicates that indi-vidual characteristics of the labor force in both sectors may be driving the differ-ences. Their study reveals significant heterogeneity in the premium inside the public sector, with the wage premium being higher for federal public employees, than for other levels of government.
Belluzzo et al. (2005) use a quantile regression approach to find that the wage differential varies for different quantiles as well as for the different government levels and regions. Again the gap favors public employees, with decreasing premia as one moves towards the higher part of the distribution of wages.
Wage differentials do not necessarily translate into a genuine wage premium: when workers are heterogeneous, it is possible that some of them will self-select into the sector where they are more productive, as in Roy (1951). Unconditional comparisons of wage means would be misleading, since workers differ in observ-able and unobservobserv-able attributes. For instance, workers in the public sector may be more educated compared to their peers in the private sector. It is possible that part of the wage gap could be explained by differences in education attainment. One way to get around this problem is to add controls in a regression framework. In the literature, these control variables usually include gender, experience, race, and industry.
The presence of unobservable attributes may pose additional problems, since these characteristics may jointly determine sector choice and earnings. For example, a more risk-averse individual prefers the public sector in which the probability of dismissal is lower. Furthermore, it is possible that risk averse workers are more prone to effort, resulting in higher wages.
Studies with Brazilian data on this subject, deal with these potential problems only by adding controls in the regressions. Therefore, they are only able to capture wage differences related to observable characteristics, disregarding the potential bias caused by unobservables. This paper fills this gap in literature by directly con-trolling for worker unobservable characteristics, as long as they are time invariant. This approach is possible only because we exploit the panel data structure of the monthly employment survey (PME) conducted by the Brazilian national statistics agency — IBGE. We use a fixed-effects estimator in order to control for time invari-ant unobservables. Furthermore, we estimate the wage premium for different sub-groups of the population by adding interactions between the sector status and some attributes of interest, such as gender, age, schooling, race and region.
type of employment transition and on the type of compensation (hourly or month-ly wages) the wage differential becomes statisticalmonth-ly insignificant. In any case, the magnitudes we find are much lower than those from most previous studies.
This paper is organized as follows. The second section reviews the rules that govern public sector employment in Brazil. Third section presents the data set. The empirical strategy and identification assumptions are discussed on the fourth sec-tion. The fifth section presents the results. The sixth section concludes.
OVERVIEW OF THE PUBLIC SECTOR IN BRAZIL
In Brazil, as in other countries, rules and conditions for employment in the public sector differ from the private sector. In the Brazilian case, formal public employment can take four different types: statutory, contractual, special, and ap-pointment. Statutory employment, different from the use of the term in the U.S.,2 is governed by a set of special rules which includes, among other things, life-time contracts from which employees cannot be discharged, except for misconduct, and a pension scheme that is far better than the scheme available to formal employees in the private sector. Contractual employees are subject to the same rules as em-ployees in the private sector. This type of employment is governed by the “Con-solidação das Leis do Trabalho” (CLT) which was enacted to consolidate Brazilian labor laws in 1943. These employees, however, do not enjoy the same level of stabil-ity or the generous pension scheme of statutory employees. Both, statutory employ-ees as well as contractual public employemploy-ees are hired through a open competitive examination, for which a determined level of formal education is required.
The special employment category refers to those workers hired under excep-tional circumstances, in cases such as urgent need or, need for extraordinary skills. These employees have a pre-determined, in general short, term of employment specified in their contracts and are entitled to the same benefits as those under contractual employment (CLT). The fourth form of employment in the public sec-tor refers to those employees appointed by government officials. This form of employment also has the same degree of protection and benefits dictated by CLT. In general all forms of formal employment in the public sector are protected and all have at least the same level of benefits as those in the private sector. The most important difference relates to statutory employment. In fact, this type of employ-ment with higher benefits, has been, since its institution in the constitution of 1988, the dream job of public employees and it is at the center of discussion in the public service policy debate.
We measure the wage differential coming from three forms of transition. First,
we analyze the transition of individuals between statutory employees in the public sector and other formal employees (public and private contractual employees). Second, we look at the wage differential between contractual employees in the public and private sectors excluding statutory employees. Finally, we esrtimate the wage differential between private ans public employees regardless the contract type.
DATA
The “Pesquisa Mensal de Emprego” (PME), or Monthly Employment Survey, is a monthly rotating panel of dwellers in six major metropolitan areas in Brazil (São Paulo, Rio de Janeiro, Belo Horizonte, Salvador, Porto Alegre and Recife). These metropolitan areas represent approximately 30% of the Brazilian popula-tion.3 We used data from March 2002 to December 2004.4
The survey collects data on schooling, labor force participation, employment, demographics, and earnings of each member of the household, age ten and above, for every interviewed household. Approximately 100,000 individuals in 35,000 households are interviewed every month. Households are interviewed once a month for four consecutive months, then there is an eight-month window when they are out of the sample; after this period, the household is interviewed for another four-month period. For instance, suppose that the first interview was conducted in January. The second, third, and fourth interviews will take place in February, March and April of the same year, respectively. From May to December the household will rotate out of the sample. From January to April of the following year the household is interviewed again and, after this spell, the household is permanently excluded from the sample.
The survey is released in a way that does not identify each single individual. Only households are individually identifiable and, therefore, we track each house-hold over time and match individuals inside each househouse-hold according to their characteristics (e.g., month and year of birth, gender along with the survey’s house-hold identification codes).
We then conduct a series of checks to minimize the possibility of having indi-viduals wrongly matched over time, for instance, we check that age and schooling does not show unreasonable differences across interviews (e.g., age difference be-tween interviews twelve months apart cannot exceed one year).
The survey releases the monthly wage received from the primary job which we
3 This data set is compiled by the Brazilian national statistical agency — “Instituto Nacional de
Geografia e Estatstica” (IBGE).
use alongside with the information on the number of hours worked in the previous week while calculating hourly wages.5
To deal with seasonality issues we use only observations exactly twelve months apart. We choose these two observations for each individual, in order to maximize the number of transitions between one kind of employment and another (e.g., from statutory to contractual) in our sample. In the sample we have formal employees of public and private sectors, 24 years old and older, with positive hours worked and wages earned in the week immediately before the interview.
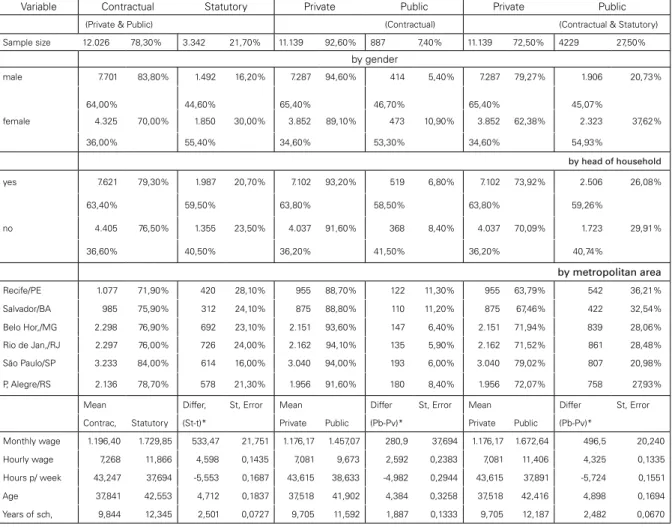
Table 1 presents the descriptive statistics of our sample which are based on the first interview of each individual, except for the information for monthly and hour-ly wages which are the average between first and second interviews.
Throughout this paper we use three samples, focusing on the different employ-ment transitions. One sample addresses the transition between statutory and con-tractual (public and private) — referred as SC transition henceforth. The second sample addresses the transition between contractual private and contractual public employees — PPc henceforth — which excludes statutory employees.6 The third sample addresses the transition between private and public employees regardless the contract type — PPtotal henceforth.
The left side of Table 1 shows the statistics for the SC transition sample, and reveals that around 78% of workers are under contractual employment. The met-ropolitan region of São Paulo/SP is the one with the highest proportion of contrac-tual employees (84%) followed by Porto Alegre/RS (79%), which is not surprising given that both regions have the strongest presence of formal private sector jobs. Recife/PE, in the Northeast, is the metropolitan area with the lowest degree of contractual employees.
In the middle of Table 1, it is shown the descriptive statistics for the sample used to study the wage differential between private and contractual public employees (PPc). Around 93% of workers are in the private sector. The metro-politan areas display similar proportions of private sector employees, only Salvador/ BA and Recife/PE have less than 90% of employees in the private sector.
The last two collumns of Table 1 depicts the descriptive statistics of the PPto-tal sample; 72% of the employees are private. Once more, the two metropolitan areas in the Northeast of the country (Recife and Salvador) have the strongest presence of public employess.
On average, hourly earnings of contractual employees are only 61% of earn-ings of statutory employees. When we compare monthly wages, contractual
work-5 We use the derived variable for monthly wages (vd23) and the number of hours worked in the previous week (v428) to calculate hourly wages, considering four weeks in a month.
ers earn 69% of what statutory workers earn, which reflects the fact that statutory employees work fewer hours. On average statutory employees do work fewer hours, are older, and have more years of education than contractual employees. Looking at the PPc transition sample, on average, hourly earnings of private sector workers represent 73% of earnings of workers in the public sector. Again when we compare monthly wages, private sector employees earn 79% of what public sector employ-ees earn, and on average public employemploy-ees work fewer hours, are older and have more education than private employees. As for the PPtotal transitions, private emplyees earn 38% less than the public ones, work more hours, are younger and less schooled.
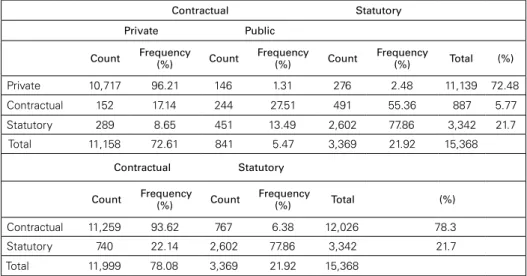
Our use of a panel data set and a fixed-effects estimator relies on the transition of some individuals from one employment status to another. Table 2 shows the pattern of transitions in our sample: of the 887 contractual workers in the public sector during the first interview, 55% move into statutory status, while of the 11,139 workers initially in the private sector, only 2.5% move to statutory employ-ment with an even smaller fraction (1.3%) moving from the private sector into public sector as contractual employees. Also, most transitions into statutory status come from workers already in the public sector, under contractual employment (491 transitions into statutory from contractual public, and only 276 from the private sector). In total, we have 1,507 (9.8%) workers changing status within one year between contractual (both private and public) and statutory or vice-versa.
Given that a statutory job seems preferable to a contractual job, it is striking that there are so many transitions from statutory to contractual (740). One pos-sible explanation for the high number of transitions from statutory to contractual employment, is that switchers may be young and take private sector jobs because the dynamics of the private sector offers them better career growth opportunities. Another possible explanation, very different from the former, is that switchers may
be close to the age of retirement (sometimes compulsory) and take less attractive contractual jobs, the earnings from which will only complement their retirement earnings from the public sector pension fund. However, when we look at the char-acteristics of switching workers, we see that switching workers and statutory non-switchers (Always Statutory) are older but not close to regular retiring age, there is also a higher proportion of females among switchers.7 Statutory non-switchers have a higher wage (hourly or monthly) than any other group and work fewer hours. Most striking is that statutory employees that switch into contractual em-ployment have much lower wages than statutory non-switchers.8
Since we cannot find a good explanation for the high number of transitions
7 Another possible explanation for the switching age to be around forty, is that switchers have reached a flat portion of the wage-age curve of their employment sector, but estimating the wage-age curve for the different sectors and comparing them have shown that not to be the case.
from statutory to contractual employment and taking into account the possibility of misreporting in the survey, we also look at the transition between contractual public and contractual private employment and also transitions between private and public jobs regardless the contract type.
EMPIRICAL STRATEGY AND IDENTIFICATION
We rely on the transition of individuals from one type of employment to an-other to identify the wage differential. Unlike previous studies, by using a panel approach we are able to control for individual fixed effects.
We estimate a benchmark equation:
log
(
wi t,)
=α0+θbi t, +β'Xi t, +ei t, (1)where bi,t is a dummy variable, for the type of employment of individual i in period t (bi,t=1 for statutory employment; bi,t=0 for contractual employment).9 Vector Xi,t is a dummy variable indicating the year (to eliminate any aggregate trend
in the wage rate).
The fixed effect framework does not allow us to include variables that are constant over time, such as gender and race. Also, since the universe of analysis includes only individuals over 24 years old (above school age), education does not change over time for most of the individuals and in fact, we exclude those indi-viduals with changes in education levels.
We are also interested in how the wage differential changes within the wage scale and for the different education levels of individuals. In order to assess this, we run regressions including interactions between employment status and the relevant scale:
log
(
wi t,)
=α0+bi t,(
θ+φ,Vi)
+β'Xi t, +ei t, (2)where Viis a vector of time-invariant characteristics, while the vector of coefficients
f
measures how the wage differential varies with the characteristics described by Vi . In both regressions we assume that the error term can be broken down into twocomponents
e
i t, =µi+εi t, (3)
where
m
iis an individual effect, constant over time, ande
i,t is the random error term. The hypothesis being that the random error,e
i,t , is not correlated with bi,t, Xi,t,or Vi,t: any unobservable characteristic that is not constant over time and is corre-lated with the dependent variable is not relevant for employment status choice.
Even if there are unobservable characteristics which jointly determine employ-ment status and earnings,
q
^ will be a consistent estimator so long as those charac-teristics are constant over time. The ability to control for unobservable character-istics is one of the advantages of our strategy in comparison to other approaches that rely on two-step estimation procedures, which require the correct specification of the joint distribution of the errors in the wage equation and in the status choice equation.10RESULTS
In our benchmark regressions we use a fixed effects estimator which we favor over a random effects model. The random effects model does not provide a consis-tent estimate when the regressors are correlated with the individual effects. In Table 3 we present the results of a Hausman test, which rejects the random effects mod-el, concluding that individual effects are indeed correlated with the regressors.11
Our estimates for the SC transition indicate a monthly wage differential in favor of statutory employees of only 2.8%, as shown in Table 4. When we calculate the differential using hourly wages, we find a wage differential of 4.6%. We favor the monthly wages estimates because they, more closely, reflect the income of work-ers and this might be the relevant factor in the decision to switch from one form of employment to another. Our benchmark regressions for the PPc transition result in a wage differential in favor of contractual public workers of 3.9% when regressing hourly wages, however this result is significant only at the 10% level. When we use monthly wages we do not find a statistically significant wage differential (with magnitude of only 2.8%). As for the PPtotal transition, we find significant results for the hourly wage only, indicating a wage differential of 3.7% in favor of public employees.
We conduct a robustness check that refers to the direction of transition. We create two dummies of interest in order to capture the direction of transition. We estimate regressions with one dummy variable for the transition from contractual into statutory (private into contractual public, in the case of the PPc sample) and another dummy variable for the transition from statutory into contractual (con-tractual public into private). Results (availble upon request) show that moving from
contractual to statutory employment is associated with an increase in monthly wages of 2.4% (3.8% for hourly wages), while the monthly wage loss when mov-ing from a statutory job to a contractual one is of 3.3% (5.5% for hourly wages). We cannot reject, however, the hypothesis that both coefficients are statistically the
same: the loss in one direction is the same as the gain in the opposite direction, which implies that statutory employment does pay a slightly higher salary, indepen-dent of the direction of transition.
This is a relevant robustness check since, as we stressed before, we are only controlling for time invariant characteristics. It is possible that time variant char-acteristics may explain earnings and the decision to switch from one form of em-ployment to another. However because the wage differential is the same regardless of the direction of transition this seems to be a less important source of bias.
The results of this same robustness check for the PPc and PPtotal transition samples are similar. The coefficients, are not statistically significant and we cannot reject the hypothesis that coefficients for both directions are statistically equal to zero.
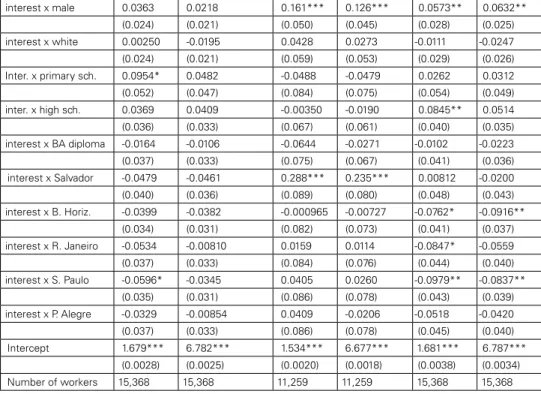
To complete the analysis we break down the wage differential for different groups, by estimating regressions including interaction terms as described in equa-tion (2). The results of these regressions are presented in Table 4. Looking at the results obtained using the SC transition sample and hourly wages, we find weak evidence that less educated public servants get a higher premium than other statu-tory employees. In particular, employees with a degree representing eight years of education earn 10% more than employees without any degree (the base group) which is higher than the difference for individuals with more education. In fact, we cannot reject the hypothesis that more educated employees get the same premium as the base group, moreover, if the wage differential is estimated for monthly wag-es, then we find that no group gets a higher premium.
When we look at the results for the PPc transition sample, for monthly or hourly wages, we see that males get a much higher premium than females. The lower part of Table 4 presents the difference in premia by metropolitan area. The reference group is the metropolitan area of Recife/PE, which displays the highest premium looking at the SC transition, although we cannot reject the hypothesis that all areas have the same premia. Regarding the PPc transition sample, Salvador/ BA is the only region in which we find a statistically significant difference from the base group.
As for the PPtotal sample, we find similar results as the PPc sample. There are two main differences. First, the wage differential is higher for employees with high school and lower differential for those in São Paulo metropolitan area. The later result could reflect the higher tightness of the private labor market in São Paulo.
quartiles, while we cannot reject the hypothesis that the wage differential is the same for this two quartiles of wages.12 For the PPc transition sample, regressing hourly wages, the only statistically significant wage differential is for the 3rd wage
quartile, while we do not find any wage differential for monthly wages.
CONCLUSION
In this paper, we have looked at wage differentials between public and private employees in Brazil. We analyze the wage differential between statutory and con-tractual employment, and we also analyze the wage differential between contrac-tual workers in the public and private sectors.
Our findings show no compelling evidence of a large wage differential between public and private employees. Whenever we find a statistically significant wage differential it is less than 5%. Moreover, it either gets reduced or becomes statisti-cally insignificant if we use a different wage measure. When we use monthly instead of hourly wages the estimated premia are less than 3% and, in fact, the hypothesis that this differential is zero cannot be rejected in the case of the wage differential between contractual employees.
We used a panel of individuals which allows us to control for unobservable individual characteristics that are constant over time. Although the strategy of fixed effects we used fills a gap in the literature and complements previous research on Brazilian wages, our results rely on the assumption that the employment status decision is not correlated with wages through the time variant part of the error term. We do not control for the possibility that time variant individual unobserv-able characteristics jointly determined earnings and employment status, however the fact that our estimates are invariant to the direction of the transition, indicates this is not an important problem.
REFERENCES
ALESINA, Alberto and BAQIR, Reza and EASTERLY, William. Redistributive Public Employment.
Journal of Urban Economics, 48(2): 219-241, 2000.
BELLUZZO, Walter and ANUATTI-Neto Francisco and PAZELLO Elaine T. Distribuição de Salários e o Diferencial Público-Privado no Brasil. Revista Brasileira de Economia, 59(4), 2005. CORSEIUL, C. H and FOGUEL, M. N. Uma sugestão de delatores para rendas obtidas a partir de
algumas pesquisas domiciliares do IBGE. Technical report, IPEA - Discussion Paper 897, 2002. FOGUEL, Miguel N. and GILL, Indermit and MENDONçA, Rosane and PAES DE BARROS, Ricardo.
The Public-Private Wage Gap in Brazil. Revista Brasileira de Economia, 54(4), 2000.
FREEMAN, Richard B. Contraction and Expansion: The Divergence of Private Sector and Public Sec-tor Unionism in the United States. The Journal of Economic Perspectives, 2(2): 63-88, 1988. GLINSKAYA, Elena and LOKSHIN Michael. Wage differentials between the public and private
sec-tors in India. Journal of International Development, 19(3): 333-355, 2007.
GUNDERSON, Morley. Earnings Differentials between the Public and Private Sectors. Canadian Journal of Economics, 12(2): 228-242, 1979.
GYOURKO, Joseph and TRACY, Joseph. An Analysis of Public- and Private-Sector Wages Allowing for Endogenous Choices of Both Government and Union Status. Journal of Labor Economics, 6(2): 229-253, 1988.
LASSIBILLE, Gerard. Wage Gaps Between the Public and Private Sectors in Spain. Economics of Edu-cation Review, 17(1):83-92, 1998.
MACEDO, Roberto. Diferenciais de salários entre empresas privadas e estatais no Brasil. Revista Brasileira de Economia, 39(4), 1985.
POCHMAN, M. Hierarquia e Desigualdade Salaria na Administração Pública Brasileira. IPEA- Discus-sion Paper (Press Release), 2007.
ROBINSON, Chris and Tomes, Nigel. Union Wage Differentials in the Public and Private Sectors: A Simultaneous Equations Speciication. Journal of Labor Economics, 2(1): 106-127, 1984. ROSEN, Sherwin. Hedonic Prices and Implicit Markets: Product Differentiation in Pure Competition.
Journal of Political Economy, 82(1): 34-55, 1974.
ROSEN, Sherwin. The theory of equalizing differences. In O. Ashenfelter and R. Layard, editors,
Handbook of Labor Economics. Elsevier Science, 1986.
ROY, A. D. Some Thoughts on the Distribution of Earnings. Oxf. Econ. Pap., 3(2): 135-146, 1951. SHAPIRO, Daniel M. and Stelcner Morton. Canadian Public-Private Sector Earnings Differentials,
1970-1980. Industrial Relations, 28(1): 72-81, 1989.
SMITH, Sharon P. Government wage differentials. Journal of Urban Economics, 4(3):248-271, 1977. ______. Pay differential between federal government and private sector workers. Industrial and Labor
Relations Review, 29(2): 179-197, 1976.
TANNEN, Michael B. New estimates of the returns to schooling in Brazil. Economics of Education Review, 10(2):123-135, 1991.
Br
azilian J
ournal of P
olitical Econom
y
32 (1),
2012
84
APPENDIX: T
ABLES
Table 1: Descriptive Statistics
Variable Contractual Statutory Private Public Private Public
(Private & Public) (Contractual) (Contractual & Statutory)
Sample size 12.026 78,30% 3.342 21,70% 11.139 92,60% 887 7,40% 11.139 72,50% 4229 27,50%
by gender
male 7.701 83,80% 1.492 16,20% 7.287 94,60% 414 5,40% 7.287 79,27% 1.906 20,73%
64,00% 44,60% 65,40% 46,70% 65,40% 45,07%
female 4.325 70,00% 1.850 30,00% 3.852 89,10% 473 10,90% 3.852 62,38% 2.323 37,62%
36,00% 55,40% 34,60% 53,30% 34,60% 54,93%
by head of household
yes 7.621 79,30% 1.987 20,70% 7.102 93,20% 519 6,80% 7.102 73,92% 2.506 26,08%
63,40% 59,50% 63,80% 58,50% 63,80% 59,26%
no 4.405 76,50% 1.355 23,50% 4.037 91,60% 368 8,40% 4.037 70,09% 1.723 29,91%
36,60% 40,50% 36,20% 41,50% 36,20% 40,74%
by metropolitan area
Recife/PE 1.077 71,90% 420 28,10% 955 88,70% 122 11,30% 955 63,79% 542 36,21%
Salvador/BA 985 75,90% 312 24,10% 875 88,80% 110 11,20% 875 67,46% 422 32,54%
Belo Hor,/MG 2.298 76,90% 692 23,10% 2.151 93,60% 147 6,40% 2.151 71,94% 839 28,06%
Rio de Jan,/RJ 2.297 76,00% 726 24,00% 2.162 94,10% 135 5,90% 2.162 71,52% 861 28,48%
São Paulo/SP 3.233 84,00% 614 16,00% 3.040 94,00% 193 6,00% 3.040 79,02% 807 20,98%
P, Alegre/RS 2.136 78,70% 578 21,30% 1.956 91,60% 180 8,40% 1.956 72,07% 758 27,93%
Mean Differ, St, Error Mean Differ St, Error Mean Differ St, Error
Contrac, Statutory (St-t)* Private Public (Pb-Pv)* Private Public (Pb-Pv)*
Monthly wage 1.196,40 1.729,85 533,47 21,751 1.176,17 1.457,07 280,9 37,694 1.176,17 1.672,64 496,5 20,240
Hourly wage 7,268 11,866 4,598 0,1435 7,081 9,673 2,592 0,2383 7,081 11,406 4,325 0,1335
Hours p/ week 43,247 37,694 -5,553 0,1687 43,615 38,633 -4,982 0,2944 43,615 37,891 -5,724 0,1551
Age 37,841 42,553 4,712 0,1837 37,518 41,902 4,384 0,3258 37,518 42,416 4,898 0,1694
Years of sch, 9,844 12,345 2,501 0,0727 9,705 11,592 1,887 0,1333 9,705 12,187 2,482 0,0670
Table 2: Transition across employment status
Contractual Statutory
Private Public
Count Frequency
(%) Count
Frequency
(%) Count
Frequency
(%) Total (%)
Private 10,717 96.21 146 1.31 276 2.48 11,139 72.48
Contractual 152 17.14 244 27.51 491 55.36 887 5.77
Statutory 289 8.65 451 13.49 2,602 77.86 3,342 21.7
Total 11,158 72.61 841 5.47 3,369 21.92 15,368
Contractual Statutory
Count Frequency
(%) Count
Frequency
(%) Total (%)
Contractual 11,259 93.62 767 6.38 12,026 78.3
Statutory 740 22.14 2,602 77.86 3,342 21.7
Total 11,999 78.08 3,369 21.92 15,368
Table 3: Fixed and Random Effects — Hausman Test
ixed-effects random-effects Difference S.E.
statutory monthly wage 0.0282*** 0.1361 *** -0.108*** 0.0042
hourly wage 0.0464*** 0.2115 *** -0.165*** 0.0050
public (c) monthly wage 0.0280 0.0617 *** -0.033*** 0.0079
hourly wage 0.0387* 0.0968 *** -0.058*** 0.0094
private-public monthly wage 0.0112 0.1530** -0.142*** 0.0060
hourly wage 0.0366*** 0.2490** -0.212*** 0.0071
* signiicant at 10%; ** signiicant at 5%; *** signiicant at 1%
Note: log of real wages is the dependent variable. Regressions include year indicators.
Table 4: Wage differential by groups
Contractual – Statutory 13-5 Private – Public 1-3 Private – Public 1-35
Hourly Wage
Monthly Wage
Hourly Wage
Monthly Wage
Hourly Wage
Monthly Wage
Variable Coeficient Coeficient Coeficient Coeficient Coeficient Coeficient
(Std. Error) (Std. Error) (Std. Error) (Std. Error) (Std. Error) (Std. Error)
-1 -2 -3 -4 -5 -6
interest + 0.101** 0.0678 -0.0933 -0.0533 0.0429 0.0254 (0.050) (0.045) (0.095) (0.086) (0.055) (0.049) interest x age (35-49) -0.0419 -0.0152 0.00876 0.00484 0.0146 0.0382 (0.027) (0.024) (0.051) (0.046) (0.029) (0.026) interest x age (>50) -0.0491 -0.0224 0.00897 -0.0241 0.0444 0.0886** (0.033) (0.030) (0.071) (0.064) (0.039) (0.035) interest x head -0.0226 -0.0272 -0.0294 -0.0223 -0.0366 -0.0489* (0.025) (0.022) (0.052) (0.047) (0.030) (0.027)
interest x male 0.0363 0.0218 0.161*** 0.126*** 0.0573** 0.0632** (0.024) (0.021) (0.050) (0.045) (0.028) (0.025) interest x white 0.00250 -0.0195 0.0428 0.0273 -0.0111 -0.0247 (0.024) (0.021) (0.059) (0.053) (0.029) (0.026) Inter. x primary sch. 0.0954* 0.0482 -0.0488 -0.0479 0.0262 0.0312 (0.052) (0.047) (0.084) (0.075) (0.054) (0.049) inter. x high sch. 0.0369 0.0409 -0.00350 -0.0190 0.0845** 0.0514 (0.036) (0.033) (0.067) (0.061) (0.040) (0.035) interest x BA diploma -0.0164 -0.0106 -0.0644 -0.0271 -0.0102 -0.0223 (0.037) (0.033) (0.075) (0.067) (0.041) (0.036) interest x Salvador -0.0479 -0.0461 0.288*** 0.235*** 0.00812 -0.0200 (0.040) (0.036) (0.089) (0.080) (0.048) (0.043) interest x B. Horiz. -0.0399 -0.0382 -0.000965 -0.00727 -0.0762* -0.0916** (0.034) (0.031) (0.082) (0.073) (0.041) (0.037) interest x R. Janeiro -0.0534 -0.00810 0.0159 0.0114 -0.0847* -0.0559 (0.037) (0.033) (0.084) (0.076) (0.044) (0.040) interest x S. Paulo -0.0596* -0.0345 0.0405 0.0260 -0.0979** -0.0837** (0.035) (0.031) (0.086) (0.078) (0.043) (0.039) interest x P. Alegre -0.0329 -0.00854 0.0409 -0.0206 -0.0518 -0.0420 (0.037) (0.033) (0.086) (0.078) (0.045) (0.040) Intercept 1.679*** 6.782*** 1.534*** 6.677*** 1.681*** 6.787*** (0.0028) (0.0025) (0.0020) (0.0018) (0.0038) (0.0034) Number of workers 15,368 15,368 11,259 11,259 15,368 15,368 Standard errors in parentheses
* signiicant at 10%; ** signiicant at 5%; *** signiicant at 1% + interest is either Statutory status or Contractual public
Table 5: Wage differential by wage quartiles
Contractual – Statutory 13-5 Private – Public 1-3 Private – Public 1-35
Hourly Wage Monthly
Wage Hourly Wage
Monthly Wage
Hourly Wage
Monthly Wage
Variable Coeficient Coeficient Coeficient Coeficient
Coefi-cient Coeficient
(Std Error) (Std Error) (Std Error) (Std Error) (Std Error) (Std Error)
Interest x 1st quartile of wage
0.0152 0.0213 0.0103 0.0209 0.0109 -0.0008
(0.030) (0.023) (0.044) (0.037) (0.028) (0.024)
Interest x 2nd quartile of wage
0.0554** 0.0400** 0.0412 0.0346 0.0492* 0.0396*
(0.023) (0.020) (0.048) (0.045) (0.026) (0.023)
Interest x 3rd quartile of wage
0.0881*** 0.0655*** 0.138*** 0.0490 0.0896*** 0.0481**
(0.018) (0.017) (0.049) (0.043) (0.023) (0.021)
Interest x 4th quar-tile of wage
0.0214 (0.016) -0.000712 -0.00363 0.0143 0.0061 -0.0223
(0.015) (0.038) (0.036) (0.020) (0.018)
Number of workers 15,368 15,368 11,259 11,259 15,368 15,368