Isabel Cristina Celerino de Moraes Porto(a)
Luis Eduardo Silva Soares(b) Airton Abrahão Martin(b) Vanessa Cavalli(c)
Priscila Christiane Suzy Liporoni(c)
(a) Cesmac University Center, Maceió, AL, Brazil.
(b) Institute of Research and Development (IP&D), University of Vale do Paraíba, São José dos Campos, SP, Brazil.
(c) University of Taubaté, Taubaté, SP, Brazil.
Corresponding author: Priscila Christiane Suzy Liporoni
Department of Operative Dentistry, University of Taubaté
R. Expedicionário Ernesto Pereira, 110, Centro
Taubaté - SP - Brazil CEP: 12020-330 E-mail: prili@yahoo.com
Received for publication on Mar 17, 2010 Accepted for publication on Aug 03, 2010
Influence of the photoinitiator system and
light photoactivation units on the degree
of conversion of dental composites
Abstract: The aim of this study was to observe the inluence of two light polymerization units (LED or halogen light) on the degree of conversion (DC) of three dental composites with lighter shades and a different pho-toinitiator system. The top (T) and bottom (B) surfaces of 60 discs of composite resin (Filtek Supreme, Filtek Z250, Tetric Ceram Bleach)
cured either by LED or by halogen lamp (HL) were studied using an FT-Raman spectrometer. The degree of conversion (DC) was evaluated by following the changes in the intensity of the methacrylate C=C stretching mode at 1640 cm-1. The calculated DC ranged from 54.2% (B) to 73.4%
(T) and from 60.2% (B) to 76.6% (T) for the LED and HL, respectively. LED and halogen devices were able to produce an adequate DC for all the resins tested.
Descriptors: Composite Resins; Dental Equipment; Curing Lights, Dental.
Introduction
The crucial point to contemplate during restorative dentistry proce-dures with composite resins is to obtain satisfactory restorations with an adequate photopolymerization technique. This procedure requires suficient light energy intensity and an adequate wavelength in order to activate the photoinitiator within these materials, which will react with the reducer agent to form free radicals and initiate the polymerization process.
Camphorquinone (CQ) is the most common photoinitiator used in composites, and it presents maximum energy absorption at 468 nm with-in the electromagnetic spectrum close to the emission spectrum of the light-emitting diode (LED - λ: 450-490 nm) light-curing unit (LCU).1
Initiators, such as phenylpropanedione (PPD; 1-phenyl-1,2-propanedi-one), which has an absorption spectrum within the ultraviolet spectrum (maximum wavelength ≈ 410 nm),1,2 or Lucirin TPO
(2,4,6-trimethyl-benzoyldiphenylphosphine oxide), which has an absorption spectrum characteristic of a shorter wavelength (ranging from 375 to 410 nm),1
have become necessary to solve inconveniences related to aesthetics con-cerning composite resins for bleached teeth.2,3
photoinitia-tor. When a bleached tooth needs to be restored, the reduction of discoloration related to the photoini-tiator is clinically signiicant in order to obtain and maintain color in aesthetic restorations.3 Moreover,
an excellent polymerization condition cannot be ob-tained when using the LED LCU to photoactivate materials containing photoinitiators that absorb en-ergy from another wavelength.4,5 On the other hand,
the broad spectrum of the halogen LCU, extend-ing up to the ultraviolet region (UV-A), can be an advantage to excite coinitiators that absorb shorter wavelengths.2
The degree of conversion (DC) of methacrylate-based composite resin is inluenced not only by light intensity and wavelength, as emitted by the LCU used to excite the photoinitiator molecules,6
but also by the irradiation time and material com-position.7,8 Moreover, some factors that interfere in
light transmission, such as sample thickness, color, translucence, inorganic illers of composites and the distance between the LCU light tip and the material surface, can also alter this property.9,10 Among the
methods to determine the DC of composites, Fouri-er transform Raman spectroscopy (FT-Raman) has been widely used as a reliable method as it detects the C=C stretching vibrations directly before and after the curing of materials.11-13
The purpose of this study was to examine the inluence of two light polymerization units on the DC of dental composites with lighter shades and a different photoinitiator system. It was hypothesized that the LED and halogen LCU have similar curing performances.
Materials and Methods
Halogen lamp (HL) and LED LCUs (Demetron/ Kerr, Danbury, CT, USA, Table 1) were used to pre-pare 60 samples of composite. The wavelengths of LCUs were measured by using a spectroradiometer (Model 77702 - Oriel Instruments, Danbury, CT, USA), and the power densities (light intensity) were also measured, using a speciic radiometer for each unit (Optilux Radiometer or L.E.D. Radiometer - Demetron/Kerr, Danbury, CT, USA).
Table 2 - Technical specifications of the composite materials tested in the study.
Resin Manufacturer Shade Organic matrix Photoinitiator Inorganic matrix
Filtek Supreme
(FS)
3M/ESPE Dental Products, St Paul,
MN, USA
WB
Bis-GMA Bis-EMA6 UDMA TEGDMA
Camphorquinone (468 nm)
Silica (20 nm) Zirconia and silica (0.6 - 1.4 µm)
59.5% in volume.
Filtek Z250 (FZ)
3M/ESPE Dental Products, St Paul,
MN, USA
B 0.5
Bis-GMA Bis-EMA6 UDMA
TEGDMA
Camphorquinone (468 nm) Zirconia and silica (0.01 - 3.5 µm) 60.0% in volume.
Tetric Ceram Bleach
(TCB)
Ivoclar/Vivadent AG, Schaan, Liechtenstein
L
Bis-GMA UDMA TEGDMA
Lucirin TPO3 (375-410 nm) + camphorquinone (468 nm)
Barium glass, ytterbium trifluoride, Ba-Al-fluorosilicate glass, silica highly
dispersed, mixed oxide and prepolymers (0.04 - 1 µm)
60.0% in volume
Equipment L. E. Demetron 1 Opitlux 401
Manufacturer Demetron/Kerr, Danbury, CT, USA Demetron/Kerr, Danbury, CT, USA
Light source LED Halogen
Power density (mW/cm²) 900 700
Energy density (J/cm²) 36 28
Wavelength (nm) 430-490 390-530
Curing time 40 s 40 s
Technique Conventional continuous Conventional continuous
Three commercially available composites (Table 2), chosen in accordance with their different com-binations of photoinitiators, were tested: Filtek Supreme (FS) (3M/ESPE Dental Products, St Paul, MN, USA), Filtek Z250 (FZ) (3M/ESPE Dental Products, St Paul, MN, USA) and Tetric Ceram Bleach (TCB) (Ivoclar/Vivadent AG, Shaan, Liech-tenstein). Sixty samples were produced using a fab-ricated stainless steel mold in a ring form, with a 7 mm internal diameter and a height of 2 mm, cured at the top surface for 40 s by each light-curing unit, according to the groups: LED curing (GI: FS; GII: FZ; GIII: TCB) and halogen curing (GIV: FS; GV: FZ; GVI: TCB). A lateral mark with graphite indi-cated the irradiated surface.
Raman spectra were recorded after 24 h of stor-age in distilled water at 37°C. The top (T) and bot-tom (B) surfaces were analyzed by FT-Raman spec-troscopy in order to evaluate the DC. Spectra of the cured and uncured resins were recorded by an FT-Raman Spectrometer (RFS 100/S, Bruker Inc., Karlsruhe, Germany). To excite the spectra, the de-focused λ1064.1 nm line of an Nd:YAG laser source was used, and the spectrum resolution was set to 4 cm-1.11,12
The spectra of FS and FZ resin specimens were obtained with the maximum laser power output of 200 mW and 100 scans. The spectra of TCB resin specimens were obtained with the maximum laser power output of 25 mW and 1000 scans.
The FT-Raman spectra were analyzed by se-lecting a spectrum region from 1590 to 1660 cm-1.
The Raman vibrational stretching modes in 1610 and 1640 cm-1 were itted with Lorentzian shapes
to obtain the height of the peaks using the Micro-cal Origin software (Microcal Software Inc., Northampton, MA, USA). The DC was calculated from the ratio between the peaks of the aliphatic C=C bond (1640 cm-1) to the aromatic C=C bond
(1610 cm-1) obtained from the cured and uncured
specimens by the following equation:
The Kruskal-Wallis test, used under the condi-tion of nonhomogeneity of variances (Bartlett’s p < 0.05), and Dunn’s Multiple Comparisons Test were used to test the effects of the interaction be-tween LCUs and composites on the DC. A paired-samples t-test was applied to both the top and bot-tom surfaces of the same sample. All statistical analyses were performed at a 95% signiicance level using the SAS System 9.1 software (SAS Institute Inc, Cary, NC, USA).
Results
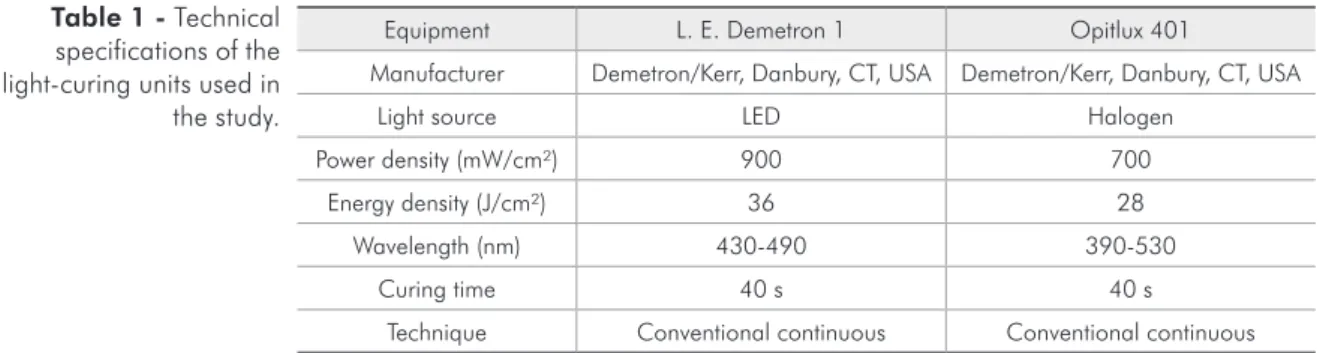
The Raman spectra of the cured and uncured samples of each tested resin, in the spectral region of 1550 cm-1 to 1650 cm-1, are presented in Figures
1-3. The peak of stretching mode in 1640 cm-1,
which represents the vibrational mode of the double C=C bonds of the dimethacrylate aliphatic group,
DC (%) = 100 × [1 – (Rcured / Runcured)]
where R = peak height at 1640 cm-1 / peak height
at 1610 cm-1.11,12
In
te
n
si
ty
(
a
.u
.)
Raman Shift (cm-1)
1660 1650 1620 1610 1610
1640 1640
1600
1630 1590
Figure 1 - Overlay graph presenting the Raman spectra of uncured resin composite Filtek Supreme (+), and the resin
was compared to the peak of stretching mode in 1610 cm-1, which corresponds to the vibrational
mode of double bonds C=C of the benzene aromatic group, and this was used as an internal standard be-cause it remains unaltered during polymerization. Figures 1-3 also show the changes in the remaining carbon-carbon double bonds (C=C) in the cured res-in, whose characteristic peak reaches 1640 cm-1 and
presents reduced intensity upon polymer formation. The calculated DC (by the equation) ranged from 54.2 ± 10.0% to 76.6 ± 8.0% for the bottom and top surfaces, respectively. The DC values calcu-lated are shown in Table 3. The DC was statistically higher in the top than in the bottom surface for all groups.
Statistical comparisons between composites treated by the same LCU intensity showed that the DC in the top surface was higher in the GIII and
GVI specimens than in the GI and GIV specimens (p < 0.05). In the bottom surface, the DC was sta-tistically higher in the GII specimens than in GI and GIII specimens (p < 0.01).
Statistical comparisons between LCUs while con-sidering the same composites showed no statistically signiicant differences at the top surface (p > 0.05) among the tested groups. At the bottom surface and considering the same composite, the results showed that the FZ resin presented a signiicant difference when cured by the LED compared to FZ cured by halogen light (GII x GV) (p = 0.0173).
Discussion
The tested composite resins in this study contain CQ as a principal photoinitiator or in combination with Lucirin TPO3. Energy density parameters and the photoactivation method used are in agreement
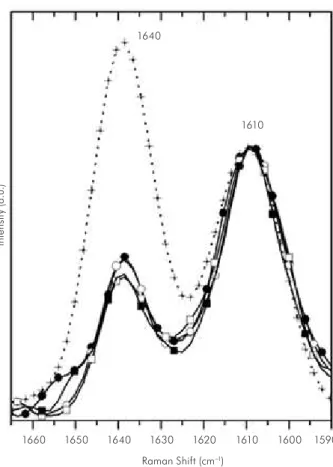
Figure 2 - Overlay graph presenting the Raman spectra of uncured resin composite Filtek Z250 (+), and the resin
cured by LED (GII) and halogen light (GV) at the top surface and 2 mm deep in the surface [GII: () top; () bottom; GV: () top; ( ) bottom].
In
te
n
si
ty
(
a
.u
.)
Raman Shift (cm-1)
1660 1650 1620 1610 1640
1640 1610
1600
1630 1590
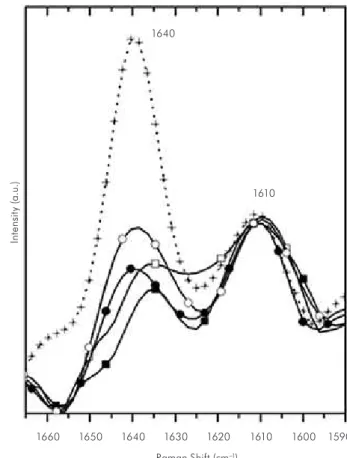
Figure 3 - Overlay graph presenting the Raman spectra of uncured resin composite Tetric Ceram Bleach (+), and the
resin cured by LED (GIII) and halogen light (GVI) at the top surface and 2 mm deep in the surface [GIII: () top; () bottom; GVI: () top; ( ) bottom].
In
te
n
si
ty
(
a
.u
.)
Raman Shift (cm-1)
1660 1650 1620 1610 1610
1640 1640
1600
with those of previous studies.8,14-16 In this study,
no signiicant increase in the DC values was found when the energy density levels exceeded 27 J/cm².
Due to the complex mechanism of the polymer-ization reaction, the DC of Bis-GMA-based resin composites reported is between 45% and 85%.3,5,12
To date, the minimum DC for a clinically satisfac-tory restoration has not been precisely established. Nevertheless, a negative correlation of in vivo abra-sive wear depth with DC has been found for values in the range of 55%-65%. This suggests that, at least for occlusal restorative layers, DC values below 55% may be cause for concern.12,17
The DC values measured at the top surface of the samples cured with a halogen LCU for 40 s reached mean values of 71.6% (FS), 70.1% (FZ) and 76.6% (TCB). These results are in agreement with those of previous studies that used similar spectro-scopic methods, variables and composites as those used in this study.3,4,18,19 The samples cured with the
LED presented DC mean values at the top surface of 68.1% (FS), 71.5% (FZ) and 73.4% (TCB). In a similar study by Calheiros et al.15, the Tetric Ceram
resin also presented average DC values higher than those presented by Filtek Z250 resin. The mean DC values at the top surface of all the resins tested were above the minimum considered adequate for polymerization (55%)17 and are in agreement with
those of the work of Price et al.,5 in which the LED
LCU cured resin samples, even those containing other coinitiators.
Signiicant differences among composites cured by the same LCU were observed for top and
bot-tom surfaces. At the top surface, the TCB compos-ite cured by the LED showed a higher DC than FS cured by the same LCU (p < 0.05). This fact was also found between TCB and FZ resin when consid-ering the halogen LCU (p < 0.05).
Those results could be due to some differences in resin composition. The DC seems strongly depen-dent on monomer composition and the amount and type of photoinitiator present.2,4,16,20,21 It is also
re-lated to double C=C bonds that react during polym-erization. Consequently, the differences in the values obtained in this study could be related to a number of factors, such as the photoinitiator/light source, the presence of more lexible monomer molecules or even the proportion of inorganic load within the composite resin.16 FS and FZ resins present
identi-cal organic matrix compositions, and part of the TEGDMA was replaced by UDMA and BisEMA.6
These materials present fewer double bonds per unit of weight and diminished conversion of these bonds during polymerization. TCB resin presents a differ-ent reactivity to light, due to the presence of organi-cally modiied silicate organized in layers.
The higher DC values observed in this study could be due to differences in the composition of the organic and inorganic portions of the compos-ites tested. The load particles interfere with polym-erization, promoting differences in light absorption and dispersion,9,10 but they do not spectrally
inter-fere with the bands used to determine the percent-age of conversion of dental composites.21 The nature
of the monomer molecules plays an important role in the inal DC values and differences in the
organ-Table 3 - Mean and standard deviation (SD) of the degree of conversion (%) measured at the top and bottom surfaces from the composites of the experimental groups (n = 10).
Groups Material / LCU DC (%) top (SD) DC (%) bottom (SD) P value
GI Filtek Supreme / LED 68.1 (4.6)a* 62.7 (8.3)a* 0.0045
GII Filtek Z250 / LED 71.5 (1.3)ab* 69.6 (1.3)b* 0.0025
GIII Tetric Ceram Bleach / LED 73.4 (8.6)b* 54.2 (10.0)a* 0.0007
GIV Filtek Supreme / Halogen 71.6 (7.4)a* 64.0 (5.4)a* 0.0059
GV Filtek Z250 / Halogen 70.1 (2.4)ab* 66.8 (2.8)a* 0.0026
GVI Tetric Ceram Bleach / Halogen 76.6 (8.0)b* 60.2 (12.1)a* 0.0004
ic composition could explain the lower DC values demonstrated in previous studies, which used resins with higher Bis-GMA proportion monomer sys-tems.11,20,22-24
A high TEGDMA ratio in the Bis-GMA/TEG-DMA mixture favors DC values,18,20 which can be
20% higher when compared to the UDMA/TEG-DMA systems.25 In FS and FZ resins, all the
mono-mers presented a high molecular weight but different mobility, which resulted in an adequate DC value.20
However, on the bottom, LED curing pro-duced a lower DC for TCB compared to FZ and FS (p < 0.01). A previous observation revealed differ-ences in the reactivity and activation properties for the halogen LCU between Tetric Ceram and Z100 resins.25 Therefore, low values in the bottom surface
of TCB resin could be due to the fact that the wave-length of light necessary to excite the coinitiator of this resin is strongly reduced by the sample due to the high degree of absorption that occurs as it pen-etrates the composite.26
It is important to understand how much the in-homogeneous surface of the sample inluences DC measurements and that differences in the spectra of the cured and uncured resin are probably due to sur-face heterogeneity and polymerization effects. Vari-ations in the size of load particles could be respon-sible for the heterogeneity of resins with the same organic matrix and could cause interference in the Raman scattering in that area, resulting in large dif-ferences in the DC values.27
When composition is considered, FS and FZ res-ins present similar percentages of inorganic matrix,
but the particle size is different. The former contains 20 nm silica nanoparticles and 0.6-1.4 µm zirco-nia-silica nanoclusters, whereas the latter contains zirconia-silica particles varying from 0.01-3.5 µm. Smaller particles spread light and make polymer-ization more dificult.9,10 Using the same irradiation
time, it is possible that the lower DC values found for the FS resin are due to the interaction between the light and the small particle size of the inorganic load or even the incorporation of coinitiators, which absorb light of shorter wavelengths.
This study has shown that the LED and halogen LCUs tested produced an adequate degree of con-version values on resins with lighter shades and that the different combination of photoinitiator systems produces similar DC in the composites. The hypoth-esis was accepted because the different composites tested reached an adequate degree of conversion re-gardless of the LCU used.
Conclusion
LED and halogen LCUs inluenced the DC at both the top and bottom surfaces of the composites tested. However, the resins reached an adequate DC after photoactivation with LED and halogen devic-es, thus exhibiting similar curing performances for the LCU.
Acknowledgments
This study was supported by the FAPESP (2001/14384-8). The authors are grateful to Mr. Rogério Goes (3M/ESPE Dental Products) and to Mrs. Camila Madruga (Ivoclar/Vivadent).
References
1. Uhl A, Mills RW, Jandt KD. Polymerization and light induced heat of dental composites cured with LED and halogen tech-nology. Biomaterials.2003 May; 24(10):1809-20.
2. Stansbury JW. Curing dental resins and composites by pho-topolymerization. J Esthet Dent. 2000;12(6):300-8. 3. Emami N, Söderholm KJ. Influence of light-curing procedures
and photo-initiator/co-initiator composition on the degree of conversion of light curing resins. J Mater Sci Mater Med. 2005 Jan;16(1):47-52.
4. Lohbauer U, Rahiotis C, Krämer N, Petschelt A, Eliades G. The effect of different light-curing units on fatigue behavior
and degree of conversion of a resin composite. Dent Mater. 2005 Jul;21(7):608-15.
5. Price RBT, Felix CA, Andreou P. Knoop hardness of ten resin composites irradiated with high-power LED and quartz-tung-sten-halogen lights. Biomaterials. 2005 May;26(15):2631-41. 6. Voltarelli FR, dos Santos-Doroz CB, Alves MC, Peris AR,
7. Palin WM, Senyilmaz DP, Marquis PM, Shortall CA. Cure width potencial for MOD resin composite molar restorations. Dent Mater. 2008 Aug;24(8):1083-94.
8. Halvorson RH, Erickson RL, Davidson CL. Energy dependent polymerization of resin-based composite. Dent Mater. 2002 Sep;18(6):463-9.
9. Leloup G, Holvoet PE, Bebelman S, Dejavaux J. Raman scat-tering determination of the depth of cure of light-activated composites: influence of different clinically relevant param-eters. J Oral Rehabil. 2002 Jun;29(6):510-5.
10. Yoon TH, Lee YK, Lim S, Kim CW. Degree of polymerization of resin composites by different light sources. J Oral Rehabil. 2002 Dec;29(12):1165-73.
11. Soares LES, Rocha R, Martin AA, Pinheiro ALB, Zampieri M. Monomer conversion of composite dental resins photoacti-vated by a halogen lamp and a LED: a FT-Raman spectroscopy study. Quim Nova. 2005;28(2):229-32.
12. Soares LES, Liporoni PCS, Martin AA. The effect of soft-start polymerization by second generation LEDs on the de-gree of conversion of resin composite. Oper Dent. 2007 Mar-Apr;32(2):160-5.
13. Khalil SK, Mousa AA, Tawfik WA. Use of FT-Raman spec-troscopy to determine the degree of polymerization of dental composite resin cured with a new light source. Eur J Dent. 2007 Apr;1(2):72–9.
14. Bouschlicher MR, Rueggeberg FA. Effect of ramped light intensity on polymerization force and conversion in a photo-activated composite. J Esthet Dent. 2000;12(6):328-39. 15. Calheiros FC, Braga RR, Kawano Y, Ballester RY.
Relation-ship between contraction stress and degree of conversion in restorative composites. Dent Mater. 2004 Dec;20(10):939-46. 16. Emami N, Söderholm KJM. How light irradiance and curing
time affect monomer conversion in light cured resin compos-ites. Eur J Oral Sci. 2003 Dec;111(6):536-42.
17. Silikas N, Eliades G, Watts DC. Light intensity effects on resin-composite degree of conversion and shrinkage strain. Dent Mater. 2000 Jul;16(4):292-6.
18. Imazato S, Mccabe JF, Tarumi H, Ehara A, Ebisu S. Degree of conversion of composites measured by DTA and FTIR. Dent Mater. 2001 Mar;17(2):178-83.
19. Musanje L, Ferracane JL. Effects of a resin formulation and nanofiller surface treatment on the properties of experimental hybrid resin composite. Biomaterials. 2004 Aug;25(18):4065-71.
20. Obici AC, Sinhoreti MAC, Frollini E, Correr-Sobrinho L, Consani S. Evaluation of depth of cure and Knoop hardness in a dental composite photo-activated using different methods. Braz Dent J. 2004 Sep-Dec;15(3):199-203.
21. Shin WS, Li XF, Schwartz B, Wunder SL, Baran GR. Determi-nation of the degree of cure of dental resins using Raman and FT-Raman spectroscopy. Dent Mater. 1993 Sep;9(5):317-24. 22. Emami N, Söderholm KJM, Berglund LA. Effect of light
power density variations on bulk curing properties of dental composites. J Dent. 2003 Mar;31(3):189-96.
23. Lindberg A, Emami N, Van Dijken JWV. A Fourier transform Raman spectroscopy analysis of the degree of conversion of a universal hybrid resin composite cured with light-emitting diode curing units. Swed Dent J. 2005;29(3):105-12. 24. Soares LES, Martin AA, Pinheiro ALB, Pacheco MTT.
Vick-er’s hardness and Raman spectroscopy evaluation of a dental composite cured by an argon laser and a halogen lamp. J Biomed Opt. 2004 May-Jun;9(3):601-8.
25. Shimomura H. Photochemical studies on composite resins cured by visible light. Dent Mater J. 1987 Jun;6(1):9-27. 26. Uhl A, Sigusch BW, Jandt KD. Second generation LEDs
for the polymerization of oral biomaterials. Dent Mater. 2004 Jan;20(1):87-90.