Neonatal Disease Diagnosis : AI Based Neuro-Genetic
Hybrid Approach
Dilip Roy Chowdhury1, Rahul Majumder2, Dipanwita Bhattacharjee(Roy Chowdhury)3
1
Expert System Laboratory Dept. of Computer Science & Application, University of North Bengal, West Bengal 734 013, India
2
Consultant Pediatrician Shivmandir Siliguri, West Bengal, 734 011, India
3
Dept. of Computer Science BSF Sr. Sec. High School Kadamtala, West Bengal, 734 011, India
Abstract
Accurate disease diagnosis and proper management is a matter of concern to everybody. In this context, there are a number of uncertainties involved including human errors. The problem is augmented when the domain is itself critical; for example, neonatal diseases. The problem is further augmented whenever and wherever proper experts are not available. Mitigating the kind of such problems, developing medical decision support systems using AI techniques are being explored during last few years. Combining neural networks with genetic algorithms is one of the approaches people use. It reduces various medical errors and provides better prediction of diseases. This article presents a study of neuro-genetic approach with multi layer perceptron (MLP) neural network diagnosing neonatal diseases. Integration of genetic algorithm and incremental back propagation neural network has been found suitable for a better trained network; experimental results and a comparative study corroborate the fact.
Keywords: Neuro-Genetic approach, Neural Networks, Neonatal diseases, Genetic algorithms, MLP.
1. Introduction
Newborn or neonate comes from Latin word, „neonatus’, which refers to an infant in the first 28 days after birth [1]. Neonatal phase is one of the vital and critical phases in child development. There are certain problems in managing neonates. Firstly, neonates can not spell out their problems except crying, in most of the cases. So, a very experienced clinical eye is solicited. Secondly, experts-neonatologists are scarce specially
in remote areas; general physicians are to manage the show in most cases. Thirdly, the information provided by the persons related with the patients may contain wrong, not-related or redundant information relating to signs and symptoms. Fourthly, signs and symptoms may overlap; generating problems for accurate diagnosis. Fifth, there are some region specific problems need to be addressed in this context. In a study, authors had explored several prevalent diseases of neonates in Tarai region of west Bengal, India [2]; indicating the regional characteristics. It is absolutely essential to identify and select the correct features of disease. To reduce the burden of morbidities and meeting the unmet need for health care in rural neonates [3], one has to adopt fast and accurate disease diagnosis and management. Mitigating the kind of such problems, developing medical decision support systems using AI techniques are being explored during last few years. Combining neural networks with genetic algorithm is one of the approaches people use. It reduces various medical errors and provides better prediction of diseases.
weights. If there is huge search space, GA may be used for searching and selecting features. It is also used for back propagation neural network determining the hidden layers parameters and numbers of hidden nodes.
In this study, we concentrate on a neuro-genetic approach for feature selection and network training methods to diagnose neonatal diseases. Proper selections of algorithms, neural network architecture, network training process and performance evaluation have been discussed. The rest of the paper has been arranged in the following way. Section 2 elaborates the related field studies. Incremental back propagation neural network and neuro-genetic fusion approach have been discussed in Section 3 and 4 respectively. Experimental results are highlighted in section 5. Lastly, our conclusions are summarized in section 6.
2. Related Studies
The main feature of an incremental learning neural network is to find how a network can learn new knownlodge without forgetting the old knowledge. In a study [6], authors proposed a new incremental learning method for pattern recognition which employs bounded weight modification and structural adaptation learning rules and applies initial knowledge to constrain the learning process. This approach has been applied in iris and the promoter domains for the classification problems. The parameter incremental learning (PIL) algorithms for the multilayer perceptron (MLP) are subsequently derived. In terms of accuracy and speed PIL algorithm has been found to be better as compared to stochastic diagonal Levenberg-Marquardt (SDLM) algorithm and batch back propagation as revealed in a study [7]. PIL algorithms are simple to compute and easy to use. This can be applied for better performance where BP algorithm is relevant. A method of artificial neural networks (ANN) coupled with genetic algorithms has been applied to evolve combinations of clinical variables optimized for predicting urinary tract infection [8]. Neuro-Genetic approach has also been proposed for feature selection in diagnosis of stroke disease. Here MLP is used whose inputs are automatically selected using GA and the experimental results show better classification accuracy with fewer inputs as features [9]. In another study of tuberculosis diagnosis, multilayer neural networks (MLNNs) with two hidden layers and genetic algorithm have been used for network training and feature selection [10]. The neuro–fuzzy approach combines the merits of connectionist and fuzzy approaches, which constitutes a key component of soft computing at this stage. In an another study [11], a detailed and integrated categorization of the various neuro–fuzzy models used for rule generation under a unified soft computing framework has been proposed.
GAs is basically inspired by Darwin‟s theory of evolution- survival of the fittest. For finding the approximate solution to optimization problems genetic algorithms are used. It is a global search technique and a particular class of evolutionary
algorithms. From biological sciences, evolutionary processes have been borrowed and translated to efficient search and design strategies. Genetic algorithms use these strategies to find an optimum solution for any multi-dimensional problem [12]. GA algorithms are the ways of solving problems by selection, crossover, mutation and accepting to progress of a problem solution. Each element in a genetic space is termed as chromosome. It is the collection of genes, the basic building block of the chromosome. Locus is the position of particular gene in the chromosome. In every generation the total population is evaluated using fitness function and there by selecting procedure. In this procedure high fitness chromosomes are used to eliminate low fitness chromosomes using Boltzmann selection, Roulette-wheel selection etc. After selection crossover, mutation process starts their job by which two-selected chromosomes with high fitness values exchange part of the genes to generate new pair of chromosomes. Crossover may be of different types, namely, uniform crossover, average crossover, multipoint crossover, one point crossover and two-point crossover. The mutation processes like, heuristic mutation, random gene mutation and creep mutation randomly changes the value of a gene for checking and preventing early convergence to local optima. This whole process will continue till the termination criteria are not satisfied for new population generation [13].
3. Incremental Backpropagation
3.1 Back Propagation Neural Network
Neural network models can be basically of two types- feedforward type and feedback type. The training of the network is accomplished by adjusting the connection weights by means of a local learning law. There are hundreds of local learning laws; back-propagation is one of the well-known technique [14]. Feed-forward networks are often trained using a back propagation-learning scheme. Back propagation learning works by making modifications in weight values starting at the output layer and then moving backward through the hidden layers of the network. Back propagation algorithm is the most popular algorithm for training of multi-layer perceptrons and is often used by researchers as well as by practitioners. Back propagation can also be efficient for large datasets if one properly selects the learning rate and momentum.
3.2 Needs of Incremental BP [6]
along with old instances for learning new instances maintaining the same old memory. In the case of non stationary data sets, the network should be adapted to the new instance and preserve previous knowledge if it is not in conflict with that instance. A technique is to minimize the network output error with respect to old instances subject to the approximation of the network output to the desired output of the new instances [l5]. Since the old instance has to be reexamined, this may not be treated as incremental learning technique. Incremental and batch back propagation algorithm may be used for networks of any size. The main drawbacks of back propagation are: slow convergence, need to tune up the learning rate and momentum parameters, and high probability of reaching local minima. Thus for a large datasets, incremental back propagation would be efficient. Eventually, this efficiency requires proper selection rate and momentum for the network learning.
4. Neuro-Genetic Approach
4.1 Application of GA in fusion approach
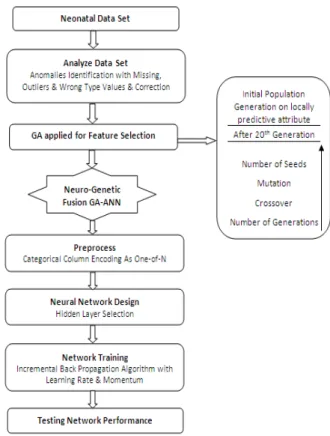
The fusion of artificial neural network with genetic algorithm has been accomplished by using GA to optimize the parameters for an ANN with specific topological architecture. Back propagation neural network learning is performed by frequent changing the weights at the output layer. When the gradient descent algorithm is used to modify the weights of the artificial neural network, it searches for the number of hidden nodes and connection weights in a specific network topology. There are many search algorithms and several soft computing techniques [16] to perform the domain attribute selection, for example; greedy local search, GA. Figure 1 depicts neuro-genetic fusion model considered in this study.
4.2 Analizing Data sets
Analyzing the dataset is required to define column parameters and detect data anomalies. Data analysis information needed for correct data preprocessing. After data analysis, we can see which values have been identified as missing, wrong type values or outliers and which columns were rejected as unconvertible for use with the neural network. Outliers are column values that are far away from the majority of the column data. Outliers can be just extreme cases, measurement errors or other anomalies. Outliers prevent correct neural network training and significantly degrade neural network performance. Studies recommend removing outliers from data before using neural networks and model designing. However, our data sets are free of such problems.
4.3. Feature Selection and preprocessing
In this fusion approach GA has been applied in such a way that it can reduce the size of the training set, if possible, and select the most relevant features from the data set for designing a proper
network structure. By using few trials, we select the hidden layer of the network. Here, the constraint is that there should have at least one layer between input and output layer of the network. We have used a dataset of having 95 instances belonging to 14 classes described by 14 categorical attributes as different sign and symptoms. GA search classifier used to select the mostly required attributes. The size of the neural network is particularly dependent on the number of input variables. To get best performance and avoid over-fitting problem in the network, the input variables should be less. Thus, we use pre-processing on the entire input data after randomization. This pre-processing actually eliminates the irrelevant and redundant data. This is required for optimization of the network structure.
4.4 Procedure for Attribute selection
Individual representation consists of a string of N bits, and N is the number of the original attributes. The i th bit can take not more than two values, i.e. 1 or 0. It represents whether the attribute is selected (1) or not (0). Hence, i = 1 …. N. For an example taken from our study, in the 14-attribute data set, the
individual “ 1 0 0 0 1 1 0 0 1 0 0 0 1 1” represents a solution
where the data set selects the attributes no 1st, 5th, 6th , 9th ,13th
and 14th are selected. Here we applied crossover and mutation operations.
4.5 Data Pre-processing and Post-processing
Neural networks performance is better on numeric data. But, we are having categorical data to be processed by neural network. Therefore, before that data to be used in the network, additional transformation is required as an input and after their reception at the output.
Data preprocessing means modification of the data before it is fed to a neural network. Preprocessing transforms the data to make it suitable for neural network.
Post-processing means modifying the neural network output to make it understandable by user or suitable for real world environment. Textual values can be used only if they represent a final set of values. Columns with such values are called categorical columns.
Numeric values should be scaled before feeding them to the network input, because artificial neurons have a limited range of operating values. Therefore, input information should be reduced to this range and output information should be received from network output by a reverse transformation. In this context, categorical columns automatically encoded during data preprocessing using one-of-N, encodings method. The one-of-N encoding means that a column with N distinct categories (values) is encoded into a set of N numeric columns, with one column for each category. For example, for the Birth_Term_Status column with values "Term", "Pre Term" and "Post Term", have been represented; Term as {1,0,0}, Pre Term as {0,1,0}, and Post Term as {0,0,1}.
4.6 Designing the Network
After preprocessing, the data are fed to neural network for training which is preceded by design phase. For designing a network, we need to specify the network architecture.
a.
Selection of Network ArchitectureThis process searches number of hidden layers and units of each layers and network properties which includes error and activation functions. Though the network properties are defined automatically; for our experiment, we have changed them manually for improving network performance. Here feed-forward fully-connected neural network MLP algorithm has been applied for searching best network architecture.
In this context, our objectives of the training process was to find the set of weight values which will cause the output from the neural network to match the actual target values as closely as possible. We have faced several issues concerned in designing and training a multilayer perceptron network model. Some of the issues are:
To select the number of hidden layers to use in the network.
To decide the number of neurons to be used in each hidden layer.
Converging to an optimal solution in a reasonable period of time.
Finding a globally optimal solution that avoids local minima.
Validating the neural network to test for over fitting.
b.
Hidden Layers SelectionIn our study, one hidden layer is sufficient for the network. Two hidden layers are required for modeling data with discontinuities such as a saw tooth wave pattern. As we find that using two hidden layers rarely improves the model, and it may introduce a greater risk of converging to a local minima. So, three layer models with one hidden layer are found suitable for our study.
c.
Deciding how many neurons to be used in the hidden layersThe most significant characteristic of a multilayer perceptron network is to decide the number of neurons in the hidden layer. The network may be unable to model complex data. The resulting fit will be poor, if an inadequate number of neurons are used in the network. Similarly, if too many neurons are used, the training time may become excessively long, and, worse, the network may overfit the data. When overfitting occurs, the network will begin to model random noise in the data. The overfitting model fits the training data extremely well, but generalizes poorly to new and unseen data. For controlling overfitting, we retain and restore best network.
d.
Training the NeworkWe train the selected architecture using incremental back propagation training algorithm. This has been studied with the training data for finding better training performance. For the purpose of comparison, we use traditional neural network, as well as batch back propagation neural network. The comparative results are shown in the later part of the paper.
e.
Performance evaluation on training dataAfter the network training process has been completed using algorithms, mentioned earlier, performance testing of the selected network has been done on training set. We tested using CCR% ( correct classification rate ) as well as confusion matrix.
5. Experiment and Result Analysis
5.1. Data for the study
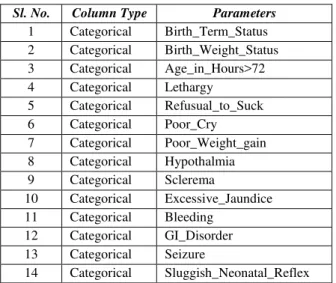
Table 1: Input Parameters
5.2. GA Based Attribute Selection
Initially we consider all the 14 symptoms for neuro-genetic fusion approach. Genetic Algorithm optimizes 14 inputs and the genotype is represented by the sequence of symptoms. GA algorithm is an adaptive optimization algorithm for simulating the inheritance and evolution of biology in the nature [17]. Genes are represented by real number encoding method. The chromosomes are generated randomly and the original population is a set of N chromosomes. Minimum optimization method has been applied for computing the fitness of each
Table 2: GA Parameters for Attribute Selection
chromosome. Fitness is given by Ci = 1/ E for each chromosome of the population, where E is the error computed as root mean square error at the output layer, where summation is performed overall output nodes pj and tj is the desired or target value of output oj for a given input vector. For finding the error we use the following:
After computing the fitness for all chromosomes, the worst fit chromosomes are replaced by best-fit chromosomes. Crossover steps are experimented using single point, two-point and multi point crossover term. In this study, the number of individual and initial population is 14. Maximum number of generation are fixed at 20. The probability of crossover is 0.7 and mutation is 0.035. This has been chosen in trial and error basis till the best performance achieved. Table 2 shows the GA parameters for the feature or attributes selection.
Finally mutation is applied as the last step to generate the new population. The new population is given as input to the classifier to compute the fitness of each chromosome, followed by process of selection, reproduction, crossover and mutations to generate the next population. This process is repeated till more or less all the chromosomes converge to the same fitness value. The categories of the initial population are showing in the Table 3.
Table 3: Initial Population
Merit Scaled Subset 0.09297 .00646 12 0.12137 .04982 7
0.34722 .39471 3 5 6 7 8 9 12 14 0.31215 .34115 7 9 13 14
0.38434 .45138 1 2 3 5 6 8 11 12 13 14 0.08874 0 3
0.31063 .33882 2 3 7 8 10 11 12 0.19273 .15879 4
0.36413 .42053 1 2 3 4 5 8 12 14 0.3017 .32518 2 4 8 11 12 0.33616 .37781 2 5 7 9 10 14 0.18158 .14176 14
0.34124 .38557 1 2 7 8 9 11 14 0.22485 .20783 1 4
After computing the 20th generation, the subset categories using GA are reflecting on Table IV. The irrelevant features are identified here which reduce the misuse classification. The basic idea was to find the best combination out of all inputs features and provide little computational process and maximum accuracy. The selected attributes using genetic algorithm are 1,2,3,4,5,6,7,9,10,11,12,13,14. It is noticed that attribute 8, which is Hypothalmia, is missing on the selected attributes set. This reflects the less importance of that attribute for decision making through neural network.
5.3 Data Partition Set and Preprocessing
Selected categorical input data are encoded by [-1..1] scaling range for the input columns and [0..1] scaling range for the output column at the time of analyzing. The last column is considered as the target or output one and other columns are considered as input columns. The dataset is divided into training, validation and test sets. The Data have been analyzed Sl. No. Column Type Parameters
1 Categorical Birth_Term_Status 2 Categorical Birth_Weight_Status 3 Categorical Age_in_Hours>72 4 Categorical Lethargy
5 Categorical Refusual_to_Suck 6 Categorical Poor_Cry 7 Categorical Poor_Weight_gain 8 Categorical Hypothalmia 9 Categorical Sclerema
10 Categorical Excessive_Jaundice 11 Categorical Bleeding
12 Categorical GI_Disorder 13 Categorical Seizure
14 Categorical Sluggish_Neonatal_Reflex
Attribute Selection on all input data
Search Method Genetic search
Start set no attributes
Population size 14
Number of generations 20 Probability of crossover 0.7 Probability of mutation 0.035
Report frequency 20
Random number seed 1
using Neuro-intelligence tool [18]. Table V shows the number records which are partitioned for training,
Table 4: After 20th Generation Subset Category
Merit Scaled Subset
0.44418 0.49641 1 2 3 4 5 6 7 9 10 11 12 13 14 0.44418 0.49641 1 2 3 4 5 6 7 9 10 11 12 13 14 0.44418 0.49641 1 2 3 4 5 6 7 9 10 11 12 13 14 0.41041 0 1 2 3 5 7 9 10 11 13 14 0.44418 0.49641 1 2 3 4 5 6 7 9 10 11 12 13 14 0.44418 0.49641 1 2 3 4 5 6 7 9 10 11 12 13 14 0.43019 0.29085 1 2 3 4 5 6 7 8 9 11 13 14 0.44385 0.49158 1 2 4 5 6 7 9 10 11 12 13 14 0.44418 0.49641 1 2 3 4 5 6 7 9 10 11 12 13 14 0.44418 0.49641 1 2 3 4 5 6 7 9 10 11 12 13 14 0.44418 0.49641 1 2 3 4 5 6 7 9 10 11 12 13 14 0.44027 0.43897 1 2 3 4 5 6 7 8 9 10 11 13 14 0.44279 0.47602 1 2 3 4 5 6 7 8 9 10 11 12 13 14 0.44418 0.49641 1 2 3 4 5 6 7 9 10 11 12 13 14
validation and test set. Out of 100% data, 68.42% data have been used for training data set and rest data are divided into validation and test data set at 15.79% consecutively.
Table 5: Data Partition Set
Partition Set Records Percentage (%)
Total 95 100
Training Set 65 68.42
Validation Set 15 15.79
Test Set 15 15.79
Ignore Set 0 0
Data encoding parameters have been depicted in Table 6.
Table 6: Pre-processing and Encoding Parameters
Data Preprocessing Information Range
Rows for preprocessing 95
Columns before preprocessing 14 Columns after preprocessing 35 Input columns scaling range [-1..1] Output column(s) scaling range [0..1] Categorical Column Encoding
Parameters
Range
Birth_Term_Status One-of-3
Birth_Weight_Status One-of-4
Age_ in_ Hours>72 Two-state
Lethargy Two-state
Refusal_to_Suck Two-state
Poor _cry Two-state
Poor _Weight _gain Two-state
Sclerema Two-state
Excessive _Jaundice Two-state
Bleeding Two-state
GI_ Disorder Two-state
Seizure Two-state
Sluggish_ Neonatal _Reflex Two-state Disease _Confirmation One-of-14
5.4 Network Characteristics
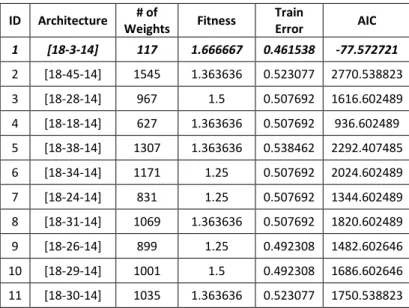
For searching the best network architecture; numbers of weights, fitness training error, validation error, test error and AIC (Akaike Information Criterion) have been considered. Basically, AIC is used to compare different networks with different weights (hidden units). AIC is used as fitness criteria during architecture search. Simple models are preferred to complex networks if the increased cost of the additional weights (hidden units) in the complex networks do not decrease the network error. It also determines the optimal number of weights required for the neural network. Heuristic searching method has been applied in this study. Out of 11 verified network architectures, [18-3-14] architecture had the best fitness with less number of weights. Table VIIshows the architecture search results.
Table 7: ANN Architecture Search
ID Architecture # of
Weights Fitness
Train
Error AIC
1 [18-3-14] 117 1.666667 0.461538 -77.572721
2 [18-45-14] 1545 1.363636 0.523077 2770.538823
3 [18-28-14] 967 1.5 0.507692 1616.602489
4 [18-18-14] 627 1.363636 0.507692 936.602489
5 [18-38-14] 1307 1.363636 0.538462 2292.407485
6 [18-34-14] 1171 1.25 0.507692 2024.602489
7 [18-24-14] 831 1.25 0.507692 1344.602489
8 [18-31-14] 1069 1.363636 0.507692 1820.602489
9 [18-26-14] 899 1.25 0.492308 1482.602646
10 [18-29-14] 1001 1.5 0.492308 1686.602646
11 [18-30-14] 1035 1.363636 0.523077 1750.538823
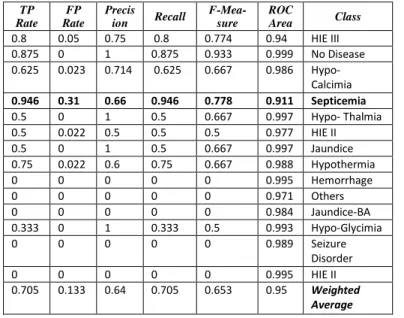
This network has 18 input neurons corresponding to the inputs, 3 hidden neurons and the output layer has 14 neurons. Here, the input neurons represent the symptoms for the neonatal disease diagnosis. The output layer neurons represent the predicted types of disease. Table 8 depicts those total available records which are relevant during the Recall or search. Septicemia has been found to be most significant with a recall value 0.946. Here harmonic mean of precision and recall is specified as F-Measure for each class.
5.5 Results summary
The test results are summarized in Table 9. The final performances of the neuro-genetic (incremental) approach are compared with traditional backpropagation learning (non incremental) and neuro-genetic fusion (GA-Batch BP). The comparative study clearly reveals that the present neuro-genetic approach with GA-Incremental-BP shows better performance and faster convergence due to nature of the network formed from the data set. The maximum training CCR% has been found to be 81.54 with only 123 iterations in
Table 8: Detailed Accuracy By Class
TP Rate
FP Rate
Precis
ion Recall
F-Mea-sure
ROC
Area Class
0.8 0.05 0.75 0.8 0.774 0.94 HIE III 0.875 0 1 0.875 0.933 0.999 No Disease
0.625 0.023 0.714 0.625 0.667 0.986 Hypo-
Calcimia
0.946 0.31 0.66 0.946 0.778 0.911 Septicemia
0.5 0 1 0.5 0.667 0.997 Hypo- Thalmia 0.5 0.022 0.5 0.5 0.5 0.977 HIE II 0.5 0 1 0.5 0.667 0.997 Jaundice 0.75 0.022 0.6 0.75 0.667 0.988 Hypothermia 0 0 0 0 0 0.995 Hemorrhage 0 0 0 0 0 0.971 Others 0 0 0 0 0 0.984 Jaundice-BA 0.333 0 1 0.333 0.5 0.993 Hypo-Glycimia 0 0 0 0 0 0.989 Seizure
Disorder 0 0 0 0 0 0.995 HIE II
0.705 0.133 0.64 0.705 0.653 0.95 Weighted
Average
Table 9: Comparative Study for Traning Performance
Approach Iteration CCR% (Training)
CCR% (Validation)
Traditional NN [19]
73 46.875 26.666666
189 68.75 40
364 75 20
Neuro-Genetic Fusion (GA-Batch BP) [20]
80 75.384613 40
252 78.46154 33.333332
414 78.46154 33.333332
Neuro-Genetic Approach(GA-Incremental BP)
124 81.53846 20
247 81.53846 20
368 81.53846 20
492 81.53846 13.3333
this approach. In the case of traditional NN, CCR% for training is only 75% but with 364 iterations. On the other hand, training CCR% is 78.46 using 252 iterations for simple GA-Batch-BP approach.
6. Conclusion
In this paper, we have presented a neuro-genetic approach for neonatal disease diagnosis. The system has been trained by
different ANNs; traditional batch back propagation, incremental back propagation, and also evaluated are with respect to their training ability. Feature selection has been successfully performed by genetic algorithm. In this study, hidden layer plays an important role of detecting relevant features. Moreover, the neuro-genetic approach using incremental learning with GA shows better performance when relevant attributes has been chosen correctly of any artificial neural network.
References
[1] “Neonate", Webster online dictionary, Merriam-Webster.
[2] D. Roy Chowdhury, M. Chatterjee, and R. K. Samanta, “A study on the status of New Born in Terai Region of West Bengal”, Advances in Modeling C, vol. 68, no. 1, A.M.S.E. France, No 05 225(2c), 2007, pp. 44-52.
[3] T. A. Bang, A. R. Bang, S. Baitule, M. Deshmukh and H. M. Reddy, “Burden of Morbidities and the Unmet Need for Health Care in Rural Neonates - A Prospective Observational Study in Gadchiroli-India.”, Indian Journal of Pediatrics, Vol. 38, 2001 pp. 952-965.
[4] Y Singh, and A. S. Chauhan, “Neural Networks in Data mining”, Journal of Theoretical and Applied Information Technology, Vol. 5, No. 1, 2009, pp. 37-42.
[5] D. Roy Chowdhury, M. Chatterjee, and R. K. Samanta, “A Data
Mining Model for Differential Diagnosis of Neonatal Disease”,
IFRSA‟s International Journal Of Computing, Vol. 1, No. 2,
2011pp. 143-150.
[6] LiMin Fu, Hui-Huang Hsu, and J. C. Principe,“Incremental
backpropagation learning networks”, IEEE Transanctions On
Neural Networks, Vol. 7, No. 3, 1996, pp. 757-761.
[7] S. Wan, and L. E. Banta,.,“Parameter Incremental Learning
Algorithm for Neural Networks”, IEEE Transanctions On Neural
Networks, Vol. 17, No. 6, 2006, pp. 1424-1438.
[8] P. S. Heckerling, G. Canaris, S. D. Flach, T. G. Tape, R. S. Wigton, and B. S. Gerber, "Predictors of urinary tract infection based on artificial neural networks and genetic algorithms", International Journal of Medical Informatics; vol.76, no.4, 2007, pp. 289-296,.
[9] D.Shanthi, G.Sahoo, and N.Saravanan, “Input Feature Selection using Hybrid Neuro-Genetic Approach in the Diagnosis of Stroke
Disease”, IJCSNS International Journal of Computer Science and
Network Security, Vol. 8, No. 12, 2008, pp. 99-107.
[10] E. Elveren and N. Yumuşak, “Tuberculosis Disease Diagnosis Using Artificial Neural Network Trained with Genetic
Algorithm”, Journal of Medical Systems, vol. 35, no. 3, pp.
329-332, 2009.
[11] S. Mitra and Y. Hayashi, “Neuro–Fuzzy Rule Generation: Survey in Soft Computing Framework”, IEEE Transanctions On Neural Networks, Vol. 11, Vo. 3, 2000, pp. 748-768,.
[12] D. E. Goldberg, “Genetic algorithms in search, optimization, and machine learning”, London, Addison-Wesley, 1989.
[13] A. Gowda Karegowda , A.S. Manjunath, and M.A. Jayaram,
“Application of Genetic Algorithm optimized Neural Network connection weights for Medical Diagnosis of PIMA Indians
Diabetes”, International Journal on Soft Computing ( IJSC ),
vol.2, no.2, 2011, pp. 15-23,.
[14] A. Roy, “Artificial neural networks – a science in trouble”,
SIGKDD Explorations, vol. 1, issue 2, pp. 33 – 38, 2000.
[15] D. C. Park, M. A. El-Sharkawi, and R. J. Marks II, “An
adaptively trained neural network,” IEEE Trans. Neural
[16] D. Roy Chowdhury, M. Chatterjee, and R. K. Samanta,
“Neonatal Disease Diagnosis with Soft Computing”, Proc.
International Conf. on Computing and System, ICCS-2010, The University of Burdwan, India, pp. 27-34, 2010.
[17] J.V. Hansen, J.B, McDonald, “Some Experimental evidence on the performance of GA-designed neural networks”, Journal of Experimental & Theoretical Artificial Intelligence, Vol. 13, No.3, 2001,pp.307-321.
[18] Neuro Intelligence using Alyuda”, Internet:
http://www.alyuda.com, 2008 [ Accessed May 11, 2011]. [19] D. Roy Chowdhury, M. Chatterjee, and R. K. Samanta, “An
Artificial Neural Network Model for Neonatal Disease
Diagnosis”, International Journal of Artificial Intelligence and
Expert Systems (IJAE), vol. 2, no 3, 2011, pp. 96-106 .
[20] D. Roy Chowdhury, M. Chatterjee, and R. K. Samanta, ,“Neuro -Genetic fusion approach towards developing a Decision Support
System for Neonatal Disease Diagnosis”, NaCCS – 2012,
National Conference on Computing and Systems, Dept. of Comp. Sc., Burdwan University, W. B., India.pp. 242-248, 2012. [21] M. Hall, E. Frank, G. Holmes, B. Pfahringer, P. Reutemann, and I.
H. Witten, The WEKA Data Mining Software: An Update, SIGKDD Explorations, Vol 11. No.1, 2009.
Mr. Dilip Roy Chowdhury is working as Asst. Professor in the Department of Computer Science and Application at the University of North Bengal for last four years. Before that, he has served Dept. of Computer Science & Application, Gyan Jyoti College which is affiliated under University of North Bengal, as Head of the department and other administrative responsibilities along with regular teaching job. Prior to joining Gyan Jyoti College, he had the opportunity to serve the Computer Science Department, at Purbanchal University, Birat Nagar, Nepal as a Lecturer.
Mr. Roy Chowdhury’s main research interests lie with the design and
implementation of Expert System Development using Artificial Intelligence and Soft Computing techniques. Besides, he is continuing his research in the fields of Data Mining, Rough Set Computing, Knowledgebase Design and Information Retrieval. Mr. Roy Chowdhury has been published papers in various international conferences and journals such as International Journal of Artificial Intelligence and Expert
Systems (IJAE) on AI and Expert Systems, International Journal of
Association for Modeling and Simulation in Enterprises (AMSE), IFRSA’s
International Journal of Computing, International Conf. on Computing and System, ICCS-2010 journal.
Mr. Rahul Mazumder is a Consultant Pediatrician. At present he is working as fellow in Pediatric Intensive Care, at Medanta Hospital, Gurgao. He received his MBBS in 2009 and M.D.(Pediatric Medicine) in 2012. His research interest is in the field of Neonatology, Medical Decision Making, Computer Medicine and Computer Based DSS for Pediatric disease diagnosis.