Automatic localization of fovea in retinal
images based on mathematical morphology
and anatomic structures
J.Benadict Raja#1, C.G.Ravichandran*2
#
Department of Computer Science and Engineering, PSNA College of Engineering and Technology Dindigul, T.N,India,
1
SCAD Institute of Technology, Palldam,Tirupur,T.N.,India, 2
Abstract —Diabetic macular edema is one of the retinal abnormalities which affects the central vision of the person and causes total blindness in severe cases. Fovea (center of macula) localization is an important step in retinal image analysis especially for grading diabetic macular edema. This paper describes a method to automatically localize the fovea center in retinal fundus images. The method is mainly based on mathematical morphology along with the information of other anatomic structures such as blood vessel and optic disc. Initially, the vascular structure and optic disc center are extracted, and then the morphological operations are employed on the gray scale image of green channel for fovea candidates’ selection. The candidates’ satisfying area, density and distance criteria are considered for the final stage. In the final stage, the candidate having lesser vessel pixels was considered as fovea region. The proposed method was evaluated on the two publicly available DRIVE and STARE databases. The method was able to obtain 100% of fovea localization accuracy on DRIVE database with 2.88 seconds average computation time.
Keywords: Retinal image analysis, Fovea localization, Diabetic macular edema.
I. INTRODUCTION
The central portion of retina which is usually darkest in digital fundus image and rich in cones is called macula (Fig. 1(a)). The center of macula is called fovea which is responsible for clear, sharp and detailed vision in the image. When the macula is affected in diabetic patients, it leads to diabetic macular edema (DME) [1].The two types of macular edema are, non-clinically significant macular edema (non-CSME) and clinically significant macular edema (CSME) [2]. Non-CSME is a mild form of edema in which the locations of exudates are at a distance from fovea and the central vision is not affected (Fig. 1(b)). CSME is the severe form of edema in which the exudates leak out and get deposited very close to or on the fovea affecting central vision of the eye (Fig. 1(c)) [3]. Therefore the automated localization of fovea is important to construct a computer aided diagnostic system for detecting DME. Together with the optic disc; the fovea is a defining element of fundus coordinate systems which are essential to characterize the spatial distribution of retinal features [4].
Localization of fovea has been attempted by several researchers recently. In most of the papers researchers considered fovea as the darkest non vessel region and the distance from the OD centre is approximately 2.5 times of the OD diameter[5]. These assumptions are applicable only for normal, healthy retinal images and not for pathological images. Therefore the fovea localization in pathological image is very difficult or time consuming. The presence of hemorrhages, hard exudates, non-uniform illumination, and the intensity similarity of the vessel and fovea make the automated fovea localization a difficult task [1]. Some of the existing methods can acquire better fovea localization accuracy. However, these methods suffer from lengthy processing time.
Fig.1. Retinal image with different stages of macular edema (a) Healthy retinal image with its main components (b) non-CSME retinal image (c) CSME retinal image
The contribution of this work is that it proposes a fast and effective algorithm that is capable of locating the fovea center not only in normal, healthy images but also in images affected by the diseases such as Diabetic retinopathy (DR) and DME. The intensity based candidate selection of this work ensures the speed of operation. The morphological operation, area and density criterion distinguish the fovea from other dark region. Further the distance criterion and the vessel pixel count on the candidate region reduce the false detection of fovea. We report the experimental results on two publicly available DRIVE [6] and STARE [7] databases and the obtained results are compared with the methods reported recently.
The remaining section of this paper is organized as follows: Section 2 briefly reviews the previous work on fovea localization. Section 3 details the fovea localization process. Experimental results are reported and discussed in Section 4. and Section 5 concludes the paper.
II. RELATED WORK
Intensity and vascular information based macula localization method is proposed by Sagar et al. [8]. They extracted the blood vessels using morphological operation. Then the blood vessel information is combined with the darkest region property of macula for localizing the macula region. This method achieved an average accuracy of 96% on DRIVE and STARE databases. Tobin et al. [9] employed a parabolic model on the vessel structure to identify the angle between the horizontal raphe and the line of symmetry separating the superior and inferior retinal regions of the retina. Then they defined the fovea center to be at 2.5DD along the horizontal raphe.Ying and Liu [10]extracted the retina blood vessel based on local energy function of blood vessel widths and densities and uses it to position the fovea area. They defined the search region as a circle within the main vessel arcades. Then the fovea is localized within the region by using the pixel intensity and vessel density.Chin et al. [4] also extracted the blood vessel and fit the parabolic curve for approximate the region of interest (ROI). Then they evaluated each sample location on the ROI, as the fovea is taken to be about the size of the optic disc and the vessel count on the sample is lesser than all other.
Tan et al. [11] combine both intensity and OD information for localizing the macula. The method uses the OD diameter to define the region of interest (ROI) for macula. Then they detect the macula region by detecting a region in the ROI of retina having low pixel intensity. The method has an accuracy of 98.8%. Sinthanayothin et al. [5] employed a 40x40 template to localize the fovea region on the retinal image subject to the condition that it be an acceptable distance (approximately 2.5 times the OD diameter) from the optic disc center.
Although a number of methods have been proposed for the localization of fovea, still there is a research gap in accurate detection of the centre of the fovea. The accuracy of existing techniques for fovea detection falls down in the presence of other dark regions like hemorrhages. In order to deal with this problem, we propose a complete novel method for the detection of fovea region by taking in to account the basic properties of fovea and its difference from rest of dark lesions.
III. PROPOSED FOVEA LOCALIZATION METHOD
A. Overview of The Methodology
In the first phase of the algorithm, the retinal components such as blood vessel and OD center are localized. The blood vessel are extracted using 2 Dimensional Gabor matched filter followed by simple thresholding technique, then the OD center is localized by combining the intensity and vascular information. In the next phase, the contrast limited adaptive histogram equalization (CLAHE) is employed on the green channel image for enhancing the contrast of fovea region. The other similar region of the fovea, such as blood vessel and hemorrhages are suppressed by applying suitable morphological operations. Then the initial fovea candidates are selected using thresholding, the threshold value is calculated based on the pixel count of the fovea. The candidates’ satisfying area, density and distance criterion are considered for final stage. In the final stage, the candidate having lesser vessel pixel is considered as fovea region. The flowchart of the proposed method is depicted in Fig.2.
B. Blood Vessel Extraction
Blood vessel segmentation is done using our earlier proposed method given in [15]. The green channel of the input image is enhanced using CLAHE with suitable clip limit, and the blood vessels are enhanced by employing 2 dimensional Gabor filter on the CLAHE’d image. Finally, the thresholding is applied to extract the binary vasculature. The obtained result of the blood vessel segmentation is shown in Fig.3 (b).
C. OD Center Localization
Green channel
Blood vessel
segmentation
Optic disc
localization V e ss el ex tr a c ti o n and O D l o cal iz a ti on
Gray scale image Input : Retinal
fundus image
Gray scale image Reference image
Blood vessel pixels
counting on each candidate OD and Fovea diameter
estimation
Threshold calculation
Initial Fovea candidates selection F o v ea Lo cal iz a ti o n Satisfying Density criterion Satisfying Area criterion No Yes
Fovea: Centroid of the candidate having lesser
vessel pixel Yes Satisfying Distance criterion No
Contrast Limited Adaptive Histogram Equalization Morphological Closing operation Morphological Opening operation Final candidates No Yes
Fig.3. Obtained results of blood vessel and OD localization (a) Original fundus image (b) Vessel extracted image (c) OD center (black dot) localized image
D. Fovea Localization
1) Fovea localization algorithm: The algorithm depicts each step of the fovea localization process; the major steps of the algorithm are discussed in the following sub section:
Step 1: CLAHE for contrast enhancement
Step 2: Morphological closing to removal of blood vessels Step 3: Morphological opening to flatten more fovea region Step 4: Threshold estimation for candidate selection Step 5: Initial candidate’s selection using thresholding Step 6: Select candidates’ area criterion which are satisfying;
If no candidate selected, increase threshold and go to step 5 Step 7: Select candidates’ density criterion which are satisfying;
If no candidate selected, increase threshold and go to step 5 Step 8: Select candidates’ distance criterion which are satisfying;
If no candidate selected, increase threshold and go to step 5
Step 9: Count vessel pixel on each candidates’ and select a candidate having lesser vessel pixel. Step 10: Fovea centre: Centriod of the candidate
Step 11: Stop
2) Preprocessing: It is observed that fovea is more contrasted in the green channel compared to other channel; therefore the gray scale of the green channel is taken for fovea localization. In order to enhance the image contrast and reduce the effect of non-uniform illumination the histogram based techniques are employed on the green channel image. Fovea is the darkest region in the retina [5], and the intensity of fovea is similar to the intensity of blood vessels and hemorrhages; therefore it is necessary to distinguish and remove other similar region from fovea. The obtained results of various pre-processing stages of non-pathological (DRIVE_10) and pathological (STARE_44) images are shown in Fig.4 and Fig.5.
Fig.4(d) and Fig.5(d)). The CLAHE operation not only increases the contrast of fovea but also the contrast of blood vessels and hemorrhages. In order to remove other similar region from fovea, the morphological operations are employed on the CLAHE’d image.
Mathematical morphology is a nonlinear image processing methodology based on minimum and maximum operations [17] whose aim is to extract relevant structures of an image.
Let g be a grayscale image which is defined as,
( )
g x
=
E
→
T
(1)Where,
x - the pixel position,
T ={0,1,2,…,255]}, for gray scale images
Dilation and Erosion are the two basic morphological operators that are defined as,
( )
:[
B( )]( )
max
b B x(
)
Dilation
δ
g
x
=
∈g x
+
b
(2)( )
: [
B( )]( )
min
b B x(
)
Erosion
ε
g
x
=
∈x
+
b
(3)Where, B is the structuring element, whose shape is usually chosen according to some a prioriknowledge about the geometry of the relevant and irrelevant image structures. The purpose of dilation and erosion is to expand light or dark regions, respectively, according to the size and shape of the structuring element [18]. By combining the dilation and erosion, the new set of operators or filters such us closing and opening are obtained that are used for removing the
blood vessels and other similar regions.
[
( )
:
closing B B B]
Closin
g
g
=
φ
=
g
(4)where, B is a disk-shaped structuring element larger than the maximal vessel width. We set B as 15 in all the images of our experiments. This value (i.e. B = 15) was obtained experimentally, and proved to be sufficient to remove the influence of the vessels in all tested images. We obtain the image
g
closing by performing a grayscale closing operation on ݃ (see Eq. (4)) (as illustrated in Fig.4(e) and Fig.5(e)). Afterwards, in order to flatten the fovea region more, we remove large intensity peaks by applying a grayscale opening tog
closing obtainingg
opening (see Eq. (5)).:
openingγ
B B[
B(
closing)]
Opening g
=
=
g
(5)where, B is a large disk-shaped structuring element (B = 30). Fig.4(f) and Fig.5(f) illustrates the resulting image
opening
g
. The value (i.e. B = 30) was empirically obtained and then used in all the images of our experiments.3)Threshold calculation: In normal retinal images, the OD generally appears to be circular/slightly oval in shape, and the approximate width and height are 1/8 and 1/7.33 of retinal image diameter (D) [19]. The area of fovea almost equal to the area of OD [20].Thus the fovea pixel count is calculated as follows:
(
)
2π
* D / 2
8*7.33
Fig.4. Preprocessing of fovea localization on DRIVE_10 (a) Original fundus image (b) Green channel image (c) Gray scale of green channel image (d) CLAHE’d image (e) Result of morphological closing (f) Result of morphological opening
To obtain an optimal threshold for initial candidate selection, the histogram derived from the input images is scanned from lowest intensity value (1) to highest intensity value (255). The scanning is stopped when the sum of pixels in an intensity level is > Estimated pixel count, and the intensity value at the moment is used as a threshold for initial candidate’s selection.
Fig.5. Preprocessing of fovea localization on STARE_44 (a) Original fundus image (b) Green channel image (c) Gray scale of green channel image (d) CLAHE’d image (e) Result of morphological closing (f) Result of morphological opening
4) Area and density criterion: In order to remove the similar candidates such as hemorrhages or other dark regions the area and density criterion are applied on all the initial candidates. According to the area criterion, the pixels in each initial candidate are counted, and the candidates having pixel count more than 125 % or less than 25% of estimated fovea pixel counts are discarded. Then the density criterion is applied on the candidates’ satisfying area criterion. According to the density criterion, the candidates having pixel count less than 50% of the number of pixels occupied by rectangle surrounding that candidates are discarded. The obtained results of various stages of fovea localization on a pathological image (STARE_44) are shown in Fig. 6.
(1.84DD to 4.2DD) as distance between macula and OD. The candidates within this range of distance are considered for the final stage.
6) Fovea center localization: The candidates’ satisfying distance criterion is considered for the final stage. In this stage, the vessel pixels are counted for each final candidate, the candidate having lesser vessel pixel is considered as fovea region. The centriod of the selected candidate is considered as fovea center. The obtained results on each stage of the fovea localization are shown in Fig.6.
Fig.6. Fovea localization on STARE_44 (a) Original fundus image (b) Result of preprocessing phase (c) Initial fovea candidates (d) Candidates satisfying area criterion (e) Candidates satisfying density criterion (f) Candidates satisfying distance criterion (g) Candidate with
lesser vessel pixel count (h) Fovea localized image (White dot represent the fovea center)
IV. RESULTS AND DISCUSSIONS
A. Material
The performance of the proposed method is evaluated on publicly available DRIVE (Digital Retinal Images for Vessel Extraction) and STARE (STructural Analysis of REtina) databases. The DRIVE database photographs were obtained from a diabetic retinopathy screening program in Netherlands. The screening population consisted of 453 subjects between 31 and 86 years of age. Each image has been JPEG compressed. The database contains 33 normal and 7 pathological images with exudates, hemorrhages and pigment epithelium changes. The images were acquired using a Canon CR5 non-mydriatic camera with a 45◦ field of view (FOV). Each image was captured using 8-bits per color plane at 768 by 584 pixels.
The STARE database was composed with the intention to create a difficult database. The database contains 31 images of healthy retinas and 50 of pathological retinas. The pathological images exhibit a wide variety of lesions and other symptoms of diseases. The images were acquired using a TopCon TRV-50 fundus camera at 35◦ FOV, and subsequently digitized at 605 × 700 pixels in resolution, 24 bits per pixel.
B. Results on DRIVE and STARE databases
The method was implemented on 3.06 GHz core i3 processor with 3.17 GB RAM using MATLAB 7.6. The proposed method achieved a success rate of 100% (i.e., the fovea was detected correctly in 40 out of the 40 images contained in the DRIVE dataset). Additionally, the fovea was detected correctly in the pathological images of STARE database. The method is fully automatic and localizes the fovea center of one DRIVE image within 2.88 seconds without optimization of its Matlab code. The obtained results on set of DRIVE and STARE databases are shown in Fig.7 and Fig.8 respectively.
images based on the illumination of the image. The approximate time to localize the fovea centre is .06 seconds, if the assumption on fovea is correct. The average computation time for processing a DRIVE image is only 2.88 seconds.
C. Discussion
In Fig.7, and Fig.8, the results of the proposed method for some retinal images of DRIVE and STARE
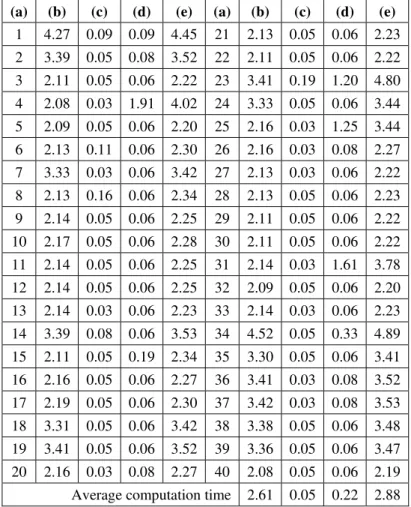
TABLE I
Computation Time on DRIVE Images
(a) Image No (b) Vessel Extraction Time in Seconds (c) OD Localization Time in Seconds (d) Fovea Localization Time in Seconds
(e) Computation Time in Sseconds
(a) (b) (c) (d) (e) (a) (b) (c) (d) (e)
1 4.27 0.09 0.09 4.45 21 2.13 0.05 0.06 2.23 2 3.39 0.05 0.08 3.52 22 2.11 0.05 0.06 2.22 3 2.11 0.05 0.06 2.22 23 3.41 0.19 1.20 4.80 4 2.08 0.03 1.91 4.02 24 3.33 0.05 0.06 3.44 5 2.09 0.05 0.06 2.20 25 2.16 0.03 1.25 3.44 6 2.13 0.11 0.06 2.30 26 2.16 0.03 0.08 2.27 7 3.33 0.03 0.06 3.42 27 2.13 0.03 0.06 2.22 8 2.13 0.16 0.06 2.34 28 2.13 0.05 0.06 2.23 9 2.14 0.05 0.06 2.25 29 2.11 0.05 0.06 2.22 10 2.17 0.05 0.06 2.28 30 2.11 0.05 0.06 2.22 11 2.14 0.05 0.06 2.25 31 2.14 0.03 1.61 3.78 12 2.14 0.05 0.06 2.25 32 2.09 0.05 0.06 2.20 13 2.14 0.03 0.06 2.23 33 2.14 0.03 0.06 2.23 14 3.39 0.08 0.06 3.53 34 4.52 0.05 0.33 4.89 15 2.11 0.05 0.19 2.34 35 3.30 0.05 0.06 3.41 16 2.16 0.05 0.06 2.27 36 3.41 0.03 0.08 3.52 17 2.19 0.05 0.06 2.30 37 3.42 0.03 0.08 3.53 18 3.31 0.05 0.06 3.42 38 3.38 0.05 0.06 3.48 19 3.41 0.05 0.06 3.52 39 3.36 0.05 0.06 3.47 20 2.16 0.03 0.08 2.27 40 2.08 0.05 0.06 2.19 Average computation time 2.61 0.05 0.22 2.88
Fig 8. Retinal images with incorrectly detected fovea center (a) RGB fundus image (b) Vessel extracted image (c) OD localized gray scale
V. CONCLUSION
Diabetic macular edema is one of the retinal abnormalities that affects the central vision of the person and causes total blindness in severe cases. The algorithm for the automatic and robust extraction of fovea in retinal fundus images was developed in this paper. To begin with, the proposed algorithm extracts the main components of the human retina, i.e. the blood vessels and optic disc for easier localization of the fovea. Then, the region based histogram equalization is employed on the green channel image for enhancing the contrast of fovea region. In order to suppress the other dark region such as blood vessel and hemorrhages, suitable morphological operations were applied. Initial fovea candidates were selected by applying suitable thresholding on the result of the morphological operation. The candidates’ satisfying area, density and distance criteria and having lesser vessel pixel are selected as fovea region.
We have evaluated the proposed algorithm on publicly available DRIVE and STARE databases. A significant reduction in computation time and the attainment of useful fovea center localization even in pathological or poor quality images are the most relevant improvements of this work. In addition to giving competitive performance, the proposed approach does not have any parameters to be tuned depending on datasets. The fovea location obtained with this automatic approach will be used as an initial step for the detection of diabetic macular edema.
REFERENCES
[1] M.Usman Akram, Anam Tariq, Shoap A.Khan, M.Younus Javed, Automated detection of exudates and macula for grading of diabetic
macular edema, Computer methods and programs in biomedicine, 114(2014)141-152
[2] J. Kansky, Clinical Ophthalmology, Butterworh-Heinmann,London, 1994.S
[3] M. Iwasaki, H. Inomara, Relation between superficial capillaries and fovea structures in the human retina, Journal of Investigative &
Visual Ophthalmology 27 (1986) 1698–1705.S
[4] Khai Sing Chin, Emanuele Trucco, Lailing Tan, Peter J.Wilson, Automatic fovea location in retinal images using anatomical priors
and vessel density, Pattern Recognition etters,34(2013)1152-1158S
[5] C. Sinthanayothin, J.F. Boyce, H.L. Cook, T.H. Williamson, Automated localization of the optic disc, fovea, and retinal blood vessels
from digital color fundus images, British Journal of Ophthalmology 83 (1999) 902–910.S
[6] DRIVE: Digital Retinal Images for Vessel Extraction. URL:/http://www.isi.uu.nl/Research/Databases/DRIVE/SS
[7] A. Hoover, M. Gold Baum , Locating the Optic Nerve in a Retinal Image Using the Fuzzy Convergence of the Blood Vessels, IEEE
Transactions on Medical Imaging, vol. 22 no. 8,2003,pp. 951-958.S
[8] A.V. Sagar, S. Balasubramanian, V. Chandrasekaran, Automatic detection of anatomical structures in digital fundus retinal images, in:
Conference on Machine Vision Applications, May 16–18, 2007, pp. 483–486.S
[9] Tobin, K.W., Chaum, E., Priya Govindasamy, V., et al., 2007. Detection of anatomic structures in human retinal imagery. IEEE Trans.
Med. Imaging 26 (12).S
[10] Ying, H., Liu, J.C., 2010. Automated localization of macula-fovea area on retina images using blood vessel network topology. In:
IEEE ICASSP (International Conference on Acoustics, Speech, Signal Processing), pp. 650–653.S
[11] Tan, N.M., Wong, D.W.K., Liu, J., et al., 2009. Automatic detection of the macula in the retinal fundus image by detecting regions
with low pixel intensity. In: Proc.ICBPE, pp. 1–5.S
[12] S. Lu, J.H. Lim, Automatic macula detection from retinal images by a line operator, in: Proceedings of 2010 IEEE 17th International
Conference on Image Processing, 2010, pp.4073–4076.Q
[13] Liang, Z., Wong, D.W.K., Liu, J., et al., 2010. Towards automatic detection of age related macular degeneration in retinal fundus
images. In: 32nd Annual International Conference of the IEEE EMBS Buenos Aires, Argentina, August 31– September 4.Q
[14] H. Li, O.Chutatape, Automated feature extraction in color retinal images by a model based approach, IEEE Transactions on
Biomedical Engineering, vol. 5 no. 2,2004,pp. 246-254.Q
[15] C. G. Ravichandran and J. Benadict Raja , A Fast Enhancement/Thresholding Based Blood Vessel Segmentation for Retinal Image
Using Contrast Limited Adaptive Histogram Equalization, J. Med. Imaging Health Inf. Vol. 4, 567-575 (2014)Q
[16] J. Benadict Raja ,C. G. Ravichandran, Fast localization of the optic disc in retinal images using intensity and vascular information,
International Review on Computer and Software, vol.9, no.7, pp.1282-1292.D
[17] J. Serra, Image Analysis and Mathematical Morphology. London,U.K.: Academic, 1982, vol. I.D
[18] Sandra Morales, Valery Naranjo, Jesús Angulo, and Mariano AlcañizAutomatic Detection of Optic Disc Based on PCA and
Mathematical Morphology, IEEE TRANSACTIONS ON MEDICAL IMAGING, VOL. 32, NO. 4, APRIL 2013D
[19] Seng Soon Lee, Mandava Rajeswari and Dhanesh Ramachandram, “ reliminary and Multi Features Localisation of Optic Disc in
Colour Fundus Images”, National Computer Science ostgraduate Colloquium, Malaysia, 2005 d
[20] Barr, D.B., Weir, C.R., Purdie, A.T., 1999. An appraisal of the disc-macula distance to disc diameter ratio in the assessment of optic
disc size. Ophthal. Physiol. Opt. 19
[21] Mok, K.H., Lee, V.W.H., 2002. Disc-to-macula distance to disc-diameter ratio for optic disc size estimation. J. Glaucoma 11, 392–
395.q
AUTHORPROFILE
J.Benadict Rajareceived the M.E. degree in Computer Science and Engineering from the Anna University, Chennai, India in 2008. Since 2011 he has been pursuing the Ph.D. degree student at the Anna University of Technology Madurai, India. His current research interests include Medical Image Processing, Parallel programming and Parallel Architecture.