The Relative Contribution of Immigration or
Local Increase for Persistence of Urban
Schistosomiasis in Salvador, Bahia, Brazil
Ronald E. Blanton1*, Lúcio M. Barbosa2,3, Eliana A. Reis2, Theomira M. Carmo2, Cláudio R. A. dos Santos2, Jackson M. Costa2, Peace T. Aminu1, Walter A. Blank1, Renato
Barbosa Reis2,4, Isabel C. Guimarães5, Luciano K. Silva2, Mitermayer G. Reis2,3,6
1Case Western Reserve University, Centre for Global Health and Diseases, Cleveland, Ohio, United States of America,2Gonçalo Moniz Research Center, Oswaldo Cruz Foundation, Salvador, Bahia, Brazil, 3Bahiana School of Medicine and Public Health, Salvador, Bahia, Brazil,4Post-graduate Program in Regional and Urban Development, UNIFACS (Universidade Salvador), Imbuí, Salvador, Bahia, Brazil, 5Center for Control of Zoonoses, Municipal Secretariat of Health, Salvador, Bahia, Brazil,6Federal University of Bahia Faculty of Medicine, Sede Mater Praça XV de novembro, s/n—Largo do Terreiro de Jesus, Salvador, Bahia, Brazil
*reb6@case.edu
Abstract
Urbanization is increasing across the globe, and diseases once considered rural can now be found in urban areas due to the migration of populations from rural endemic areas, local transmission within the city, or a combination of factors. We investigated the epidemiologic characteristics of urban immigrants and natives living in a neighborhood of Salvador, Brazil where there is a focus of transmission ofSchistosoma mansoni. In a cross-sectional study, all inhabitants from 3 sections of the community were interviewed and examined. In order to determine the degree of parasite differentiation between immigrants and the native born,
S.mansonieggs from stools were genotyped for 15 microsatellite markers. The area re-ceived migrants from all over the state, but most infected children had never been outside of the city, and infected snails were present at water contact sites. Other epidemiologic fea-tures suggested immigration contributed little to the presence of infection. The intensity and prevalence of infection were the same for immigrants and natives when adjusted for age, and length of immigrant residence in the community was positively associated with preva-lence of infection. The population structure of the parasites also supported that the contribu-tion from immigracontribu-tion was small, since the host-to-host differentiacontribu-tion was no greater in the urban parasite population than a rural population with little distant immigration, and there had been little differentiation in the urban population over the past 7 years. Public health ef-forts should focus on eliminating local transmission, and once eliminated, reintroduction from distant migration is unlikely.
OPEN ACCESS
Citation:Blanton RE, Barbosa LM, Reis EA, Carmo TM, dos Santos CRA, Costa JM, et al. (2015) The Relative Contribution of Immigration or Local Increase for Persistence of Urban Schistosomiasis in Salvador, Bahia, Brazil. PLoS Negl Trop Dis 9(3): e0003521. doi:10.1371/journal.pntd.0003521
Editor:Paul J. Brindley, George Washington University Medical Center, UNITED STATES
Received:March 11, 2014
Accepted:January 5, 2015
Published:March 16, 2015
Copyright:© 2015 Blanton et al. This is an open access article distributed under the terms of the
Creative Commons Attribution License, which permits
unrestricted use, distribution, and reproduction in any medium, provided the original author and source are credited.
Data Availability Statement:De-identified demographic and allele frequency data are openly available at Case Western Reserve’s online source for curated digital content, Digital Case (http://library. case.edu/digitalcase/DatastreamListing.aspx?PID=
ksl:blanton2). Kelvin Smith Library, Case Western
Author Summary
Urban transmission of schistosomiasis is becoming more recognized as rural disease is be-coming less common and urbanization increases. Characteristics of infection of the immi-grant population to cities and genetic characteristics of the parasite population itself indicate local transmission is the most important factor for the presence of the parasite rather than arrival of infected immigrants. While there is 70% coverage of adequate sanita-tion, this was insufficient to interrupt transmission. If eliminated, this focus is unlikely to readily reappear due to immigration.
Introduction
Urbanization, the concentration of regional populations in cities, has been the great global de-mographic trend of the last 100 years, and the urban context has influence the nature and dis-tribution of parasitic diseases, such as schistosomiasis. While the disease is usually thought of as a rural problem, it is increasingly recognized in large urban areas of Brazil [1,2,3,4,5,6]. In Brazil, urbanization has been rapid, and today 86% of Brazilians live in cities [7] compared with 80% of the US population [8]. The city of Salvador, the capital of the state of Bahia, is a good example of this growth. The city’s population has increased by 300% in just 20 years, mostly due to migration from rural areas. At this pace, city services have not been able to keep up in the neighborhoods with the highest proportion of informal housing [9,10]. Schistosomia-sis is ultimately a disease of inadequate sanitation, so that the pace of migration may also influ-ence the presinflu-ence or persistinflu-ence and even spread of schistosomiasis in the urban environment. The relative contribution of migration or local transmission, therefore, becomes an important public health issue when considering control measures.
The presence of schistosomiasis in the city of Salvador is not a new problem. In fact, the city has had a historic role in the study of schistosomiasis.Schistosoma mansoniwas conclusively
differentiated fromS.haematobiumin 1908 by the Brazilian scientist, Pirajá da Silva, based on
patients resident in Salvador [11]. Between 2000 and 2006, the state required reporting of all cases of schistosomiasis identified in municipal areas. All regions of the city reported cases from clinics (Fig. 1A), and multiple hospitals. Still, prevalence for the whole metropolitan area of Salvador in the last 10 years has only been between 2 to 5% [12]. Hospital cases were concen-trated in the central and northern regions of the city consistent with the Municipal Health De-partment reports of positive stool exams and predictably included areas with the greatest combination of low income, high population density and new migration [13,14].
Some degree of local transmission has been demonstrated in the city. In 2004, 30% of school-aged children in the São Bartolomeu neighborhood of Salvador were found to have schistosomiasis [15]. Some children had stool egg counts in the thousands, where 400 eggs per gram of feces (epg) is considered heavy. Three of the 298 children examined had splenomegaly. Further, a 2011 cross-sectional survey of major water bodies in Salvador [16] foundS.mansoni
infected snails in 7 of 158 locations. What percentage of infections in the city is due to migra-tion from endemic rural areas and what percentage represents local transmission is not known, but it is an important question when considering public health measures. We studied the distri-bution of infections within the human population and the genetic epidemiology ofS.mansoni
in São Bartolomeu to better understand the risks, sources and persistence of the infection with-in a large metropolitan area.
transmission, whether by electronic means or otherwise, without prior written permission is strictly prohibited. For more information contact Digital Case
atdigitalcase@case.edu.
Funding:This publication was supported by the National Institutes of Allergy and Infectious Diseases, and the National Institutes of Health (NIH), through Grant R01 AI069195. The content is solely the responsibility of the authors and does not necessarily represent the official views of the NIH. Lúcio Barbosa was supported by the Council for Scientific and Technological Development (CNPq) and the Brazilian Federal Agency for the Support and Evaluation of Graduate Education (CAPES). The funders had no role in study design, data collection and analysis, decision to publish, or preparation of the manuscript.
Methods
Ethics statement
The Committee on Ethics in Research of the Oswaldo Cruz Foundation of Salvador, Bahia, the Brazilian National Committee on Ethics in Research and the Institutional Review Board for Human Investigation of University Hospitals Case Medical Center, Cleveland, Ohio approved the study design. All subjects provided written informed consent or in the case of minors, con-sent was obtained from their guardians. All aspects of the study have been conducted according to the principles expressed in the Declaration of Helsinki.
Study site and population
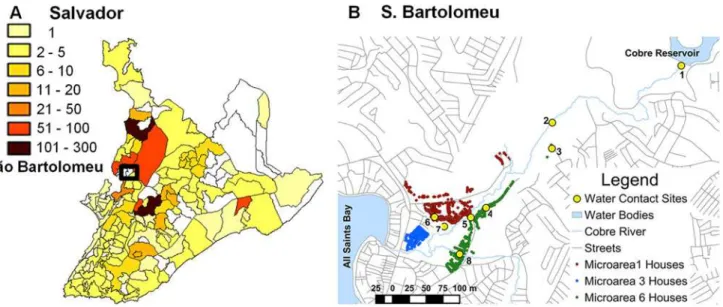
The neighborhood of São Bartolomeu (12o5404" S, 38o28031" W) is located in the northwestern
part of the city between the Cobre Reservoir with its nature park and the All Saints Bay. The Cobre River drains from a large reservoir into a small mangrove swamp and then out to sea. The neighborhood surrounds this outlet of the Cobre River (Fig. 1B) and is home to nearly 5,000 in-habitants. Socially, São Bartolomeu is considered a low-income and high-crime area with hous-ing that dates from the 1970's, but informal new houshous-ing is continually behous-ing added. A recently established unit of the Federal Family Health Program has divided the region into 6 microareas. Each has approximately 800 residents, and each has an assigned health agent who is a liaison be-tween the community and the clinic. For comparison we used data from our study on the distri-bution of schistosomiasis and its genetic epidemiology in 2 rural communities 200 km southwest from Salvador [17,18] in the municipality of Ubaíra (13o14’59”S, 39o43’60”W).
Study design and protocol
The 3 microareas with the highest prevalence ofS.mansoniinfection in school-aged children
in 2004 [15] were selected for study. All households were visited, numbered and their location
Fig 1. Distribution of schistosomiasis in Salvador and the neighborhood of São Bartolomeu.A. Distribution of mean annualS.mansoni-positive fecal examinations in Salvador by neighborhood 2000–2006. No information was available for blank areas. Source: Salvador Municipal Secretariate of Health (http://www.tabnet.saude.salvador.ba.gov.br). B. Map of São Bartolomeu showing homes in the 3 microareas (MA) and rivers running through the community
registered with a hand-held Trimble. Nomad GPS unit (Model 65220–11). Responses to a questionnaire were recorded for each resident. Interviewers solicited the respondent’s age, sex, race, years of residence in Salvador, previous residence, travel outside of the city of Salvador, education, occupation, major household goods, use of city services, frequency of flooding, his-tory ofS.mansoniinfection, treatment for schistosomiasis, surface water contact sites
com-monly visited and activities performed at these sites. Parents and guardians responded to some questions for minors<12 years of age. Water contact information was obtained directly from
each resident. The 8 major sites where residents came into contact with surface water were identified by community members and confirmed in the survey. All contact sites were located along the Cobre River (Fig. 1B).
Field laboratory procedures
All residents>4 years of age were asked to provide 3 stools on different days for parasitologic
examination. We also analyzed stool eggs from 9 infected residents of São Bartolomeu col-lected in 2004 for comparison. For fecal examination, the stools were weighed to the nearest 0.1 g with a digital balance (Startools, China), and then a single slide was processed by the Kato-Katz method and examined microscopically to identify ova ofS.mansoniand other
hel-minths. The number ofS.mansoniova were quantified, recorded and finally expressed as
eggs per gram of feces (epg). Total egg counts were calculated as stool weight X epg. Each stool positive forS.mansoniova was homogenized, filtered and sedimented as described [18]
to obtain a sample enriched for these ova. A standard phenol-chloroform extraction was fol-lowed by treatment with hexadecyltrimethylammonium bromide (CTAB) to remove PCR in-hibitors [19].
Microsatellite genotyping
Primers for 15 microsatellite markers [20] were used to amplifyS.mansoniDNA. The
specific-ity of these markers has been demonstrated for this parasite in stool samples as have the utilspecific-ity [18,20,21,22] and limitations [23] of the approach for schistosomes as well as other parasites [24,25,26]. The intensity of resultant amplicons was measured by automated sequencer and an-alyzed with the program Peak Scanner (Applied Biosystems, Waltham, Massachusetts). Allele frequencies were calculated by dividing the peak height for each allele by the sum of all peaks for the microsatellite. Peaks providing less than 5% of the total intensity were excluded as were markers where no peaks were greater than 100 pixels using the program’s default settings. The number of alleles for each marker was calculated by multiplying the allele frequency by sample total egg counts.
Data analysis
Demographic data and water contact were analyzed for their association with infection status using logistic regression or for infection intensity with forward conditional linear regression in SPSS. Independent variables were age, sex, migration status, percent of lifetime spent in the community, income, household size, type of sanitation, history of household flooding, number and location of water contact sites visited, previousS.mansoniinfection and history of
treat-ment. Age groups at 5-year intervals were compared for prevalence of infection. Adequate sew-age disposal was defined as the presence of a connection to the municipal sewer system or a septic tank. Household density was evaluated as number of occupants per number of bed-rooms. Persons born outside of the city of Salvador were considered immigrants. p values
<0.05 were considered statistically significant if less than the value obtained after Bonferroni
within one host.Component populationswere all the parasites within a host species usually within a limited geographic area. We also stratified parasites as component populations based on host demographic characteristics.
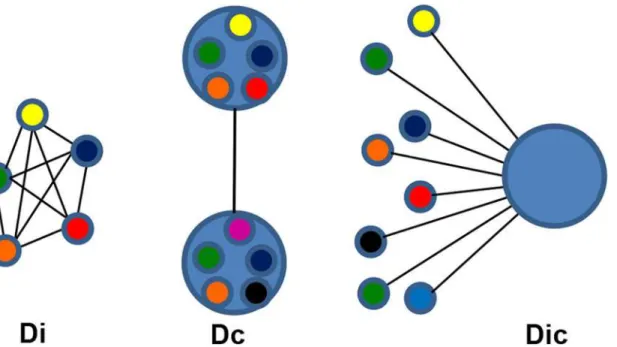
Genetic differentiation based on Jost's D [27] was used to compare pairwise the infrapopula-tions of infected individuals (Di). The mean for all Di comparisons was calculated for stratified subsets of infected individuals based on demographic, geographic or parasitologic characteris-tics (Fig. 2). When the combined allele numbers for infrapopulations from one group of hosts were compared to a different group, this comprised the component population differentiation (Dc). Each individual's parasite infrapopulation was compared to the component population to yield the Dic. The Dic produces a single number representing how differentiated an individual's population is from the population infecting all humans in São Bartolomeu. Jost’s D and its con-fidence interval were calculated with the Diversity Index function in the Species Prediction and Diversity Estimation program (SPADE) (http://chao.stat.nthu.edu.tw, Chao, A. and Shen, T.-J., last accessed 6–9–2013). Finally, the effective allele number (AE), a measure of genetic diversi-ty, was calculated as described [16,28]. Means for continuous variables were compared by a bootstrapped Student's t-test using SPSS for Windows (Version 19.0). Egg counts were normal-ized by log-transformation. Supplemental data (S1 Dataset) containing demographic data and infrapopulation allele frequencies have been deposited with Case Western Reserve's online source for curated digital content, Digital Case (http://library.case.edu/digitalcase/ DatastreamListing.aspx?PID=ksl:blanton2).
Fig 2. Schematic diagram of population comparisons for differentiation. Di—Small circles represent infrapopulations infecting a single host. The individuals in the infrapopulations are heterogeneous, but they are all represented by a single color, their average allele frequency. Each line is a discrete value for the pairwise Jost’s D between infrapopulations. The Di’s of infrapopulations from a group of hosts are summarized by the average.Dc—Large circles represent component populations made up of all the parasites in an area or a group of hosts with the same epidemiologic characteristic. The Dc is calculated from the combined allele numbers for all members of the component population compared to the allele numbers from the comparison group. From a comparison of the 2 groups, a single value for Jost’s D is calculated.Dic—This compares the allele frequencies of individual infrapopulations to the combined allele frequency of their source component populations. Each infrapopulation will be characterized by a single value for Jost’s D that represents its relative similarity to the component population. The Dic’s of infrapopulations from a group of hosts are summarized by their average.
Results
Study population
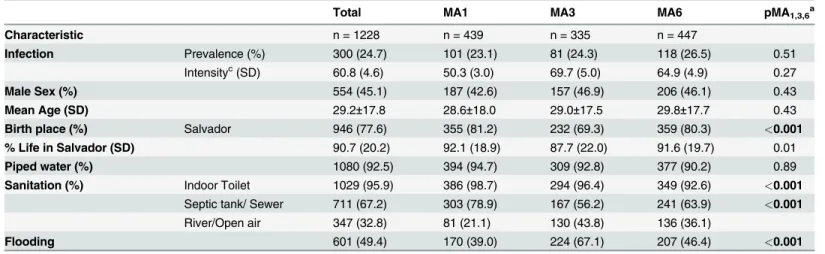
A total of 1,335 residents were identified in the 3 selected microareas (MA1, MA3, and MA6) of São Bartolomeu, and 91% were enrolled in the study. The mean per capita income for the study population was R$325 ($140) compared to a mean of R$1496 ($643) for the city of Salva-dor [29]. Municipal water was supplied to 99.9% of the homes and 67% used either a septic tank or the municipal sewer system (Table 1). Although the whole area of São Bartolomeu is less than 1 km2, the sample characteristics of MA3 were significantly different than the other MAs. A higher proportion of residents of MA3 were born outside of Salvador, had lower cover-age with adequate sanitation, and flooding was more common (Table 1). Of the current resi-dents, 22% were born outside of the metropolitan area of Salvador. The majority of immigrants were from within the state (92%) and came from a median distance of 178 km from Salvador. Immigrants were significantly older (44.1 ± 16.7) than natives (24.6 ± 15.4).
Infection and risk factors
Out of a population of 1,335, 92% (1,225) participated in the parasitologic survey. Of these 82% provided 3 stools, 10% furnished 2 stools and 8% gave 1 stool. In total, 300 (24.7%, Table 1) hadS.mansoniova on examination. Univariable analyses showed that male sex, age
group, prior infection or treatment for schistosomiasis and number of water sites visited were risk factors for current schistosome infection. Trips outside of Salvador, an adequate sewer sys-tem, low household density and reported lack of contact with surface water collections were negatively associated. The prevalence and intensity of infection withS.mansoniwas highest in
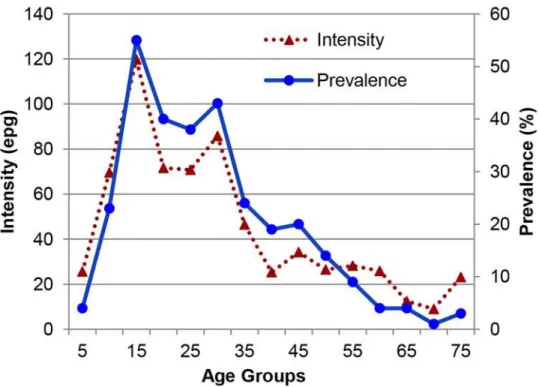
the 11–15 age group, and when compared to the 5-year-old age group, prevalence remained significantly higher in older groups up to the age of 45 (Fig. 3). In multivariable analysis, sex, household density and number of water contact sites visited remained independently associat-ed with infection, while increasing number of visits outside Salvador and immigrant status were not (Table 2).
Table 1. General characteristics of the studied population in São Bartolomeu.
Total MA1 MA3 MA6 pMA1,3,6a
Characteristic n = 1228 n = 439 n = 335 n = 447
Infection Prevalence (%) 300 (24.7) 101 (23.1) 81 (24.3) 118 (26.5) 0.51
Intensityc(SD) 60.8 (4.6) 50.3 (3.0) 69.7 (5.0) 64.9 (4.9) 0.27
Male Sex (%) 554 (45.1) 187 (42.6) 157 (46.9) 206 (46.1) 0.43
Mean Age (SD) 29.2±17.8 28.6±18.0 29.0±17.5 29.8±17.7 0.43
Birth place (%) Salvador 946 (77.6) 355 (81.2) 232 (69.3) 359 (80.3) <0.001
% Life in Salvador (SD) 90.7 (20.2) 92.1 (18.9) 87.7 (22.0) 91.6 (19.7) 0.01 Piped water (%) 1080 (92.5) 394 (94.7) 309 (92.8) 377 (90.2) 0.89 Sanitation (%) Indoor Toilet 1029 (95.9) 386 (98.7) 294 (96.4) 349 (92.6) <0.001
Septic tank/ Sewer 711 (67.2) 303 (78.9) 167 (56.2) 241 (63.9) <0.001
River/Open air 347 (32.8) 81 (21.1) 130 (43.8) 136 (36.1)
Flooding 601 (49.4) 170 (39.0) 224 (67.1) 207 (46.4) <0.001
apMA—the p-value by chi-squared analysis for the comparison of the subscripted microareas. bSignificance for 2X3 table.
cGeometric mean egg counts per gram of feces
Bold type indicates significant p values after Bonferroni correction for multiple tests.
Immigrants were considered those not born in Salvador. They were substantially older than natives (17 years on average), and had lower prevalence (18.2% vs 26.5%, p<0.01) and intensity
of infection (40.2 vs 65.7 epg) than those born in Salvador. Controlling for age and sex, the per-cent of lifetime immigrants spent in Salvador was significantly associated with infection, al-though the effect size was small (p = 0.011, OR 1.019, CI 95% 1.004–1.034).
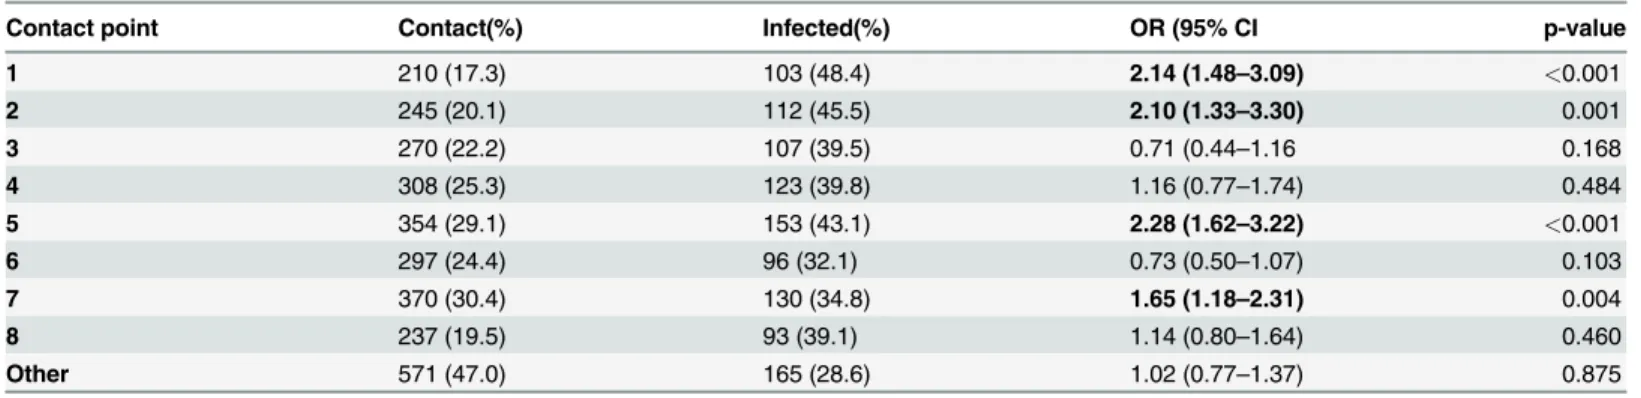
Three water contact sites were significantly associated with infection prevalence (Table 3). The OR’s were 1.91–2.15 for contact with these sites. Contact site 1 is at the outlet for the Cobre Reservoir Dam. The site is relatively shallow and is used for netting fish. Site 2 was used for crossing small streams within an area used for small-scale commercial vegetable production
Fig 3. Geometric mean intensity and prevalence ofS.mansoniinfection in 5 year intervals.Mean intensity was calculated only for those who were egg positive.
doi:10.1371/journal.pntd.0003521.g003
Table 2. Risk factors forS.mansoniegg positive stools.
Variable Total n infected (%) p value OR (95% CI)
Sex Male 554 199 (66.3) <0.001 2.47 (1.80–3.38)
Female 671 101 (33.7) -
-Persons/Bedroom>2 Yes 540 89 (23.5) 0.003 1.61 (1.17–2.21)
No 488 154 (40.0) -
-Water Contacts 0–9 1225 300 (26) <0.001 1.28 (1.20–1.37)
Age (range, median) 4–94 27 300 0.327 1.00 (0.99–1.01)
Outside Trips Last Year 0–3 1225 76 (19.0) 0.012 0.71 (0.54–1.91)
Immigrant Yes 274 50 (18) 0.389 1.22 (0.78–0.78)
No 951 250 (26) -
-Variables werefirst tested for association or correlation with infection by univariate analysis and then significant variables were used in logistic regression analysis to identify those that were independently associated. Significant p values following Bonferroni correction are in bold.
along the flood plain of the river. Contact site 5 is located at a bridge that spans the river on a road that joins MA’s 1 and 6. The bridge is a gathering point for young people as well as used for fishing. Point 7 is a vegetation-covered wetland near a soccer field. A kernel density map suggests that risk of infection increases with distance from the major avenue that borders the neighborhood (Fig. 4), although the population density and absolute number of those infected is higher near this thoroughfare.
Parasite population differentiation
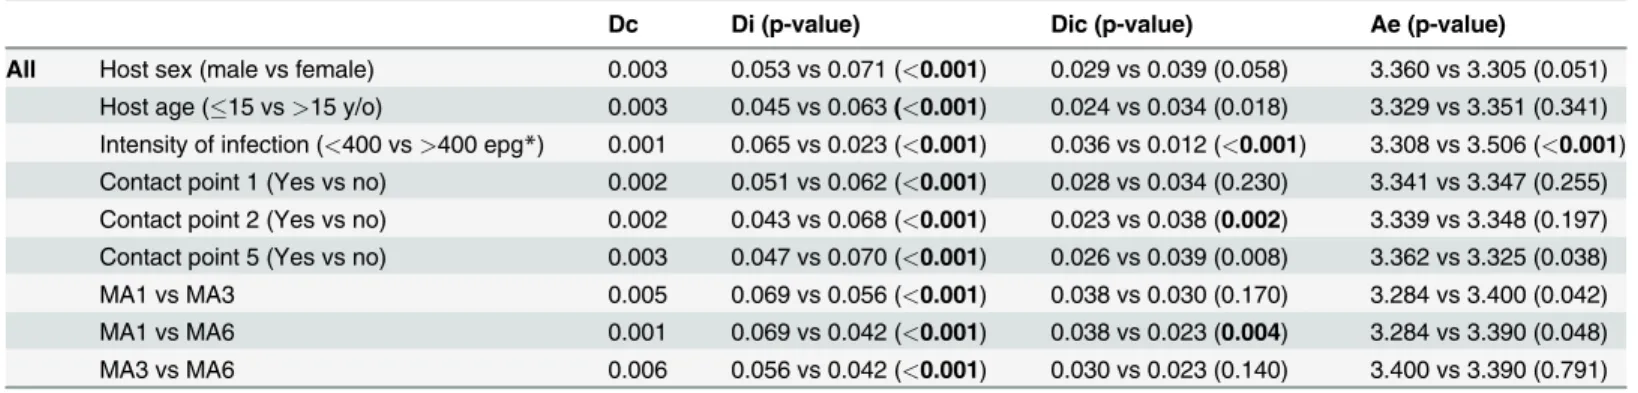
The average differentiation between replicate samples is 0.007. There was little genetic differen-tiation (Dc) between the parasite populations when stratified into component populations based on host sex, age, infection intensity or geographic location within São Bartolomeu (Table 4). Geographically, the Dc between the parasite population in São Bartolomeu and the rural area of Ubaíra Dc was 0.103. A temporal comparison was made between samples collect-ed in a 2004 pilot study from 9 infectcollect-ed children in São Bartolomeu and the current component population. The Dc for these samples was 0.007.
Di—pairwise Jost's D for all members of the group. Dic—mean Jost's D for each infrapopu-lation in the group compared to the village component popuinfrapopu-lation. Ae—mean effective allele number. Bootstrapped Student's t-test was used to compare group means for these indices. Dc—Jost's D for the component population formed by the total allele numbers for the group. Comparisons significant after Bonferroni correction are indicated in bold. Other variables test-ed but without significant differences were trips outside the region, co-infection with other hel-minths, all other water contact points, number of water contacts visited, a history of past infections. MA1, MA3, MA6—microarea divisions of São Bartolomeu. SeeFig. 1.epg
—mean count ofS.mansonieggs per gram of stool.
Within São Bartolomeu, the Di different for all comparisons. The large number of eggs makes p values less useful and confidence intervals will not overlap. The largest difference, however, is for intensity of infection greater or less than 400 epg (Table 4). The Dic was statisti-cally smaller for those more heavily infected, those visiting site 2 and for those living in MA6 compared to MA1. While there was no statistically significant difference for the mean preva-lence and intensity between these microareas, MA6 had 5 of the 10 most heavily infected indi-viduals, whereas, MA1 had only 1 of the top 10 intensities. The effective allele number (Ae) was significantly higher for those more heavily infected.
Table 3. Risk at contact points forS.mansoniinfection.
Contact point Contact(%) Infected(%) OR (95% CI p-value
1 210 (17.3) 103 (48.4) 2.14 (1.48–3.09) <0.001
2 245 (20.1) 112 (45.5) 2.10 (1.33–3.30) 0.001
3 270 (22.2) 107 (39.5) 0.71 (0.44–1.16 0.168
4 308 (25.3) 123 (39.8) 1.16 (0.77–1.74) 0.484
5 354 (29.1) 153 (43.1) 2.28 (1.62–3.22) <0.001
6 297 (24.4) 96 (32.1) 0.73 (0.50–1.07) 0.103
7 370 (30.4) 130 (34.8) 1.65 (1.18–2.31) 0.004
8 237 (19.5) 93 (39.1) 1.14 (0.80–1.64) 0.460
Other 571 (47.0) 165 (28.6) 1.02 (0.77–1.37) 0.875
1. Reservoir dam; 2. Gardens; 3. Gardens entrance; 4. Fountain Street; 5. Iron Bridge; 6. São Rafael Passageway; 7. Swamp beside soccerfield; 8. Manguete and Snake Streets
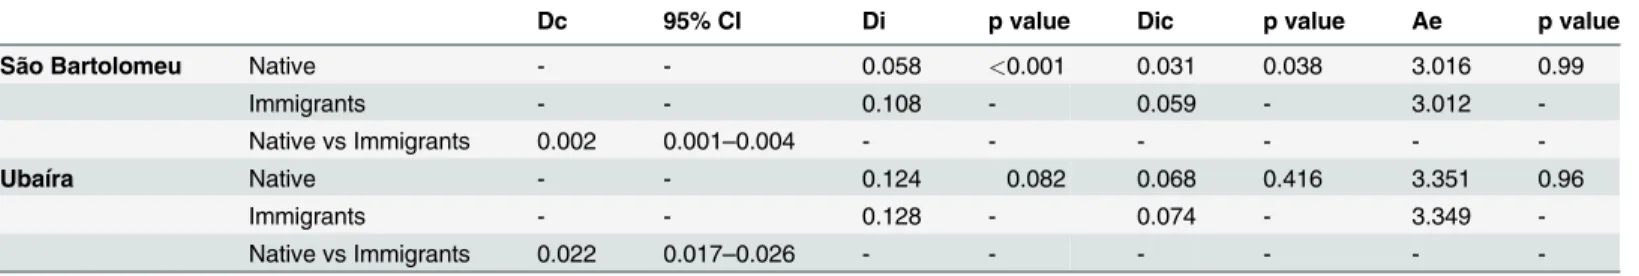
Immigrant and native parasite population structure
The Dc treats all the parasites in 2 groups of hosts as a single population. The DC in urban São Bartolomeu was very low between natives and immigrants suggesting infection from a com-mon source. In the rural area, the wider DC between natives and immigrants may indicate
Fig 4. Kernel density analysis of the prevalence ofS.mansoniinfection in São Bartolomeu.The spatial unit of reference is the home and each participant in the study was geo-referenced with their respective positive or negative parasitological result. Density analyses were generated with use of the Kernel density estimator implemented in the software ArcGIS spatial analyst extension 10.1. Density analyses were generated with bandwidth (search radius) of 50 meters. The location ofHomes, the location and number of the humanPopulation, the location and number ofInfectionsand thePrevalence density (Infections/Population) are shown.
doi:10.1371/journal.pntd.0003521.g004
Table 4.S.mansonisubpopulation differentiation and diversity.
Dc Di (p-value) Dic (p-value) Ae (p-value)
All Host sex (male vs female) 0.003 0.053 vs 0.071 (<0.001) 0.029 vs 0.039 (0.058) 3.360 vs 3.305 (0.051)
Host age (15 vs>15 y/o) 0.003 0.045 vs 0.063(<0.001) 0.024 vs 0.034 (0.018) 3.329 vs 3.351 (0.341)
Intensity of infection (<400 vs>400 epg*) 0.001 0.065 vs 0.023 (<0.001) 0.036 vs 0.012 (<0.001) 3.308 vs 3.506 (<0.001)
Contact point 1 (Yes vs no) 0.002 0.051 vs 0.062 (<0.001) 0.028 vs 0.034 (0.230) 3.341 vs 3.347 (0.255)
Contact point 2 (Yes vs no) 0.002 0.043 vs 0.068 (<0.001) 0.023 vs 0.038 (0.002) 3.339 vs 3.348 (0.197)
Contact point 5 (Yes vs no) 0.003 0.047 vs 0.070 (<0.001) 0.026 vs 0.039 (0.008) 3.362 vs 3.325 (0.038)
MA1 vs MA3 0.005 0.069 vs 0.056 (<0.001) 0.038 vs 0.030 (0.170) 3.284 vs 3.400 (0.042)
MA1 vs MA6 0.001 0.069 vs 0.042 (<0.001) 0.038 vs 0.023 (0.004) 3.284 vs 3.390 (0.048)
MA3 vs MA6 0.006 0.056 vs 0.042 (<0.001) 0.030 vs 0.023 (0.140) 3.400 vs 3.390 (0.791)
some contribution from different sources. The rural area, however, does include 2 sites separat-ed by 8 km. The Di and Dic, which represent comparisons basseparat-ed on individual infrapopula-tions, were significantly different between parasite populations of native born and immigrant residents of São Bartolomeu (Table 5), but not between those of natives compared to immigrants of the rural area. A positive correlation between the average pairwise Di and the log epg was weak but significant (r2= 0.08, p<0.01) and stronger between the Dic and log epg (r2= 0.23,
p<0.01). The Ae was lower in the urban site compared to the rural area, but did not differ
be-tween natives and immigrants for either area.
Discussion
Multiple Brazilian cities have seen outbreaks of schistosomiasis [4,6,30,31,32,33]. In some cities like Salvador, this is not so much a new introduction as it is a low level continuation of a pat-tern of infection present for some time [34,35,36]. Although Bahia is a state where schistosomi-asis is endemic, Salvador, its capital, is considered a non-endemic area. This would be a valid designation if the infection were not transmitted and only found in immigrants to the city, but this is not the case. The overall prevalence is only 2–3% [36], but it can exist in islands of trans-mission where the community-wide prevalence is>20% and even cases of hepatosplenomegaly
can be identified [15]. Given the rapid growth of the city, it is important to understand the rela-tive contributions of immigration and local transmission to the presence of the infection.
Several epidemiologic indicators suggest local transmission is a more significant driver for
S.mansoniinfection in the neighborhood of São Bartolomeu than immigration. Guimarães
et al. [15] found in 2004 that most infected children in São Bartolomeu had never left the area even for visits or vacations and also identified infected snails. In this study we extended this analysis to include all inhabitants in selected sections (microareas) of the neighborhood. Immi-grants were less likely to be infected than natives (Table 2), and infection in immiImmi-grants in-creased with increasing time spent in São Bartolomeu.
Parasite population genetic structure and history also suggest local transmission was the major source of parasites. We and others have previously observed a great diversity in rural populations of schistosomes and a degree of reproductive isolation over even short distances [18,37]. Immigrants, particularly newer immigrants, infected at distant sites would be expected to carry strains that are genetically differentiated from those transmitted at their current resi-dence. For São Bartolomeu, the overall mean pairwise Di was 0.063, which was lower than that we observed in the rural area of Ubaíra where the mean Di's were 0.097 [18]. Comparing the
Table 5. Parasite population differentiation in immigrant and native populations.
Dc 95% CI Di p value Dic p value Ae p value
São Bartolomeu Native - - 0.058 <0.001 0.031 0.038 3.016 0.99
Immigrants - - 0.108 - 0.059 - 3.012
-Native vs Immigrants 0.002 0.001–0.004 - - -
-Ubaíra Native - - 0.124 0.082 0.068 0.416 3.351 0.96
Immigrants - - 0.128 - 0.074 - 3.349
-Native vs Immigrants 0.022 0.017–0.026 - - -
-Dc—Jost's D for the component population composed of all members of the group. Di—mean pairwise Jost's D between infrapopulations for all members of the group. Dic—mean Jost's D for each infrapopulation in the group compared to the community component population. AE—mean effective allele number. CI 95% determined with 1000 bootstrap replications using the program SPADE. Student's t-test was used to compare group means for these indices.
Di for those born in Salvador with those who immigrated there (Table 5), there is a nearly 2-fold difference, but this is likely due to the immigrant’s lighter infection and not to the intro-duction of a heterogeneous population. Factors associated with an increase in the relative sam-ple size of parasite eggs tend to be associated with a relative decrease in Di and Dic. The younger age, higher prevalence and intensity for the native born in the urban area are consis-tent with having lower Di and Dic than immigrants. By contrast, immigrants to the rural area did not differ for these characteristics or for these differentiation indices. The Dc, however, in-dicates that both natives and immigrants were infected from the same pool of parasites, espe-cially in the urban area. The Dc in the rural area was higher than the mean differentiation between replicate samples (0.007) and may indicate a higher degree of introduction of parasites from a distant population or populations.
Finally, comparing the parasite population in 2004 to that in 2011, the Dc is near the repli-cate error rate. Its genetic composition has changed little in 7 years. The lack of Dc differentia-tion by age also suggests that the parasite populadifferentia-tion is stable and little influenced by
migration. The combined genetic characteristics ofS.mansoniin São Bartolomeu indicate
there is a single parasite population with no internal obstacles to gene flow and few new intro-ductions of genetically diverse parasites. It is likely that most of today’s children as well as adults became infected in São Bartolomeu, and the prevalence there is not being sustained by the arrival of people infected far from Salvador. A drawback for using pooled samples is that null alleles cannot be accounted for. This should have little effect on differentiation, since the risk of these should be equally distributed between the comparison groups.
The age distribution, prevalence of infection, association with a perennial water source and poor sanitation make transmission in the urban site similar to many rural sites in Brazil. Hav-ing more than 3 people per bedroom as a risk factor may reflect socio-economic development, although crude household income itself was not associated with infection status. The number of water contact sites regularly visited was used as a proxy for the amount of water contact. This relies on recall and could be subject to recall bias. The kind of recall is relatively coarse and was not influenced by interviewers knowing infection status. In the urban and the previ-ously studied rural area [17], increasing numbers of sites visited was associated with increasing risk for being infected.
for recreation and commercial activities. The persistence of schistosomiasis represents a failure of city services. Fortunately, our analysis indicates transmission in the city is focal and elimina-tion of these islands of infecelimina-tion should produce long-term control despite migraelimina-tion [16].
Supporting Information
S1 Dataset. Excel file is provided tabs for variable key, deidentified demographic data used in this paper and infrapopulation allele numbers.
(XLSX)
S1 Checklist. STROBE checklist.
(DOCX)
Acknowledgments
The Salvador Municipal Secretary of Health the Fiocruz-Bahia contributed materials and per-sonnel for the completion of this work.
Author Contributions
Conceived and designed the experiments: REB MGR. Performed the experiments: REB LMB EAR TMC CRAdS JMC PTA WAB MGR. Analyzed the data: REB LMB WAB LKS RBR. Con-tributed reagents/materials/analysis tools: ICG RBR. Wrote the paper: REB LMB WAB.
References
1. Amorim MN, Rabello A, Contreras RL, Katz N (1997) Epidemiological characteristics ofSchistosoma mansoniinfection in rural and urban endemic areas of Minas Gerais, Brazil. Mem Inst Oswaldo Cruz 92: 577–580. PMID:9566220
2. Barbosa CS, Araujo KC, Antunes L, Favre T, Pieri OS (2004) Spatial distribution of schistosomiasis foci on Itamaraca Island, Pernambuco, Brazil. Mem Inst Oswaldo Cruz 99: 79–83. PMID:15486640 3. Barbosa CS, Leal-Neto OB, Gomes EC, Araujo KC, Domingues AL (2011) The endemisation of
schis-tosomiasis in Porto de Galinhas, Pernambuco, Brazil, 10 years after the first epidemic outbreak. Mem Inst Oswaldo Cruz 106: 878–883. PMID:22124561
4. Firmo JO, Lima Costa MF, Guerra HL, Rocha RS (1996) Urban schistosomiasis: morbidity, sociodemo-graphic characteristics and water contact patterns predictive of infection. Int J Epidemiol 25: 1292–1300. PMID:9027538
5. Rocha RS, Silva JG, Peixoto SV, Caldeira RL, Firmo JO, et al. (2000) [Assessment of schistosomiasis and other intestinal parasitoses in school children of the Bambui municipality, Minas Gerais, Brazil]. Rev Soc Bras Med Trop 33: 431–436. PMID:11064579
6. Ximenes RA, Southgate B, Smith PG, Guimarães Neto L (2000) Migration and urban schistosomiasis.
The case of Sao Lourenco da Mata, northeast of Brazil. Rev Inst Med Trop Sao Paulo 42: 209–217. PMID:10968884
7. Victora CG, Barreto ML, do Carmo Leal M, Monteiro CA, Schmidt MI, et al. (2011) Health conditions and health-policy innovations in Brazil: the way forward. Lancet 377: 2042–2053. doi: 10.1016/S0140-6736(11)60055-XPMID:21561659
8. United States Census Bureau (2010) 2010 Census Urban and Rural Classification and Urban Area Cri-teria. Washington, DC: U.S. Department of Commerce.
9. Copque ACdSM, Souza FA, Santos DVdC, Paixão RCd. Expansão urbana e redução de áreas verdes na localidade do Cabula VI Região do miolo da cidade do Salvador, Bahia; 2011; Curitiba, PR,
Brazil. pp. 706–713.
10. Pereira JMPD (2011) [Deconcentration, migration and differentials by income strata in Bahia State] Desconcentração, migração e diferenciais por estrato de renda na Bahia. Informe Gepec pp. 546–563.
11. Pirajá da Silva MA (1909) Contribution to the study of schistosomiasis in Bahia, Brazil. Brazil J Trop Med Hyg 12: 159–164.
13. Herold MW (2004) Between Sugar and Petroleum: Bahia and Salvador, 1920–1960. Revista Espaço Acadêmico 42: Online.
14. Rocha S (1995) Metropolitan Poverty in Brazil: Economic Cycles, Labour Market and Demographic Trends. 19: 383–394.
15. Guimarães IC, Tavares-Neto J (2006) [Urban transmission of schistosomiasis in children from a neigh-borhood of Salvador, Bahia]. Rev Soc Bras Med Trop 39: 451–455. PMID:17160322
16. Souza SS, Barbosa LM, Guimarães IC, Blank WA, Reis RB, et al. (2013) Genetic population structure
of cercariae from urban foci ofSchistosoma mansoni, Brazil. Am J Trop Med Hyg 87: 843–849. 17. Barbosa LM, Silva LK, Reis EA, Azevedo TM, Costa JM, et al. (2013) Characteristics of the human host
have little influence on which localSchistosoma mansonipopulations are acquired. PLoS Negl Trop Dis 7: e2572. doi:10.1371/journal.pntd.0002572PMID:24340115
18. Blanton RE, Blank WA, Costa JM, Carmo TM, Reis EA, et al. (2011)Schistosoma mansonipopulation structure and persistence after praziquantel treatment in two villages of Bahia, Brazil. Int J Parasitol 41: 1093–1099. doi:10.1016/j.ijpara.2011.06.002PMID:21784077
19. Ausubel FM, Brent R, Kingston RE, Moore DD, Seidman JG, et al. (1987) Current protocols in molecu-lar biology. New York, NY: Green Publishing Associates and Wiley Inter-science,.
20. Blank WA, Test MR, Liu SF, Lewis FA, Blanton RE (2010) Long-term genetic stability and population dynamics of laboratory strains ofSchistosoma mansoni. J Parasitol 96: 900–907. doi: 10.1645/GE-2463.1PMID:20950096
21. Blank WA, Reis EA, Thiong'o FW, Braghiroli JF, Santos JM, et al. (2009) Analysis ofSchistosoma man-sonipopulation structure using total fecal egg sampling. J Parasitol 95: 881–889. doi: 10.1645/GE-1895.1PMID:20049994
22. Silva LK, Liu S, Blanton RE (2006) Microsatellite analysis of pooledSchistosoma mansoniDNA: an ap-proach for studies of parasite populations. Parasitology 132: 331–338. PMID:16255835
23. Hanelt B, Steinauer ML, Mwangi IN, Maina GM, Agola LE, et al. (2009) A new approach to characterize populations ofSchistosoma mansonifrom humans: development and assessment of microsatellite analysis of pooled miracidia. Trop Med Int Health 14: 322–331. doi:10.1111/j.1365-3156.2009.02226. xPMID:19187519
24. Eysker M, Bakker J, van den Berg M, van Doorn DC, Ploeger HW (2008) The use of age-clustered pooled faecal samples for monitoring worm control in horses. Vet Parasitol 151: 249–255. PMID: 18037244
25. Redman E, Packard E, Grillo V, Smith J, Jackson F, et al. (2008) Microsatellite analysis reveals marked genetic differentiation between Haemonchus contortus laboratory isolates and provides a rapid system of genetic fingerprinting. Int J Parasitol 38: 111–122. PMID:17727857
26. Taylor SM, Parobek CM, Aragam N, Ngasala BE, Martensson A, et al. (1998) Pooled deep sequencing ofPlasmodium falciparumisolates: an efficient and scalable tool to quantify prevailing malaria drug-resistance genotypes. J Infect Dis 208: 1998–2006.
27. Jost L (2008)GSTand its relatives do not measure differentiation. Molecular Ecology 17: 4015–4026. PMID:19238703
28. Kimura M, Crow JF (1964) The Number of Alleles That Can Be Maintained in a Finite Population. Ge-netics 49: 725–738. PMID:14156929
29. [Brazilian Institute of Geography and Statistitics T (2010) [Salvador demographic census 2010 sample results: Income]. Cidades: IBGE.
30. Barbosa CS, Araujo KC, Sevilla MA, Melo F, Gomes EC, et al. (2010) Current epidemiological status of schistosomiasis in the state of Pernambuco, Brazil. Mem Inst Oswaldo Cruz 105: 549–554. PMID: 20721507
31. Coura-Filho P (1997) [Schistosomiasis mansoni in urban territory. 2. A theoretical approach to the accu-mulation, concentration, and centralization of capital and the production of disease]. Cad Saude Pu-blica 13: 415–424. PMID:10886881
32. Enk MJ, Amorim A, Schall VT (2003) Acute schistosomiasis outbreak in the metropolitan area of Belo Horizonte, Minas Gerais: alert about the risk of unnoticed transmission increased by growing rural tour-ism. Mem Inst Oswaldo Cruz 98: 745–750. PMID:14595449
33. Kloos H, Correa-Oliveira R, dos Reis DC, Rodrigues EW, Monteiro LA, et al. (2010) The role of popula-tion movement in the epidemiology and control of schistosomiasis in Brazil: a preliminary typology of population movement. Mem Inst Oswaldo Cruz 105: 578–586. PMID:20721511
35. Pará M (1949) The distribution of certain diseases in Brazil as indicated by data obtained through vis-cerotorny. I. The incidence of schistosoma mansoni lesions in material collected from 1937 to 1946. Mem Inst Oswaldo Cruz 47.
36. Prado MdS Barreto ML, Strina A Faria JA, Nobre SAA, et al. (2001) [Prevalence and intensity of infec-tion by intestinal parasites in school-age children of Salvador (Bahia, Brazil)]. Rev Soc Bras Med Trop 34: 99–101. PMID:11340505
37. Curtis J, Sorensen RE, Minchella DJ (2002) Schistosome genetic diversity: the implications of popula-tion structure as detected with microsatellite markers. Parasitology 125 Suppl: S51–59. PMID: 12622328