INTRODUCTION
Aluminum titanate (Al2TiO5) is a material with high refractoriness and excellent thermal shock resistance. It presents a high melting point (over 2000 K) and anisotropic
thermal expansion coeficients [1-4]. Hence it is suitable for several applications at elevated temperatures where insulation and thermal shock resistance are required. Such as components of internal combustion engines, exhaust port liners, metallurgy, and thermal barriers. The thermal
Non isothermal kinetic study of the aluminium titanate formation in
alumina-titania mixtures
(Estudo cinético não isotérmico da formação de titanato de alumínio em
misturas de alumina com titânia)
N. M. Rendtorff1,2*, G. Suárez1,2, E. F. Aglietti1,2
1CETMIC: Centro de Tecnología de Recursos Minerales y Cerámica, Camino Centenario y 506, C.C. N° 49,
(B1897ZCA) M. B. Gonnet, Buenos Aires, Argentina
2Depto. de Química, Facultad de Ciencias Exactas, Universidad Nacional de La Plata
*corresponding author: rendtorff @cetmic.unlp.edu.ar
Abstract
Aluminum titanate (Al2TiO5) is a high refractoriness material with excellent thermal shock resistance. Hence it is suitable for several applications at elevated temperatures where insulation and thermal shock resistance are required. Such as components of internal combustion engines, exhaust port liners, metallurgy, and thermal barriers. The thermal instability of Al2TiO5 at high temperature is another characteristic of this material that has been studied and controlled by the incorporation of several additives. The Al2TiO5 formation from pure oxides presents an endothermic peak in the differential thermal analysis (DTA). The thermodynamic temperature is 1280 ºC. But experimentally, as in every other DTA experiment, these peaks strongly depend on the heating rate: this fact has been extensively employed for the kinetic study of transformation processes and the mechanism determination of chemical reactions. Both activation energies (Ea) and nucleation rates can be obtained from these experiments. The present work reports the formation Ea of Al2TiO5 prepared from pure oxides at air atmosphere by the Kissinger DTA based methods. Previously the particle size distribution of the starting powders together with X-ray diffraction analysis of the starting powders and the resulting materials was carried out. The properties of the Al2TiO5 formation were grouped into two groups corresponding to the low and high heating
rates, below and over 5 K/min. Ea values were obtained after the Avrami (n) constant evidenced that the crystallization mechanism
is strongly related to the heating rate, even in the wide range studied which includes the technological ones(0.5-40 K/min).
Keywords: DTA, kinetic, aluminum titanate.
Resumo
Titanato de alumínio (Al2TiO5) é um material de alta refratariedade com excelente resistância ao choque térmico. É, consequentemente, adequado para várias aplicações a altas temperaturas nas quais são requisitos ser isolante térmico e ter alta resistência ao choque térmico. Exemplos são como componentes de motores de combustão interna, revestimento de saídas de exaustão, barreiras metalúrgicas e térmicas. A instabilidade térmica doAl2TiO5 a altas temperaturas é outra característica deste material que tem sido estudada e controlada pela incorporação de vários aditivos. A formação de Al2TiO5 a partir de óxidos puros apresenta um pico endotérnico na curva de análise térmica diferencial (ATD). A temperatura termodinâmica é 1280 ºC. Mas experimentalmente, como em todas a análise de ATD, esses picos dependem fortemente da taxa de aquecimento: esse aspecto tem sido extensivamente empregado no estudo cinético de processos de transformação e na determinação de mecanismos de reações químicas. Energias de ativação e taxas de nucleação podem ser obtidas desses experimentos. Este trabalho reporta a energia de formação de Al2TiO5 preparado a partir de óxidos puros sob atmosfera de ar por meio dos métodos de Kissinger em ATD. Primeiramente foi analisada
a distribuição de tamanho de partículas dos pós de partida e dos pós resultantes, juntamente com análise de difração de raios X.
As propriedades de formação de Al2TiO5 foram separadas em dois grupos correpondendo a baixas e altas taxas de aquecimento, abaixo e acima de 5 K/min. Os valores de energia de ativação foram obtidos após a constante de Avrami (n) evidenciar que o mecanismo de cristalização é fortemente relacionado com a taxa de aquecimento, mesmo na ampla faixa estudada, que inclui as tecnológicas (0,5-40 K/min).
instability of the Al2TiO5 is one of its disadvantages [1-4]. Several additives have been employed that demonstrated certain eficiency for stabilizing microstructures [1]. Mullite, talc and zircon are some of the employed additives. The kinetics of the Al2TiO5 formation has been investigated iso-thermically [5, 6]. Depending on temperature and on the reaction progress, different overall kinetics reaction and microstructure evolution have been observed. The non-isothermal kinetic study has not been carried out yet.
The Al2TiO5 formation is an endothermic process that occurs at 1280 ºC [1]. Below this temperature it is unstable and dissociates spontaneously. This represents a disadvantage for this material: grain size and stabilizing phase’s incorporation have been the strategies used to overcome this tendency [5, 6].
Differential thermal analysis (DTA) has been extensively employed as a rapid and convenient instrument to study the kinetics of phase transformation processes and chemical reaction mechanisms. This method has been used to investigate crystallisation kinetics in ceramics [7-16], to determine homogeneous crystal nucleation rates and to obtain the activation energy for new phase crystallisation. The present work, reports on the determination of activation energies for the aluminium titanate (Al2TiO5) formation from pure oxides at air atmosphere.
ExpERIMENTAL pROCEDURE
Commercial starting powders were employed
(Alpha-alumina A-16SG, Alcoa Inc., USA) and TiO2(Mallinckrodt Chemical Works)), 95% anatase-5% rutile. The mean particle size (D50:) of both starting powders is around 1.0 μm.
An initial equimolar mixture was carried out in ethanol. Later the powders were dried at 110 ºC. The differential thermal analyses (DTA) together with the thermogravimetric analysis (TG) were carried out simultaneously for the sintered samples in a Netzsch 409C equipment, using different heating rates φ (from 0.5 to 40 ºC/min) up to 1450 ºC only in the heating cycle. Samples of approximately 200 ± 2 mg were analysed in a platinum crucible and dynamic air atmosphere, using pure alumina as reference material. Original and developed crystalline phases were analysed by X-ray diffraction (XRD, Philips 3020 equipment with Cu-kα radiation, Ni ilter, at 40 kV-20 mA). A preliminary crystalline phase analysis as a function of a simple sintering (program) was carried out at air atmosphere between 1200 and 1500 ºC.
Before the kinetic analysis, the DTA peak properties were studied as a function of φ. The resulting ATD peaks presented a Gaussian shape. This kind of curve peak was itted and the properties of the itted curves were compared. The obtained centroid was assumed to be the peak temperature (Tp). The reacted fraction (Xi) was estimated as a relation between the partial integer of the peak at each temperature and the peak area.
kINETIC ANALySIS
A non-isothermal method is experimentally easier than
an isothermal method, but the accuracy of the resulting Ea value is generally lower than for values determined by isothermal methods [10], for the following reasons: the crystallization peak becomes weaker and broader at slower heating rates, limiting the plotting rang of (1/Ea). Under non-isothermal conditions, DTA or DSC curves are used to obtain Ea values from peak temperature measurements at different heating rates. Although many mathematical equations have been proposed for the calculations, the Johnson-Mehl-Avrami (JMA) equation and Kissinger method [7-9] are most commonly used. It is important to emphasize that different activation energy values are associated, not only with different crystallization processes, but also with differences in the experimental conditions employed for Ea determination [9-10].
Theory and applied mathematical background
The Kissinger method, based on Equation A, is commonly used to analyze the kinetic process from DTA, DTG or DSC experiments [10-12].
ln =_RTEa + ln
p
AR
Ea
(A)
where Tp is the maximum temperature of crystallization peak, φ the applied heating rate and R is the universal gas constant. The Kissinger dependence can be used for the direct calculation of activation energy from the changes of maximum of ln (φ/Tp2) vs. temperature dependence with heating rate (Equation A). This plot should give a straight line, which yields the apparent activation energy of process (Ea). The detailed theory of the Kissinger approach is described in another publication [7].
The crystallization mechanism can be determined from the shape factor (Avrami constant) n of the endothermic peak using Equation B [9].
n=
R
2.5 W1/2
Tp2
Ea (B)
where W1/2 is the full width at half maximum of the peak (semi-breath). For lower values of n the crystallization dimension is low, for example a surface crystallization mechanism is supposed rather than volume crystallization. On the other hand, higher values of n are expected only in case of increasing nucleation rates, i.e., >2.5 in diffusion controlled reaction or > 4 in polymorphic transformation.
RESULTS AND DISCUSSION
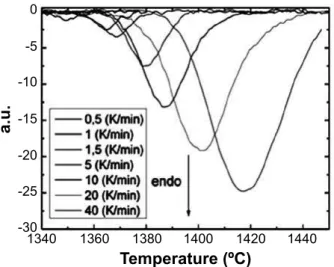
the maximum of the endothermic peak position, Tp, shifts to higher temperature from 1350 ºC to 1420 ºC, as the heating rate increases from 0.5 to 40 K/min.
Fig. 1 shows the DTA curves after subtracting the baseline. Later a Gaussian curve was itted by the minimum square procedure. With the exception of the smaller rates (0.5 -2.5 K/min), all curves presented a good itting results (this is shown in Table I). These facts show that the shape of the samples remained constant and Gaussian for the high heating rate DTA. The centre of the itted Gaussian curve was used as maximum temperature of each peak (Tp). At this moment, it is not possible to say whether the shape of the slow rate experiments is Gaussian or not. Nevertheless the centre of the itted curve was assumed as Tp. On the other hand the whole graphic was employed as peak area.
Table I shows the different properties of the evaluated peaks at different rates. Although the thermodynamical formation temperature is 1553 K [5, 6], in the present non-isothermal experiments (constant heating rate), the endothermic peak was only detected at 0.5 K/min at 1622 K. During a lower rate experiment the endothermic peak was not detected. This can be explained by the small free energy formation (driving force). The driving force of the formation is small (ΔGº Al2TiO5< 1500 J/mol) for temperatures below 1422 ºC and remains below 2500 J/mol for temperatures under 1500 ºC, temperatures commonly used to processes this kind of material [5].
In the studied conditions, the aluminium titanate formation is highly inluenced by the heating rate. The formation temperature was ~ 1700 K for the 40 K/min experiment, which is almost 150 degrees over the equilibrium temperature. In addition, TP showed a 70 degrees shift in the rate range studied. This fact encourages the application of the non-isothermal kinetic analysis carried out in the present work.
φ(K/min) Tp (ºC) Tp (K) Area Width Height
Gaussian itting result
(R2)
Formation equilibrium
temperature [5, 6] 1280 1553
-0.5 1349 1622 11.9 8.57 -1.11 0.88
1 1365 1638 28.1 9.87 -2.27 0.81
1.5 1368 1641 44.0 11.69 -3.06 0.95
2.5 1375 1648 53.7 11.34 -3.77 0.93
5 1379 1652 120.9 12.97 -7.44 0.98
10 1387 1660 282.4 17.49 -12.8 0.993
20 1402.5 1675.5 535.4 22.8 -18.73 0.991
40 1421 1694 818.9 26.18 -24.95 0.994
Table I - DTA peak properties.
[Tabela I - Propriedades do pico ATD.]
Figure 1: DTA curves, endothermic peak corresponding to the Al2TiO5 formation from pure oxides.
[Figura 1: Curvas ATD, pico endotérmico correspondente à formação de Al2TiO5 a partir de óxidos puros.]
1340
Temperature (ºC)
a.u.
0
-5
-10
-15
-20
-25
-30
1360 1380 1400 1420 1440
Figure 2: DTA peak height, width and area as a function of Tp.
[Figura 2: Altura, largura e área do pico na curva ATD.]
1000
800
600
400
200
0 1620
Temperature (K)
1650
1630 1670
1620 1640 1660 1680 1700
30
15 25
10 20
5
0
Peak width hight
Fig. 2 shows peak height, width and area. Two zones can be clearly deined as a function of Tp. This fact could be an evidence of a change in the detected mechanism. While for the low rate (0.5-2.5 K/min) the increment is small, this is more abrupt for experiments with higher heating rates (5-40 K/min).
Kinetic results
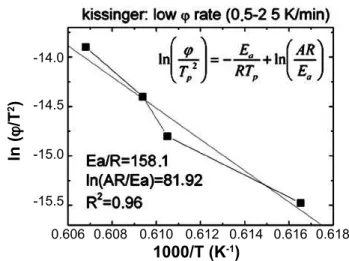
Fig. 3 shows the Kissinger plots (ln(φ/Tp2) versus T-1) in the whole φ range. The apparent activation energy values are shown in Table II. On the other side, Figs. 4 and 5, respectively show the Kissinger plots of the two heating rate ranges grouped in the previous section.
The apparent activation energies are shown in Table II. The obtained values are expectably high because the formation temperature is high (1280 ºC). It is valid to note also that the values of the enthalpy of formation of are of the same order [17-18]. In a former the isothermal kinetic study [5, 6], no activation energy was estimated, hence the present is the irst reported activation energy for this compound. The same grouping was carried out between low and high heating rate. An important difference can be observed: the activation energy at low rates is 22% higher than the ones observed at higher heating rates, showing that the activation
energy, calculated from Fig. 3, lacks representativeness. However, the other two values have a greater validity.
The aluminium titanate conversion as a function of the temperature for the different heating rates is shown in Fig. 6. In every case the sigmoidal shape can be observed, where conversion rate is low at the beginning and at the end of the process but fast in the intermediate stages. The low initial rate is explained by the time necessary for a signiicant number of particles to form nuclei of the new phase suficiently large and stable to be able to grow. During the intermediate phase, transformation is fast: nuclei, which are numerous and of suficient size, start to grow, consuming the old phase, while the new nuclei continue to form in the old phase. However, when the transformation is about to conclude, there is very little non-transformed phase nuclei that can form or grow at its expenses. This causes the new phase growth to slow down. The Kissinger theory offers the mathematical formalism to describe this kind of process [7]. The sigmoid form is evident in Fig. 6. Linear itting
Figure 4: ln(φ/Tp2) versus T-1 (Kissinger plot) of the low φ range. [Figura 4: ln(φ/Tp2) versus T-1 (gráico de Kissinger) na faixa de menores valores de φ.]
-14.0
-14.5
-15.0
-15.5
0.606
ln (
j
/T
2 )
1000/T (K-1) 0.608 0.610
Figure 3: ln(φ/Tp
2) versus T-1 (Kissinger plot). [Figura 3: ln(φ/Tp2) versus T-1 (gráico de Kissinger).]
-11
-12
-13
-14
-15
-16 0.59
Ln (
j
/T
2 p
)
1000/T (K)
0.60 0.61 0.62
0.612 0.614
Figure 5: ln(φ/Tp2) versus T-1 (Kissinger plot) of the high φ range. [Figura 5: ln(φ/Tp2) versus T-1 (gráico de Kissingert) na faixa de altos valores de φ.]
-11.0
-13.0 -10.5
-12.5 -11.5
-13.5 -12.0
ln (
j
/T
2 )
1000/T (K-1)
0.590 0.595 0.600 0.605
0.616 0.618
Method Apparent activation Kissinger energies Ea (kJ/mol)
Complete rate 0.5-40 (K/min) 1480
Low rate range 0.5-2.5 (K/min) 1313
High rate range 5-40 (K/min) 1081
Table II - Apparent activation energies (Ea).
was carried out between 10 and 90% conversion (X) in the double logarithmic plot (Fig. 7). From this, the kinetics values can be obtained by the JMA method [10]. This was carried out and the results are similar to the ones obtained by the Kissinger method, not shown in the present work.
The Avrami constant brings information about the formation mechanism, but this information is ambiguous and not clear, although some authors propose that the value corresponds to the dimensionality of the crystalline products. Several systems present non-integer values or values over 3, showing the dimensionality hypothesis is not robust [12]. However, it tends to be used to establish whether the reaction mechanism is one or more than one [12]. The Avrami constants for each heating rate, calculated with Equation B and the corresponding activation energy (Table II), are shown in Table III.
First of all, it is important to note that the n constant values obtained are not constant, showing there is not an unambiguous mechanism for the aluminium titanate formation
from oxides. In all the cases the values are between 2 and 4.8. This fact evidences an important difference in the mechanism, depending on the heating range. From the grouping performed (low and high heating rate ranges), important differences were observed as well: while for low heating rates a high (around 4) value is obtained, for the higher heating rates the value is low (between 3.3 and 2.1). Moreover, within the grouped ranges, the value of n also decreases with φ (logarithmic plot).This can be easily observed in Fig. 8.
These results are in a way concordant with the results obtained by the isothermal kinetic analysis performed by other authors [5, 6]. In these articles two reaction stages
were identiied during isothermal treatment at ~ 1580 K, when the free energy of formation is small. The initial one is characterized by the nucleation and growth of Al2TiO5 cells in a virtually unreacted Al2O3-TiO2 matrix. The concentration of nucleation sites appears to be temperature independent and it is thought to be related to residual impurities. Unreacted TiO2 also is found to provide an effective diffusion path
Figure 7: Plots of log[-ln(1-X)] versus 1/T at various heating rate (φ).
[Figura 7: Gráicos de log[-ln(1-X)] versus 1/T para várias taxas de aquecimento (φ).]
Figure 6: Converted fraction (Xi) as function of the temperature for various heating rates (φ).
[Figura 6: Fração convertida (Xi) em função da temperatura para várias taxas de aquecimento.]
100
80
60
40
20
0 1340
T (K)
X (A
i
/A
T
)(%)
1340
1340 1400 1420 1440 1460
0.4
0.2
0.0
-0.2
-0.4
-0.6
-0.8
-1.0
-1.2 0.580
1000/T (K-1)
0.5850.5900.5950.6000.6050.6100.615
log (-ln(1-x))
Figure 8: Avrami constant (n) as a function of the heating rate ( ) (log graph).
[Figura 8: Constante de Avrami (n) em função da taxa de aquecimento ( ).]
5
4
3
2
1
1
j (K/min)
n (A
vrami)
10 100
Table III - Avrami constant n for the different heating rates.
[Tabela III - Constante de Avrami para diferentes taxas de aquecimento.]
φ (K/min) n
Low heating rate Range
0.5 4.8
1 4.3
1.5 3.6
2.5 3.7
High heating rate Range
5 3.3
10 3.0
20 2.4
for the rapid transport of material during cell growth. The diffusion controlled inal reaction stage corresponds to the elimination of Al2O3 and TiO2 dispersoids trapped during the initial growth of Al2TiO5 cells.
The only conirmed conclusion in view of the non-isothermal results is that the mechanism varies with the heating rate. Perhaps more than one reaction occurs (for example consecutive) and the dependence with the heating rate of these is dissimilar and that’s why two or more ranges can be observed by this method. In the high heating rate range perhaps the irst stage is completely instantaneous and the evaluated Ea and n correspond to the second stage described by these authors, and the low heating rate range values correspond to the irst stage control. In other words, they are controlled by the nucleation and growth rates, which in turn depend on the diffusion rate of the products to the nuclei of growth, and probably these are affected by the conversion to Al2TiO5.
CONCLUSIONS
A non-isothermal kinetic study of the formation of aluminum titanate was carried out by differential thermal analysis of pure oxide mixtures of D50=1.0 μm. Although the Al2TiO5 formation temperature is 1280 °C, under the worked conditions the reaction only occurred at higher temperatures (1340-1420 °C) and at the same time. It is strongly correlated with the heating rate. In all cases, symmetrical and Gaussian peaks were found. Two zones were identiied with different behavior below and over 5 K/min from the peak properties. The formation energy Ea could be obtained by the method of Kissinger from the heating rate dependence, with consistent values. Two zones could be deined with different behavior, depending on the heating rate: below 5 K/min, the Ea value was 1313 KJ/mol, and above that value Ea is ~25% lower (1081 kJ/mol). The Avrami constant n was evaluated in the whole heating rate.These bring some information on the formation mechanisms. At least two mechanisms were found, depending on the heating rate. A high n (between 3 and 4) was calculated for low heating rates and values between 2 and 3 were found for high heating rates for the n constant.
ACkNOwLEDGMENTS
The authors want to express their gratitude to Prof. Dr. Jose Manuel Porto Lopez for his fruitful help in the inal corrections.
REFERENCES
[1] H. A. J. Thomas, R. Stevens, “Aluminium titanate - A
literature review. Part 2. Engineering properties and thermal stability”, British Ceram. Trans. J. 88, 5 (1989) 184-190. [2]
G. Bruno, A. Efremov, B. Wheaton, I. Bobrikov, V. G. Simkin, S. Misture, “Micro- and macroscopic thermal expansion of
stabilized aluminum titanate”, J. Eur. Ceram. Soc. 30, 12 (2010) 2555-2562.
[3] R. D. Skala. D. Li, I. M. Low, “Diffraction structure and phase stability studies on aluminium titanate”, J. Eur. Ceram. Soc. 29 (2009) 67-75
[4] I. J. Kim, L. G. Gauckler, “Formation, decomposition and thermal stability of Al2TiO5 ceramics”, J. Ceram. Sci. Technol. 3, 2 (2012) 49-60.
[5] B. Freudenberg. A. Mocellin, “Aluminium titanate formation by solid state reaction of Al2O3 and TiO2 single crystals”, J. Mater. Sci. 25, 8 (1990) 3701-3708.
[6] B. Freudenberg, A. Mocellin, “Aluminum titanate formation by solid-state reaction of ine Al2O3 TiO2 powders, J. Am. Ceram. Soc. 70, 1 (1987) 33-38.
[7] H. E. Kissinger, “Reaction kinetics in differential thermal analysis”, Anal. Chem. 29, 11 (1957) 1702-1706.
[8] J. A. Augis, J. E. Bennet, “Calculation of the Avrami parameters for heterogeneous solid state reactions using a modiication of the Kissinger method”, J. Therm. Anal. 13 (1978) 283-292.
[9] C. S. Ray, Q. Yang, W.-H. Huang, D. E. Day, “Surface and internal crystallization in glasses as determined by differential thermal analysis”, J. Am. Ceram. Soc. 49 (1996) 3155-3160. [10] K. Okada, Jun-ichi Kaneda, Y. Kameshima, A. Yasumori, T. Takei, “Crystallization kinetics of mullite from polymeric Al2O3-SiO2 xerogels”, Mater. Lett. 57 (2003) 3155- 3159. [11] T. Takei. Y. Kameshima. A. Yasumori, K. Okada, “Crystallization kinetics of mullite from Al2O3-SiO2 glasses under non-isothermal conditions”, J. Eur. Ceram. Soc. 21 (2001) 2487-2493.
[12] D. Prodanovic. Z. B. Zivkovic, S. Radosavljevic, “Kinetics of the dehydroxylation and mullitization processes of the halloysite from the Farbani Potok locality”, Serbia Appl. Clay. Sci. 12 (1997) 267-274.
[13] D. Prodanovic. Z.B. Zivkovic, M. Dumic, “The kinetics of dehydroxylation and mullitization of zettlitz kaolin in the presence of calcium (II) as an ingredient”, Thermochim. Acta 156 (1989) 61-67.
[14] Y. F. Chen, M. C. Wang, Min-Hsiung Hon, “Phase transformation and growth of mullite in kaolin ceramics”, J. Eur. Ceram. Soc. 24, 8 (2004) 2389-2397.
[15] P. Ptacek, F. Soukal, T. Opravil, M. Noskova, J. Havlica, J.
Brandstetr, “The kinetics of Al-Sispinel phase crystallization from calcined kaolin”, J. Solid State Chem. 183 (2010) 2565-2569
[16] M. Romero, J. Martín-Márquez, J. Ma. Rincón, “Kinetic
of mullite formation from a porcelain stoneware body for tiles production”, J. Eur. Ceram. Soc. 26, 9 (2006) 1647-1652.
[17] A. M. Segadães, M. R. Morelli, R. G. A. Kiminami,
“Combustion synthesis of aluminium titanate”, J. Eur. Ceram. Soc. 18, 7 (1998) 771-781.
[18] M. S. J. Gani, W. McPherson, “The enthalpy of formation
of aluminium titanate”, Thermochim. Acta 7, 3 (1973) 251-252.