Universidade de Aveiro
2017
Departamento de Engenharia de Materiais e Cerâmica
Kiryl
Zakharchuk
Defect chemistry of pyrochlore-type
(Gd,Ca)
2(Ti,Mo)
2O
7for prospective electrocatalytic
applications
Química de defeitos de materiais (Gd,Ca)
2(Ti,Mo)
2O
7de tipo pirocloro para aplicações electrocatalíticas
Dissertação apresentada à Universidade de Aveiro para cumprimento dos requisitos necessários à obtenção do grau de Mestre em Engenharia de Materiais, realizada sob a orientação científica do Doutor Aleksey Yaremchenko, Investigador Principal do Departamento de Engenharia de Materiais e Cerâmica da Universidade de Aveiro, e do Doutor Jorge Ribeiro Frade, Professor Catedrático do Departamento de Engenharia de Materiais e Cerâmica da Universidade de Aveiro.
o júri
Presidente Professor Doutor Joaquim Manuel Vieira
Professor Catedrático do Departamento de Engenharia de Materiais e Cerâmica da Universidade de Aveiro
Vogais Doutor Aleksey Yaremchenko
Investigador Principal do Departamento de Engenharia de Materiais e Cerâmica da Universidade de Aveiro
(Orientador)
Doutor João Carlos de Castro Abrantes
Professor Adjunto, Instituto Politécnico de Viana do Castelo
acknowledgements I would like to express my gratitude to my supervisors Dr. Aleksey Yaremchenko and Prof. Jorge Frade for teaching and for help in experimental work during the last years.
Additional many thanks to my previous supervisors Dr. E. Naumovich, Dr. A. Kavaleuski, and to my colleague from the Belarus State University - Ekaterina Kravchenko – for the collaboration.
palavras-chave Pirocloros, pilhas de combustível de eletrólito sólido, ânodo, química de defeitos, condutividade mista, condutividade protónica, expansão térmica
resumo
O principal objetivo deste trabalho foi a caracterização de soluções sólidas derivadas do pirocloro Gd2Ti2O7 com co-substituições de Gd e
Ti por Ca e Mo, respetivamente, para eventuais aplicações electrocatalíticas. O trabalho foi motivado por desvantagens dos ânodos cermetos de Ni-YSZ propostos para pilhas de combustível, designadamente degradação microestrutural, intolerância a alterações redox, contaminação com enxofre e deposição de carvão. Os pirocloros à base de Gd2Ti2O7 foram considerados adequados para o
desenvolvimento de componentes para ânodos alternativos, por co-substituições em ambas as posições catiónicas, sem degradação da estrutura do pirocloro, conferindo condução mista e atividade electrocatalítica,.
Em condições oxidantes, a gama de soluções sólidas de
(Gd1-xCax)2(Ti1-yMoy)2O7±δ com estrutura de pirocloro situa-se entre
0.10 < x < 0.15 e 0.05 < y < 0.10, sendo as amostras cerâmicas da composição (Gd1-xCax)2(Ti0.95Mo0.05)2O7±δ estáveis numa vasta gama de
pressão parcial de oxigénio, sem degradação detetável por difração de Raios-X, termogravimetria ou comportamento elétrico. Materiais à base de Gd2Ti2O7 com co-substituições possuem coeficiente de expansão
térmica linear de (10.5-10.7)×10-6 K-1 a 25-1100°C, em ar, e estabilidade dimensional com variações redox, sendo quase nula a expansão química até p(O2) ~ 10-12 atm, a 950°C.
Os mecanismos de compensação e transportadores de carga predominantes em condições oxidantes dependem da razão Ca:Mo. Co-substituição por molibdénio suprime a condutividade iónica e origina mudança de condução predominantemente iónica para eletrónica ou mista.
Observou-se aumento de condutividades iónica e eletrónica com decréscimo na pressão parcial de oxigénio, conferindo condutividade mista a cerâmicos de (Gd,Ca)2(Ti,Mo)2O7-δ em condições típicas de
operação dos ânodos. Foi desenvolvido um modelo de química de defeitos que descreve as variações de propriedades elétricas em função das condições redox e co-substituições. Além disso, relacionou-se a condutividade protónica a mais baixas temperaturas, em atmosferas húmidas, com a concentração de lacunas de oxigénio na rede do pirocloro, tendo a humidade um forte impacto na resistividade das fronteiras de grão.
keywords Pyrochlore, solid oxide fuel cell, anode, defect chemistry, mixed conductivity, ionic conductivity, protonic conductivity, thermal expansion
abstract
The main objective of the work was design and comprehensive characterization of solid solutions derived from pyrochlore-type Gd2Ti2O7
by co-substitutions of Gd and Ti by Ca and Mo, respectively, for prospective electrocatalytic applications. The work was motivated by the disadvantages of commonly used cermet Ni-YSZ cermet anodes including long-term microstructural degradation and intolerance to redox changes, sulfur poisoning and carbon deposition. Pyrochlore-type Gd2Ti2O7 was considered as a suitable parent material for the
development of alternative mixed-conducting ceramic components for SOFC anodes, while simultaneous co-substitutions of both host cations are likely to allow flexible tuning of transport and redox properties of Mo-containing pyrochlores, with impact on electrocatalytic activity, while preserving phase stability provided by pyrochlore-type titanate lattice. The range of (Gd1-xCax)2(Ti1-yMoy)2O7±δ solid solutions with cubic
pyrochlore-type structure was found to be limited to 0.10 < x < 0.15 and 0.05 < y < 0.10 under oxidizing conditions. (Gd1-xCax)2(Ti0.95Mo0.05)2O7±δ
ceramics demonstrate good phase stability in a wide range of oxygen partial pressures with no degradation or phase decomposition evidenced in the course of electrical and thermogravimetric studies and by subsequent XRD. Co-substituted Gd2Ti2O7-based ceramics possess
moderate thermal expansion coefficients compatible with solid electrolytes, (10.5-10.7)×10-6 K-1 at 25-1100°C in air, and demonstrate remarkable dimensional stability with nearly zero chemical expansion down to p(O2) ~ 10-12 atm at 950°C.
Dopant compensation mechanism and type of dominating charge carriers under oxidizing conditions is demonstrated to be strongly dependent on calcium/molybdenum ratio. Co-substitution by molybdenum suppresses ionic conduction and results in a change from dominating ionic to prevailing electronic or mixed ionic-electronic transport. Reducing oxygen partial pressure increases both ionic and n-type electronic conductivities, and (Gd,Ca)2(Ti,Mo)2O7-δ ceramics exhibit
mixed conductivity under SOFC anode operation conditions. Defect chemistry model is developed to describe variations of electrical properties in co-substituted materials. Low-temperature protonic transport in Gd2Ti2O7-based titanates in wet atmospheres was found to
correlate with concentration of oxygen vacancies in the pyrochlore lattice, with stronger impact of humidity on the grain boundary resistivity.
I
Table of contents
List of figures ... III List of tables ...V Abbreviations ...VII List of symbols ... IX
Introduction ...1
Chapter 1. State of the art and objectives ...3
1.1. Solid oxide fuel cells – an overview...3
1.2. Principles of operation ...4
1.3. Common SOFC materials and disadvantages of Ni-YSZ anodes...7
1.4. Prospective Gd2Ti2O7-based anode materials ...11
1.4.1. Overview of pyrochlore-type oxides ...11
1.4.2. Crystal structure of Gd2Ti2O7-based pyrochlores...12
1.4.3. Ca- and Mo-substituted Gd2Ti2O7...14
Chapter 2. Experimental...17
2.1. Materials preparation...17
2.2 Characterization techniques...18
Chapter 3. Results ...23
3.1. Phase relationships and structural characterization...23
3.2. Microstructural characterization...25
3.3. Reducibility and phase stability under reducing conditions ...26
3.4. Electrical conductivity in air...29
3.4.1. Total conductivity...29
3.4.2. Bulk and grain boundary contributions ...34
3.4.3. Transference numbers and ionic conductivity...35
3.5. Electrical conductivity as function of p(O2) ...38
3.6. Defect chemistry of Mo-doped (Gd,Ca)2Ti2O7±δ...42
3.7. Protonic transport in Gd2Ti2O7-based pyrochlores ...46
3.8. Thermal expansion and dimensional stability...51
Conclusions ...55
III
List of figures
Fig. 1. Scheme of hydrogen SOFC. ...5
Fig. 2. Typical fuel cell current-voltage curve [7, p. 36]. ...6
Fig. 3. Voltage and power density as function of current density of SOFC [8]. ...7
Fig. 4. Microstructure of coked Ni particles of anode [9]. ...9
Fig.5. Schematic representation of microstructural degradation of Ni/YSZ composite during oxidizing/reduction cycles [10]...10
Fig. 6. Schematic representation of agglomeration/sintering of Ni particles with time...10
Fig. 7. Stability-field map for A2B2O7 pyrochlores [12]. ...11
Fig. 8. Temperature dependence of partial oxygen-ionic (σO), electronic (σe) and protonic (σH) conductivities of La1.95Ca0.05Zr2O7-δ ceramics [13]. ...12
Fig. 9. Representation of Gd2Ti2O7 pyrochlore-type structure. Semitransparent spheres are vacant O sites (representation created in Atoms and POV-Ray software)...13
Fig. 10. Oxygen ionic conductivity of selected pyrochlores in air [15]. ...14
Fig. 11. Ionic conductivity of (Gd,Ca)2Ti2O7 at 1000°C as a function of acceptor dopant concentration [1]. ...15
Fig. 12. Flow chart of ceramic synthesis and processing. ...17
Fig. 13. Typical impedance spectrum of solid electrolyte symmetrical cell and equivalent electrical circuit (ω -current frequency, CPE – constant-phase-element) [4, p.158]. ...19
Fig. 14 Schematic drawings of the experimental setups for the modified e.m.f. technique [20]. ...21
Fig. 15. XRD patterns of as-prepared (Gd1-xCax)2(Ti1-y,Moy)2O7-δ ceramics. hkl indexes are given for Fd-3m space group. Reflections of CaMoO4 and CaTiO3 impurities are indexed according to JCPDS PDFs: CaMoO4 – # 85-1267, CaTiO3 – # 88-0790...24
Fig. 16. SEM micrographs of fractured (Gd0.975Ca0.025)2Ti2O7 (a) and (Gd0.93Ca0.07)2(Ti0.95Mo0.05)2O7 (b) after sintering in air. ...25
Fig. 17. Relative changes of oxygen nonstoichiometry in (Gd0.9Ca0.1)2(Ti0.95Mo0.05)2O7-δ on cooling in air and on heating in reducing atmosphere, and derivative thermogravimetric curve on heating in reducing atmosphere. ...26
Fig. 18. Relative changes of oxygen nonstoichiometry in (Gd1-xCax)2(Ti0.95Mo0.05)2O7-δ on isothermal reduction at 950°C, as estimated from the thermogravimetric data. ...27
Fig. 19. XRD patterns of (Gd1-xCax)2(Ti0.95Mo0.05)2O7-δ compositions sintered in air (oxidized) and reduced in powdered form under hydrogen atmosphere (36h, 950°C, pO2 ~10 -19 atm). ...29
Fig. 20. Temperature dependence of total conductivity of (Gd1-xCax)2Ti2O7-δ ceramics in dry air. ...30
Fig. 21. Temperature dependence of total conductivity of (Gd1-xCax)2(Ti1-yMoy)2O7-δ ceramics in dry air. Right plot: enlarged high-temperature region. ...30
Fig. 22. Comparison of total (bulk + grain boundary) conductivity of (Gd1-xCax)2(Ti1-yMoy)2O7-δ ceramics in high-temperature range in air. ...33
IV Fig. 23. Impedance spectra of (Gd1-xCax)2Ti2O7-δ materials at lower temperatures in air. ...34 Fig. 24. Temperature dependence of bulk conductivity of (Gd1-xCax)2(Ti1-yMoy)2O7-δ ceramics in dry
air...35 Fig. 25. Temperature dependence of partial oxygen-ionic (σO) and electronic (σe) conductivities of
(Gd1-xCax)2(Ti1-yMoy)2O7-δ ceramics estimated from the data on total conductivity in air and average transference numbers under O2/air gradient. Note that, for ((Gd0.93Ca0.07)2
(Ti0.95Mo0.05)2O7-δ, σtotal ≈ σe and σO ~10 -6
to 10-5 S/cm at 950°C. ...36 Fig. 26. Oxygen partial pressure dependence of electrical conductivity of (Gd1-xCax)2Ti2O7-δ ceramics
at 900°C. Dotted lines are guide for the eye...38 Fig. 27. Oxygen partial pressure dependence of electrical conductivity of (Gd1-xCax)2(Ti1-yMoy)2O7-δ
ceramics at 900°C. Dotted lines are guide for the eye. ...39 Fig. 28. Temperature dependence of electrical conductivity of (Gd1-xCax)2(Ti1-yMoy)2O7-δ ceramics in
10% H2–N2 atmosphere; (p(O2) ~ 3·10 -21
atm at 900°C)...42 Fig. 29. Defect chemistry diagram of (Gd0.93Ca0.07)2(Ti0.95Mo0.05)2O7-δ composition at 900°C (top) and
corresponding fitting of transport properties (bottom). Experimental data are shown by circles. The average oxygen-ion transference number tO,av corresponds to air/p(O2) gradient. ...44
Fig. 30. Defect chemistry diagram of (Gd0.90Ca0.10)2(Ti0.95Mo0.05)2O7-δ composition at 900°C (top) and corresponding fitting of transport properties (bottom). Experimental data are shown by circles. The average oxygen-ion transference number tO,av corresponds to air/p(O2) gradient. ...45
Fig. 31. Temperature dependence of electrical conductivity of (Gd1-xCax)2(Ti1-yMoy)2O7-δ in air. Dry air: p(H2O) <10-3 atm; wet air p(H2O) ~ 0.03 atm...46 Fig. 32. Impedance spectra (top) and temperature dependencies of bulk and grain boundary
conductivities (bottom) for (Gd1-xCax)2(Ti0.95Mo0.05)2O7-δ ceramics...47 Fig. 33. Impedance spectra and temperature dependencies of bulk and grain boundary conductivity as
function of temperature of (Gd0.975Ca0.025)2Ti2O7-δ ceramics. ...48 Fig. 34. Impedance spectra and temperature dependencies of bulk and grain boundary conductivity as
function of temperature of (Gd1-xCax)2Ti2O7-δ ceramics...49 Fig. 35. Relative changes of mass of (Gd1-xCax)2Ti2O7-δ ceramic samples on heating and cooling in wet
N2; p(H2O) ~ 0.015 atm. Powdered samples were preliminary calcined and cooled in dry N2...49 Fig. 36. Temperature dependence of protonic conductivity of (Gd1-xCax)2Ti2O7-δ ceramics in low
temperature range. ...50 Fig.37. Bulk conductivity of (Gd0.93Ca0.07)2Ti2O7-δ ceramics measured at 400°C in different wet and
dry atmospheres and plotted vs oxygen partial pressure (top) and vs water partial pressure
(bottom). ...51 Fig. 38. Dilatometric curves of (Gd1-xCax)2(Ti0.95Mo0.05)2O7-δ ceramics in air. ...52 Fig. 39. Relative dimensional changes of (Gd1-xCax)2(Ti0.95Mo0.05)2O7-δ ceramics on reducing oxygen
partial pressure at 950°C. Literature data on some perovskite- and fluorite-type oxides are shown for comparison. L0 corresponds to the sample length at given temperature in air. Dotted lines are guide for the eye...53
V
List of tables
Table 1. Types of Fuel Cells and their applications [6]. ...3
Table 2. Atomic coordinates and crystallographic parameters of Gd2Ti2O7 pyrochlore...13
Table 3. Capacitance values and their possible interpretation [17, 18]...20
Table 4. Unit cell parameters and densities of single-phase (Gd1-xCax)2(Ti1-y,Moy)2O7 compositions. Reducing conditions: 36h, 950°C, pO2 ~10 -19 atm...25
Table 5. Oxygen nonstoichiometry of (Gd1-xCax)2(Ti1-y,Moy)2O7-δ compositions. Reducing conditions: 36h, 950°C, pO2 ~10 -19 atm...28
Table 6. Activation energy of total conductivity (Gd1-xCax)2(Ti1-yMoy)2O7-δ in air...33
Table 7. Average oxygen-ion transference numbers of (Gd1-xCax)2 (Ti1-yMoy)2O7-δ ceramics determined by modified EMF technique.(p(O2)in Argon flow was 5·10 -5 atm; p(O2) in 10% H2–N2 flow corresponded to 2·10-20 atm at 900°C ...37
Table 8. Activation energy of total and partial ionic and electronic conductivities of...37
Table 9. Relevant defect chemistry parameters (Gd1-xCax)2(Ti1-yMoy)2O7-δ...45
VII
Abbreviations
EDS EMF JCPDS PDF MIEC Ni/YSZ PEMFC SEM SOFC TEC TGA XPS XRD YSZ/8YSZ– energy dispersive X-ray spectroscopy – electromotive force
– powder diffraction file of Joint Committee on Powder Diffraction Standards – mixed ionic-electronic conductor
– composite of metallic Ni and yttria-stabilized zirconia ceramic – proton exchange membrane fuel cells
– scanning electron microscopy – solid oxide fuel cell
– thermal expansion coefficient – thermogravimetric analysis
– X-ray photoelectron spectroscopy – X-ray diffraction
IX
List of symbols
A0 AC Cb Cgb CPE e Ea F k0 k1 kaF ke kred L n p p(H2O) pO2 R Rb Re Rgb n+ N A r S T te tH tO X Z′ Z′′ α ∆δ – pre-exponential factor – alternating current– capacitance of grains bulk – capacitance of grain boundaries – constant-phase-element
– elementary charge, 1.602·10-19C – activation energy
– Faraday constant, 9.6485 104 C·mol-1
– constant of valence changes between molybdenum cations Mo5+/ Mo4+ – constant of valence changes between molybdenum cations Mo6+/ Mo5+ – anti-Frenkel disorder constant
– constant of electronic defects formation – reduction constant
– length of sample
– concentration of electrons – concentration of holes
– partial pressure of water vapor – partial pressure of oxygen – gas constant, 8.304 J·mol−1·K−1 – resistance of grains bulk
– polarization resistance of electrode – resistance of grain boundaries
– ionic radii of cation An+ with coordination number N – cross-sectional area of sample
– temperature
– electronic transference number – protonic transference number – oxygen-ion transference number
– atomic coordinate of oxygen ion in 48f site – real part of impedance
– imaginary part of impedance – thermal expansion coefficients – change of oxygen nonstoichiometry
X µ µn µpol µV σ σe σO σpol ω Ø
– charge carriers mobility – mobility of electrons – mobility of polarons
– mobility of oxygen vacancies – conductivity
– electronic conductivity – oxygen-ionic conductivity – polaron hopping conductivity – current frequency
1
Introduction
Electrochemical devices for energy conversion, such as batteries and fuel cells, are becoming more common due to its high efficiency and lack of mechanical elements. Solid Oxide Fuel Cells (SOFC) is most prospective type of fuel cells for large scale electrical power generation. Unlike of other types of fuel cells, SOFC can operate not only with pure hydrogen but also with hydrocarbons - high operating temperature facilitates electrocatalytic decomposition of heavy organic molecules. This factor reduces the requirements for fuel quality, which is important in the case of industrial large-scale electricity production. On the other hand, high operation temperature limits application of SOFC as portable devices. Additional prospective application of high temperature electrochemical cells is electrocatalytic partial oxidation of hydrocarbons and biofuel for syngas production for subsequent use as a fuel in portable fuel cells or in chemical industry.
Up to date, commercial application of SOFC is still moderate due to limited lifetime and higher prices compared to conventional devices. The main problem is mechanical and chemical stability of components operating at high temperature. Currently used electrode materials have suitable properties for continuous operation during thousands of hours. However, heating/cooling and oxidation/reduction cycles lead to fast degradation of microstructure of multicomponent fuel cell assembly due to different thermal expansion coefficients (TEC) and chemical expansion of electrodes. Second problem is poisoning of anode with impurities in a fuel (such as sulfur) and precipitation of carbon when hydrocarbons (e.g. methane) are used as a fuel. Replacement of conventional anode, which is a composite made of metallic nickel and yttria stabilized zirconia (YSZ), by single-phase oxide material with high mixed ionic-electronic conductivity may help to overcome several problems at the same time: to enhance tolerance to sulphur, to reduce carbonization of surface and to avoid microcracking during heating/cooling cycles.
One strategy in development of advanced anode-membrane system is to use the same parent oxide material modified by doping to create prevailing ionic conductivity for membrane and mixed ionic-electronic conductivity for anode. One potential parent material is Gd2Ti2O7
with pyrochlore structure [1]. This structure contains arranged vacant oxygen sites which facilitates diffusion of oxygen. Substitution of host cations by aliovalent cations may significantly increase oxygen-ionic conductivity and, in addition, may induce electronic conductivity [2, 3]. Main criteria for selection of substituting cation are oxidation states and ionic radii. Gadolinium and titanium ions in pyrochlore structure have significantly different ionic
2
radii (Gd3+ – 1.053Å, Ti4+ – 0.605 Å) and are arranged in two sublattices. This fact allows to separate their substitution by different types of cations for fine tuning of electrochemical properties. Based on previous and values of ionic radii, calcium and molybdenum were chosen as dopants for Gd and Ti sublattices, respectively. Lower oxidation state of Ca2+ in Gd3+ sites is expected to result in formation of oxygen vacancies and improvement of ionic conductivity. Multivalent Mo-cations in Ti sites should lead to formation of conduction electrons. In a case of partial oxidation of hydrocarbons, variable oxidation states of molybdenum may improve catalytic properties: Mo6+/Mo5+ redox couple is known to facilitate oxidation of chemisorbed organic molecules [4, p.34].
The present work focused on the synthesis and characterization of (Gd,Ca)2(Ti,Mo)2O7
solid solutions: phase relationships, stability under reducing conditions, ionic and electronic transport, defect chemistry, and thermomechanical properties. Several factors turn these pyrochlores, moderately co-substituted by Ca and Mo, into possible candidates for anode components. These include mixed ionic-electronic conductivity under reducing conditions, chemical compatibility and similar thermal expansion coefficients with YSZ membranes [5], phase stability under reducing conditions. As was discovered during this work, total conductivity is rather moderate for application in SOFC, but electrocatalytic activity of molybdenum and tolerance to carbonization make it prospective for use in devices for partial oxidation of hydrocarbons and biofuel.
3
Chapter 1. State of the art and objectives
1.1. Solid oxide fuel cells
–
an overview
Fuel cells are electrochemical devices for direct electrical power generation via oxidation of fuel - hydrocarbons or hydrogen. There are many types of fuel cells based on materials with selective ionic conductivity: H+, O2-, OH-, CO32- (Table 1). Each of them has its own technical
characteristic including operating temperature, type of fuel, power range, and type of application (portable or stationary devices). General advantages of all types of fuel cells in comparison with chemical-mechanical devices for fuel/energy conversion are:
• High energy conversion efficiency (40-70%) due to direct electrical power generation. For example, conversion efficiency of a system with diesel engine and electrical generator is only about 30-40%.
• Coefficient of performance is not so much dependent on the load than that of machines based on the Carnot cycle.
• Absence of heavily loaded mechanical devices and, as a consequence, absence of the noise/vibrations.
• Tolerance to overload.
• High fuel efficiency reduces impact on environment. In case of hydrogen fuel there are no pollutant emissions, only water as exhaust.
Table 1. Types of Fuel Cells and their applications [6].
Solid oxide fuel cells can work with larger variety of fuels in contrast with other types of fuel cells since high operating temperature reduces potential barrier of hydrocarbons decomposition and oxidation. High temperature provides a number of specific advantages:
4
• High kinetic energy of molecules facilitates the decomposition and dissociation of organic substances on electrodes;
• Increased rate of surface exchange processes between membrane, electrodes and gas phase;
• Relatively cheap materials are used as electrodes instead of platinum while preserving electrocatalytic activity and stability. For instance, low temperature PEMFC can operates only with platinum catalyst on electrodes due to very low catalytic activity of alternative materials at low temperatures, and this problem is far from being solved;
• Relatively low electrode polarization under high load and high current densities due to fast gas diffusion in porous electrodes and high mobility of ions. In other words – rapid diffusion of gases and oxygen ions in membrane reduces concentration polarization and overall losses;
• No catalyst poisoning by carbon monoxide;
• Possibility of chemical co-generation: electrocatalytic conversion of hydrocarbons and biofuels via partial oxidation and reforming into low molecular weight chemicals (liquid fuels, syngas).
At the same time, high working temperature limits application areas of SOFCs: heating to operating temperature takes a lot of time and energy. It is preferable to produce stationary devices with high output power (>1kW) working in continuous mode. Generally, high costs of SOFC production and limitations of lifetime are related to:
• chemical degradation of components due to interdiffusion of cations;
• microstructural degradation under heating/cooling cycles and due to chemical expansion; • poisoning and deactivation of Ni-containing anode with sulphur;
• high cost of materials of fuel cells – membrane, electrodes, stack materials (special chromium-containing steels for interconnects);
• complexity of production of thin-layered membranes free of mechanical defects.
1.2. Principles of operation
Scheme of hydrogen SOFC with electrode reactions presented in Fig. 1. The electrodes are porous materials with mixed ionic-electronic conductivity, and membrane is usually made yttria-stabilized zirconia (YSZ) – a pure oxygen-ionic conductor. These materials should be stable under corresponding operating conditions - reducing for anode and oxidizing for cathode. The anode is usually made of zirconia-based cermet – a composite of zirconia and metallic
5
nickel (Ni/YSZ). The cathode is usually metal oxides with perovskite structure and mixed ionic-electronic conductivity, for example (La,Sr)MnO3. Operation temperature of state-of-the-art
SOFC is 800-1000°C. The ionic conductivity of yttria-stabilized zirconia is provided by oxygen vacancies: →ZrO2 ′ •• x
2 3 Zr O O
Y O 2Y +V +3O . Value of specific ionic conductivity is 0.02 - 0.1 S/cm at
operating temperatures and it is comparable to that of liquid electrolytes. Thickness of YSZ membrane can be very small – 15-50 µm to avoid ohmic loss. Interconnect materials usually are alloys chemically stable at high temperatures or ceramics with expansion coefficients close to that of YSZ to avoid mechanical stress, for instance (La,Sr)CrO3. The hermetization or sealing of
the cells is achieved using glasses or glass/ceramic composites that have transition temperature close to the operating temperature of the cell. A main problem of using glasses for sealing is the migration of silica from glasses to electrodes causing degradation in cell performance.
Fig. 1. Scheme of hydrogen SOFC.
Theoretical potential without load and with hydrogen as fuel can be calculated by Nernst equation (1). In realistic conditions, open circuit voltage is in a range 1.0-1.2V; the value may vary depending on the type of fuel and the oxygen partial pressure difference across membrane.
(1)
o
the electromotive force (or reversible open circuit voltage) standard Nernst potential at 1 atm and 25 C
the universal gas constant Faraday co 1 / 2 0 2 2 2 0 ( ) ln 2 - - R - F - cell cell cell RT pH pO E E F pH O E E ⋅ = + nstant partial pressure - i p YSZ O2- O2- Load e -e -e -e -Fuel/H2 H2O Air O2 1/2O2 + 2e → O2- Anode Cathode H2 + O → H2O + 2e -
6
Under load, the voltage of fuel cell is reduced due to overpotential. Typical current-voltage curve of fuel cells is represented on Fig. 2. The sources of overpotential are polarization effects of different nature. There are three main mechanisms of polarizations:
• Activation polarization is related to overcoming of activation energy of electrochemical reactions on electrodes. High temperature and electrocatalytic activity of electrodes reduces impact of this polarization in overall value of overpotential.
• Ohmic losses - resistivity of all components of fuel cell. Usually have linear dependence on the current in accordance with Ohm’s law.
• Concentration polarization begins to be important at high current densities due to limited rates of diffusion of gaseous reactants to the surface of porous electrodes and removal of reaction products.
Each mechanism has different impact on the total voltage drop depending on the current density, kinetics of surface exchange reactions on electrodes, catalytic activity and level of ionic-electronic conductivity of each component. Voltage drop can de calculated by equation (2).
Fig. 2. Typical fuel cell current-voltage curve [7, p. 36].
(2)
Selection of operating temperature of fuel cell is determined by the factors with opposite effects on price and performance. Increase in temperature increases the rates of diffusion of gaseous chemicals to surface, ionic conductivity of membrane, facilitates dissociation of
0 ohm act transp
0 V = E - ∆V - ∆V - ∆V V - cell voltage E - theoretical potential ∆V - polariza _ _ _ tion losses
7
chemicals and rate of surface exchange. All these lead to increase of power density. On the other hand, low operating temperature (700-800°C) requires lower amount of energy to maintain the working temperature, reduces degradation and the requirements for insulation / heat recovery of the reaction products.
Example of dependencies of voltage and power density versus current density and temperature for a real SOFC is shown on Fig. 3 (prototype of SOFC in NASA Glenn Research Center). These data clearly shows that optimum operating voltage is in a range 0.5-0.8 V near the maximum of power density; polarization effects at higher currents reduce voltage below adequate values. Combination of multiple cells in one stack with consistent electrical circuit allows producing electric power with desired voltage from single unit. Temperature range can be chosen only by taking into account many exploitation aspects, such as, stability of components, economical reasons etc. In recent years there is a tendency to reduce operating temperatures at 700-750°C and development of materials with advanced properties in this temperature range. Background of this tendency is reducing exploitation cost and degradation of components.
Fig. 3. Voltage and power density as function of current density of SOFC [8].
1.3. Common SOFC materials and disadvantages of Ni-YSZ anodes
The ceramics for high-temperature membranes with oxygen-ionic conductivity should be dense, gas-tight and high-purity to avoid electronic conductivity and internal leakage currents. The most used material for membranes is yttria-stabilized zirconia (8YSZ, 8 mol% of yttria) which is a pure oxygen-ion conductor in a wide range of oxygen partial pressure. Usually membranes have shape of thin sheets (up to 20µm) to reduce ohmic losses. Sintering of dense
8
thin sheets is a complex problem due to high sintering temperature and shrinkage. Most used technique for green body production is tape casting from slurry with following drying and sintering. Mechanical defects (cavities, cracks) cause leakages of gases and lead to inability to use. These requirements lead to comparatively high cost of production of membranes.
Electrode materials are porous ceramics with mixed ionic-electronic conductivity or cermet composites (anode) with high stability to oxidizing condition for cathode and reducing for anode. In general, development of electrode materials is the most complicated challenge in fuel cell technology due to the set of requirements. In addition to advanced electrochemical properties, electrodes must have:
• good adhesion to membrane to provide mechanical and electrical contact; • thermal expansion coefficients similar to membrane;
• tolerance to contaminations in fuel (usually sulphur) to avoid poisoning and degradation. • inertness in respect to membrane and current collectors, absence of interdiffusion of
cations between membrane-electrodes-current collectors.
Most common materials of cathode are complex oxides with perovskite structure and high mixed conductivity. Besides commonly used (La,Sr)MnO3, there is large variety of similar
perovskites on the stage of development and research. Usual problem of cathode materials is reactions with current collector and membrane with formation of inert oxides: La2Zr2O7 in case
of YSZ-membrane and chromium-containing oxides on contacts with the current collector. Usual composition of anode is porous mixture of nanosized particles of 40-50 vol% of metallic nickel with yttria-stabilized zirconia – 8YSZ = (ZrO2)0.92(Y2O3)0.08. Nickel particles
provide electronic conductivity under reducing conditions and catalytic properties, 8YSZ – oxygen-ionic conductivity. In total, composite have very good electrocatalytic activity for hydrogen oxidation and high ionic-electronic conductivity. At the same time, nickel in metal form is a cause of long-time degradation. There are several mechanisms of degradation. In the case of hydrocarbon fuels, this is the poisoning of nickel by sulphur (formation of NiS) and coking of metal particles (Fig. 4).
9
Fig. 4. Microstructure of coked Ni particles of anode [11].
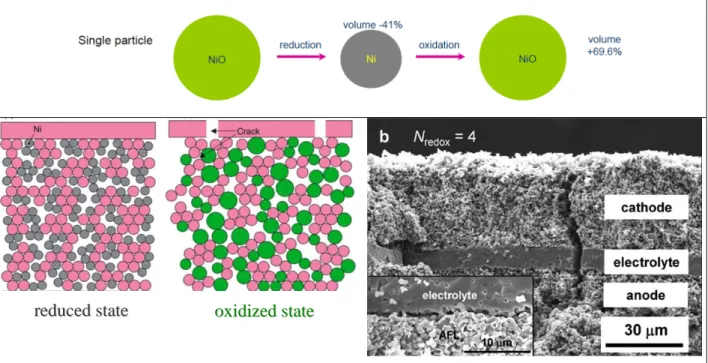
Periodic oxidation of carbon on anode looks like obvious solution of problem, but oxidizing/reduction cycles causes microstructural degradation due to large dimensional changes - oxidation of nickel particles leads to significant change in the particle size and microcraсking. As shown on Fig.5, several oxidizing/reduction cycles may leads to cracking of the entire anode-membrane-cathode assembly. This imposes restrictions on exploitation of fuel cells. Besides redox cycles, different TECs of components of electrochemical cell leads to an increase in mechanical stresses in case of stopping/starting of the fuel cell.
10
Fig.5. Schematic representation of microstructural degradation of Ni/YSZ composite during oxidizing/reduction cycles [10].
Even under constant working conditions with supply of pure hydrogen, there is mechanism of anode degradation - agglomeration and sintering of nickel particles during long operation at a high temperature (Fig. 6). This leads to a reduction in the specific area, losses of electrical connections between particles, degradation of conductivity and lowering of electrocatalitic activity.
Fig. 6. Schematic representation of agglomeration/sintering of Ni particles with time.
Currently there are several trends in development of SOFC components. First is searching for materials with high performance at lower temperature (500-800°C), which will allow reducing the operating temperature. Second is development of electrodes more stable at high temperature with tolerance to sulphur. One approach to achieve compatibility between electrode and membrane is the use of the same parent material but doped with different cations.
r
reedduucceeddssttaattee ooxxiiddiizzeeddssttaattee
11
Substitution generates different types of point defects providing ionic or mixed conductivity. One group of these parent materials can be oxides with pyrochlore-type structure, and the present work focused on doped gadolinium titanate. After substitution of host Gd/Ti cations by Ca and Mo, it potentially can be used as membrane material and as electrode material.
1.4. Prospective Gd
2Ti
2O
7-based anode materials
1.4.1. Overview of pyrochlore-type oxides
Pyrochlores are large group of complex oxides with general formula A3+2B4+2O7 with
cubic structure similar to fluorite and ordered oxygen vacancies. The possibility of formation of such structures can be described by using the concept of tolerance factor and is discussed in details in literature [11]. Oxygen vacancy concentration may differ from 1/8, and cubic structure might be distorted. Stability of pyrochlore phase depends on the ratio of ionic radii and oxidation states of A/B cations (Fig. 7). A3+ and B4+ cations have significant difference in ionic radii with approximate ratio ~1.6-1.75. The electrochemical properties of pyrochlore-type oxides at high temperature are diverse: Ln2Mo2O7 is electronic conductor; Gd2Zr2O7 and acceptor-doped
Ln2Ti2O7 are good ionic conductors. By selection of suitable cations and doping, it is possible to
create materials with specified electrical and electrochemical properties.
Fig. 7. Stability-field map for A2B2O7 pyrochlores [12].
From the point of view of practical application in SOFC, the present work focused on the materials with highest ionic and mixed conductivity. According to the literature, Gd2Ti2O7 is
12
suitable parent material for application as anode after acceptor- and donor- co-substitution to induce mixed conductivity [1,2]. Note, that pyrochlores with mixed conductivity may also have a contribution of protonic conductivity in wet atmospheres, as reported in some literature sources (Fig. 8) [13]. Impedance spectroscopy allows to detect the presence of protonic conductivity by comparison of impedance spectra measured in dry and wet gases.
Fig. 8. Temperature dependence of partial oxygen-ionic (σO), electronic (σe) and protonic (σH) conductivities of La1.95Ca0.05Zr2O7-δ ceramics [13].
1.4.2. Crystal structure of Gd
2Ti
2O
7-based pyrochlores
The unit cell of Gd2Ti2O7 can be described as a superstructure of 8 oxygen-deficient
fluorite-type unit cells with 1/8 of oxygen sites remaining vacant. Oxygen sublattice is distorted from ideal fluorite. Oxygen vacancies are arranged in an ordered structure, and oxygen sublattice forms more complicated structure, so-called superstructure. Full unit cell and simplified 1/8 part are represented on Fig. 9. Crystallographic parameters and atomic coordinates are listed in Table 2. Due to the large difference in sizes of host cations, it is possible to differentiate the doping of
13
A and B sublattices. Similarity of atomic radii was one of the criteria for choosing of cations-substituents - Ca2+ and Mo6+ have radii close to Gd3+ and Ti4+, respectively [14]:
3+ VIII Gd r = 1.053Å, 2+ VIII Ca r = 1.12Å 4+ VI Ti r = 0.605Å, 6+ VI Mo r = 0.59Å
Difference in oxidation state of dopants leads to formation of various point defects. Defect chemistry allows to predict electrical properties and phase stability, and modify it.
Gd3+ (16d) Ti4+ (16c) O2- (48f) O2- (8a)
1/8 of unit cell full unit cell
Fig. 9. Representation of Gd2Ti2O7 pyrochlore-type structure. Semitransparent spheres are vacant O sites (representation created in Atoms and POV-Ray software).
Table 2. Atomic coordinates and crystallographic parameters of Gd2Ti2O7 pyrochlore Wyckoff
positions Atomic coordinates Symmetry Gd3+ 16d 1/2, 1/2, 1/2 Ti4+ 16c 0, 0, 0 48f X, 1/8, 1/8 (X ≈ 0.3125 ― 0.375) O 2-8a 3/8, 3/8, 3/8 Vacant sites 8b 1/8, 1/8, 1/8 Fd-3m (227) a=b=c=10.2Å α=β=γ=90°
14
1.4.3. Ca- and Mo-substituted Gd
2Ti
2O
7Undoped gadolinium titanate is an n-type semiconductor and has a low level of conductivity (σtotal ~10-5 S/cm at 900°C) (Fig. 10). Doping of Gd2Ti2O7 by other elements may
alter transport properties to significant extent. Partial substitution of Gd by Ca significantly improves oxygen-ionic conductivity, and (Gd1-xCax)2Ti2O7 pyrochlores were proposed as
potential electrolyte for solid oxide fuel cells [1].
Fig. 10. Oxygen ionic conductivity of selected pyrochlores in air [15].
Acceptor-type doping by calcium leads to formation of oxygen vacancies to maintain the electroneutrality of the lattice. The reaction of substitution and formation of vacancies can be described as (using Kroger-Vink notation):
2 2 7
Gd Ti O x x ••
2 Gd Ti O O
2CaO + 2TiO →2Ca′ + 2Ti + 6O + V (3)
Electroneutrality conditions: [V ]O 0.5[CaGd]
•• = ′
Oxygen vacancies make it possible for oxygen ions to move from its positions to neighbouring vacant sites and thus to diffuse through oxygen subblattice under gradient of concentration or electrical potential. Hopping of oxygen ions between two neighbouring atomic
15
positions requires to overcome the potential energy barrier, and therefore ionic conductivity increases with increasing of temperature.
In accordance with equation (3), the increase in the concentration of the dopant (Ca2+) should increase the concentration of oxygen vacancies and, consequently, specific ionic conductivity. At low level of doping, the dependence of the ionic conductivity on the concentration can be expected to be be linear.
In general case, substitution may be continuous with formation of entire concnetrational range of solid solutions, may or reach a limit, depending on the nature of host lattice, similarity of ionic radii of dopant, and equivalence of oxidation state. In the case of gadolinium substitution by calcium, an increase in the concentration of CaGd′ eventually leads to a precipitation of secondary phase - CaTiO3. In terms of highest ionic conductivity and phase stability, the optimal
level of substitution of gadolinium by calcium in (Gd1-xCax)2Ti2O7 corresponds to the range x =
0.05–0.10 (Fig. 11).
Fig. 11. Ionic conductivity of (Gd,Ca)2Ti2O7 at 1000°C as a function of acceptor dopant concentration [1]. Further increase of calcium concentration (above 10mol%) in A3+-sublattice does not results in increase of conductivity. This can be explained by two factors: precipitation of second phase and association of defects, which reduced the mobility of ionic charge carriers:
O Gd O Gd
16
In contrast to Ca doping, molybdenum substitution results in a formation of entire continuous series of Gd2(Ti,Mo)2O7 solid solution with pyrochlore-type structure, under reducing
conditions. This is possible due to the fact that molybdenum has ionic radii very close to the radius of Ti4+ and may exist in several oxidation states: 4+, 5+, 6+. Since the most stable oxidation state of molybdenum cation under oxidizing conditions is 6+, pyrochlore-type solid solutions with high Mo-content are stable only under reducing conditions, where oxidation states of molybdenum can be 5+ and 4+. Taking into account practical requirements for phase stability of anode material in a wide oxygen partial pressure range, doping by molybdenum should be moderate. Therefore, one of the aims of present work is to find a compromise between phase stability and suitable transport properties since they have inverse dependence.
Substitution of titanium by molybdenum in Gd2Ti2O7 induces high electronic
conductivity. Total electrical conductivity increases with molybdenum content: up to 70 S/cm at 1000°C for composition Gd2(Ti0.3Mo0.7)2O7 [3] and up to ~150 S/cm for Gd2Mo2O7 at room
temperature [16]. Targeting the phase stability in wide range of pO2, the level of Mo-doping for
studies of electrical and electrochemical properties in this work was chosen in a range y=0-0.2 for (Gd,Ca)2(Ti1-yMoy)2O7.
1.5. Objectives of this works
The main objective of the work is the design and comprehensive characterization of solid solutions derived from the pyrochlore-type Gd2Ti2O7 by co-substitutions of Gd and Ti by Ca and
Mo, respectively, for prospective electrocatalytic applications. Particular objective include:
- to evaluate phase relationships in (Ga,Ca)2(Ti,Mo)2O7±δ system;
- to assess redox changes on cycling between oxidizing and reducing conditions;
- to study of ionic and electronic transport properties under variaety of p(O2)-T-humidity
conditions;
- to model defect chemistry of solid solutions based on experimental results;
- to evaluate thermomechanical stability and thermochemical compatibility with other cell materials.
17
Chapter 2. Experimental
2.1. Materials preparation
Synthesis of (Gd1-xCax)2Ti2O7 (x=0.025, 0.05, 0.07) and (Gd1-xCax)2(Ti1-y,Moy)2O7
(x=0.07, 0.10; y=0.05, 0.10) solid solutions was performed by conventional solid-state reaction route with repeated calcinations and grindings in agate mortar. Solid-state synthesis was chosen because of simplicity. Flow chart of synthesis and ceramic processing route is presented in Fig. 12. Gadolinium and titanium oxides were preliminary annealed in order to remove adsorbed moisture before weighing. Initial reagents decompose and react during several annealings with formation of pyrochlore phase. Intermediate grindings helps to achieve uniform distribution of cations. Sintering temperature of (Gd,Ca)2(Ti,Mo)2O7 ceramics was in the range 1600-1700°C.
Such a high temperature is necessary to obtain dense and gas-tight samples. Final sintering was performed with using Pt foil as support and powder cover with the same cation composition for prevention of possible high temperature losses. Heating/cooling rate was in a range 3-5°C per minute.
Fig. 12. Flow chart of ceramic synthesis and processing. Initial reagents:
• Gd2O3, 99.9%, Sigma-Aldrich;
• TiO2, 99.8%, Sigma-Aldrich;
• CaCO3, 99.95%, Sigma-Aldrich;
• (NH4)6Mo7O24·4H2O, ≥99.0%, Sigma-Aldrich.
Mixing, annealings with intermediate regrindings: 650°C/2h; 850°C/5h; 1100°C/10h; 1200°C/10h.
Ball milling with zirconia media in ethanol.
Uniaxial pressing of disk-shaped samples: Ø 15–20 mm, thickness ~2 mm.
Sintering: 1650°C, air, 10h, Pt foil support on alumina holder.
Polishing, cutting, preparation of samples from sintered ceramics: • round shaped membranes – transference numbers measurments; • bars – dilatometric and electrical measurements;
• powdered samples – XRD, TGA.
18
Density of sintered dense samples was calculated from the mass and volume of round pellets with uniform thickness. Gas-tightness test involved gluing a membrane to a tube and applying pressure in ~2 atm of air from one side. Bar-shaped samples were cut with using Struers cut-off machine and diamond wheel.
2.2 Characterization techniques
X-ray powder diffraction
The phase composition of sintered ceramics and reduced samples was analyzed by X-ray powder diffraction. Spectra were recorded with using PANalytical X'Pert PRO diffractometer
(CuKα radiation) with angular resolution 0.02° in the range 2Θ = 20-80°. Lattice parameters and theoretical density were calculated by Rietveld refinement of the diffraction spectra in FullProf software. Atomic coordinates for pure Gd2Ti2O7 were taken as initial parameters for Rietveld
refinement (Table 2). Comparison of densities, theoretically calculated and geometrically measured, allows to calculated relative density of sintered ceramics.
Microstructural analysis
Scanning electron microscopy (SEM) is a standard technique to monitor microstructure of ceramics. It allows measuring sizes and morphology of grains. Surface of samples can be prepared for SEM in several ways - it can be fractured (by breaking the sample mechanically) or polished. In present work, SEM analysis were performed only for fractured samples for control of minor phase impurities and porosity using Hitachi SU-70 microscope. Thin carbon layer was deposited in a vacuum on the surface of samples for discharge of sample surface under electron beam.
AC impedance spectroscopy
Impedance spectroscopy allows studying mechanism of electrical transport in materials and electrochemical cells. Application of external potential difference to symmetrical solid electrolyte cell do not lead to instant stabilization of electrical current and have relaxation time due to presence of electrical reactance (inductance or capacitance) of crystal lattice, dipoles, ionic chemical bonds, recharging of grain/interphase boundaries. Under AC current some part of energy is spent on recharging of reactance elements with properties of capacitor or inductor. It causes to a phase shift between current and voltage. Phase shift allows determining contribution of reactance, which represents an imaginary part in total resistivity – Z′′ on Fig. 13. Processes have different kinetics and relaxation times. It is resulting in a non-linear response of the
19
electrochemical system to applied alternating current with variation of frequency. Polarization processes can be divided into three main groups by relaxation time:
• fast processes – relaxation of ionic chemical bonds and positions of ions in crystal lattice (shifting of ions and valence electrons under potential difference);
• medium – recharging of grain boundaries;
• slow – surface exchange processes on electrodes.
Each of these three main groups of processes introduces an impact on imaginary part of impedance spectra for different region of frequency. Typical impedance spectra of symmetrical solid electrolyte cell are represented on Fig. 13. Impedance spectroscopy allows to separate contributions of each element of electrochemical system (grains, grain boundaries, and electrodes) in total resistivity since the relaxation time of each element differs by several orders of magnitude. Equivalent electrical circuit allows interpretation and fitting of spectra to find capacitance and resistance of each element.
Fig. 13. Typical impedance spectrum of solid electrolyte symmetrical cell and equivalent electrical circuit (ω -current frequency, CPE – constant-phase-element) [4, p.158].
By value of capacitance of semicircle it is possible to match it with element of electrochemical system. Typical values of capacitance and related processes are presented in Table 3. Due to overlapping of relaxation times of phenomena and capacitances of elements, semicircles may overlap each other and shape of impedance spectra became more complicated. Most complicated part is electrode processes, since kinetics of electrode processes depends on
20
microstructure of electrodes, quality of membrane-electrode interface and composition of the gas phase. Additional difficulty is that comprehensive studying of electrode processes requires low AC frequencies – below 20Hz.
Table 3. Capacitance values and their possible interpretation [17, 18] Capacitance, F/cm Phenomenon responsible
10-12 bulk
10-11 minor/second phase 10-11 – 10-8 grain boundary
10-10 – 10-9 bulk ferroelectric near TC (Curie Temperature)
10-9 – 10-7 surface layer
10-7 – 10-5 sample-electrode interface 10-4 electrochemical reactions
In present work, AC impedance spectroscopy was used for measurements of total electrical conductivity of the materials as function of temperature and oxygen partial pressure. Additional experiments in dry and wet gases were performed for assessment of contribution of proton conduction to the total conductivity. Platinum was used as electrode material and as current collectors during high-temperature measurements. The measurements were performed in controlled atmospheres: air, inert gas (Ar), O2, 10%H2-N2, and their mixtures to vary oxygen
partial pressure. Specific conductivity was calculated using the expression: L
R S σ =
⋅ (5)
R – resistance of sample (Rbulk or Rbulk+Rgrain boundary)
S – cross-sectional area of sample L – length of sample
Dry and humidified gases were used to control humidity of atmosphere. Equipment allows varying frequency of current in a range 20 – 106 Hz (Agilent 4284A precision LCR meter).
Transport numbers measurements
To separate the contributions of oxygen-ions and electrons to the total conductivity, transference numbers were determined employing modified e.m.f. technique, which is described in details in [19, 20, 21]. This technique allows measuring the transference numbers of mixed ionic-electronic conductors with relatively small electronic contribution. Scheme of experimental
21
setup represented on Fig. 14. Sample is a disk-shaped membrane with thickness ~1 mm and internal diameter ~9 mm. Platinum electrodes and contacts were applied to the sample before measurements by painting with platinum paste and annealing at 900°C. Measurements were performed under oxygen partial pressure difference across membrane: external side - air; internal volume - pure oxygen, argon or 10%H2-N2 mixture. Transference numbers were determined at
700–950°C. Modified e.m.f. technique makes it possible to take into account the effect of electrode polarization on experimentally measured values of e.m.f. by analyzing its dependence on external load [19, 20, 21]. External loads RM used for measurements were in a range hundreds
Ohms – 100 kOhm.
Fig. 14 Schematic drawings of the experimental setups for the modified e.m.f. technique [20].
Dilatometry
Thermal and chemical expansion leads to a change in the dimensions of SOFC components. It is important to know thermal expansion coefficients (TEC) of new materials for assessment of its thermomechanical compatibility with other SOFC materials. Dimensional changes of ceramic materials with variations of temperature and oxygen partial pressure were determined by controlled-atmosphere dilatometry using vertical Linseis L75V/1250 instrument.
22
Measurements were performed in atmosphere of air, argon and CO-CO2 mixtures in temperature
range between room temperature and 1100°C.
Thermogravimetric analysis
Thermogravimetry (TGA) allows to measure small variations in weight of sample caused by chemical decomposition, phase transitions and exchange processes with atmosphere. Variations in temperature and partial oxygen pressure may lead to changes in oxygen nonstoichiometry of the sample. In reducing conditions oxygen may escape from the crystal lattice in gas phase according with equilibrium × kred
O O 2
O ←→V + 2e + 0.5O•• ′ , thus affecting the weight of sample; variation in weight allows to calculate oxygen nonstoichiometry or its change. TGA data may clarify mechanisms of defect formation by comparison data of weight changes with impedance spectroscopy in the same conditions. In present work, TGA was performed using Setaram SetSys 16/18 instrument. Measurements were done in a temperature range between room temperature and 1000°C under atmosphere of air, argon or mixture of 10% H2 in
23
Chapter 3. Results
3.1. Phase relationships and structural characterization
XRD patterns of as-prepared ceramic materials are given in Fig. 15. (Gd1-xCax)2Ti2O7 (x
= 0.025-0.07) and (Gd1-xCax)2(Ti0.95Mo0.05)2O7 (x =0.07–0.10) were found to be phase-pure with
cubic pyrochlore-type structure (space group Fd-3m) isostructural to the parent Gd2Ti2O7.
Increasing molybdenum concentration in x = 0.07–0.10 compositions to 10% of titanium sites results in a minor precipitation of tetragonal CaMoO4 phase, possibly because the prevailing
oxidation state of molybdenum cations under oxidizing conditions is 6+, and the pyrochlore structure has limited ability to tolerate oxygen hyperstoichiometry. On the other hand, increasing calcium content in (Gd1-xCax)2(Ti0.95Mo0.05)2O7 above x = 0.10 was found to promote the
segregation of orthorhombic CaTiO3 phase impurity, which is a stable perovskite phase. Thus,
one may conclude that the (Gd1-xCax)2(Ti1-y,Moy)2O7-δ solid solution field at ambient p(O2) is
24
Fig. 15. XRD patterns of as-prepared (Gd1-xCax)2(Ti1-y,Moy)2O7-δ ceramics. hkl indexes are given for Fd-3m space group. Reflections of CaMoO4 and CaTiO3 impurities are indexed according to JCPDS PDFs: CaMoO4 – # 85-1267, CaTiO3 – # 88-0790.
Substitutions have rather minor influence on the lattice parameters of single-phase solid solutions (Table 4). Lattice constants increase slightly with calcium content due to the moderate differences between ionic radii of calcium and gadolinium cations ( VIII3+
Gd
r = 1.053Å vs. 2+
VIII Ca
r = 1.12
Å) [14]. Note that one neglects anti-site exchange due to major differences in ionic radii of A-site cations (Ca2+ and Gd3+) and B-site cations in their expected valence states (Ti4+ and Mo6+). Molybdenum has tendency to higher 6+ oxidation state under oxidizing conditions, with an ionic radius very similar to that of Ti4+ ( 4+
VI Ti
r = 0.605Å, 6+
VI Mo
r = 0.59Å) [14]. However, this depends on the redox conditions, and possibly also on the Mo:Ca ratio. In fact, the average valence of
25
molybdenum cations in some pyrochlores is close to Mo5+, namely, in oxynitride pyrochlores. Thus, one may expect a fraction of lower valence cations (Mo4+ or Mo5+), mainly when y > 0.5x. All prepared ceramics were dense and gas-tight; the relative densities of single-phase materials were 93–96% of theoretical (Table 4)
Table 4. Unit cell parameters and densities of single-phase (Gd1-xCax)2(Ti1-y,Moy)2O7 compositions. Reducing conditions: 36h, 950°C, pO2 ~10 -19 atm. Lattice parameters Composition State a, Å X (O2-, 48f) Density, g/cm3 Relative density, % x = 0.07, y = 0 Oxidized 10.1929(4) 0.3189(6) 6.07 96 Oxidized 10.1931(2) 0.3140(7) 5.94 93 x = 0.07, y = 0.05 Reduced 10.1933(5) 0.3166(9) - - Oxidized 10.1937(5) 0.3277(7) 6.02 95 x = 0.10, y = 0.05 Reduced 10.1941(5) 0.3150(8) - -
3.2. Microstructural characterization
SEM studies confirmed high density of sintered samples. Examples of SEM micrographs of fractured ceramics are given in Fig. 16. Other samples have similar dense microstructures with low porosity and with grains size in a range 5-20 µm. Microstructure is typical for such types of ceramics sintered at high temperatures.
Fig. 16. SEM micrographs of fractured (Gd0.975Ca0.025)2Ti2O7 (a) and (Gd0.93Ca0.07)2(Ti0.95Mo0.05)2O7 (b) after sintering in air.
10 µm b)
10 µm
26
3.3. Reducibility and phase stability under reducing conditions
Thermogravimetric analysis demonstrated that powdered (Gd1-xCax)2(Ti1-yMoy)2O7-δ
samples start to lose oxygen from the crystal lattice on heating above ~300°C in reducing 10% H2–N2 atmosphere (Fig. 17). The reduction in the studied temperature range was found to occur
in two steps. The lower-temperature process had maximum rate at ~640°C under applied experimental conditions, while the second process starts to accelerate at T > 870°C.
Fig. 17. Relative changes of oxygen nonstoichiometry in (Gd0.9Ca0.1)2(Ti0.95Mo0.05)2O7-δ on cooling in air and on heating in reducing atmosphere, and derivative thermogravimetric curve on heating in reducing atmosphere.
Isothermal studies at 950°C confirmed that reduction is a two-step process (Fig. 18). While the oxygen content in the samples remains unchanged (within experimental uncertainty) in air and in inert atmosphere, switching to reducing atmosphere results in nearly instant release of oxygen. This is followed by further slow oxygen losses from the samples.
27
Fig. 18. Relative changes of oxygen nonstoichiometry in (Gd1-xCax)2(Ti0.95Mo0.05)2O7-δ on isothermal reduction at 950°C, as estimated from the thermogravimetric data.
Oxygen losses ∆δ from the lattice of (Gd1-xCax)2(Ti0.95Mo0.05)2O7-δ in the first fast step
were roughly estimated to be ~0.051 oxygen atoms per formula unit for x = 0.07 and 0.060-0.067 atoms per formula unit for x = 0.10. Note that a decrease of oxidation state of molybdenum by 1 in the given compositions corresponds to change of oxygen content of 0.05 oxygen atoms per formula unit. Thus, one may assume that the first reduction step corresponds to comparatively fast Mo6+→ Mo5+ change, whereas the second comparatively slow step can be assigned to slower Mo5+ → Mo4+ transformation; this may raise doubts about previous indications that the intermediate oxidation state Mo5+ is highly unstable [22]. One may even assume also onset of partial Ti4+ → Ti3+ or even Mo4+ → Mo3+ reduction, on exceeding the oxygen storage ability of previous Mo6+ → Mo5+ → Mo4+ changes. Although 3+ is a rather unusual state for molybdenum in oxide compounds, the presence of Mo3+ in reduced molybdenum oxide has been previously suggested in the literature based on the XPS results [23]. The oxygen nonstoichiometry range of MoO2±δ [24, 25] also indicates the presence of a fraction
28
Table 5. Oxygen nonstoichiometry of (Gd1-xCax)2(Ti1-y,Moy)2O7-δ compositions. Reducing conditions: 36h, 950°C, pO2 ~10
-19 atm.
Composition State Oxygen nonstoichiometry, 7-δa x = 0.07, y = 0 Oxidized 6.93 Oxidized 7.03 x = 0.07, y = 0.05 Reducedb 6.94 Oxidized 7.00 x = 0.10, y = 0.05 Reducedb 6.87 a
Estimated assuming all Mo cations in oxidized phases to be in 6+ oxidation state. b
After 36h, 950°C, pO2 ~10-19 atm.
XRD analysis of powdered (Gd1-xCax)2(Ti0.95Mo0.05)2O7-δ samples after reduction in 10%
H2–N2 flow (p(O2) ~10-19 atm) at 950°C for 36 h did not reveal any significant changes in XRD
patterns (Fig. 19), except the appearance of tiny unidentified peaks on the background level. The minor increase of lattice parameters is also comparable to experimental error (Table 4). Table 5 lists also the values of oxygen nonstoichiometry of reduced pyrochlores estimated assuming that all Mo cations in oxidized phases were hexavalent. One should also note that even after 36 h of reduction the oxygen content does not tend to a constant value, indicating very slow reduction kinetics. Though this is less sluggish than reported for perovskite-like donor-doped strontium titanates at temperatures ≤1000°C, the long-term stability under applied conditions remains uncertain; the p(O2) value in the course of reduction was below the Mo/MoO2 boundary and also
29
Fig. 19. XRD patterns of (Gd1-xCax)2(Ti0.95Mo0.05)2O7-δ compositions sintered in air (oxidized) and reduced in powdered form under hydrogen atmosphere (36h, 950°C, pO2 ~10
-19 atm).
3.4. Electrical conductivity in air
3.4.1. Total conductivity
AC impedance spectroscopy was used to determine total conductivities of two series of compositions (Ca-doped and Ca&Mo co-doped) as function of temperature. Total resistivities of samples were determined as a sum of bulk and grain boundary resistances by fitting of impedance spectra. The correlation of total conductivity with the level of calcium doping in the compositions (Gd1-xCax)2Ti2O7-δ (x = 0.025, 0.05, 0.07) (Fig. 20) is in full accordance with the
literature data [1]. Acceptor doping leads to vacancy formation for charge compensation. An increase in the concentration of vacancies leads to an increase in oxygen ionic conductivity and, consequently, total conductivity. Concentration of dopant – x is equal to level of oxygen nonstoichiometry – δ in formula unit.
30
Fig. 20. Temperature dependence of total conductivity of (Gd1-xCax)2Ti2O7-δ ceramics in dry air.
Fig. 21. Temperature dependence of total conductivity of (Gd1-xCax)2(Ti1-yMoy)2O7-δ ceramics in dry air. Right plot: enlarged high-temperature region.
Substitution of 5% of titanium by molybdenum results in suppression of ionic transport in (Gd1-xCax)2(Ti0.95Mo0.05)2O7-δ and a significant drop in electrical conductivity (Fig. 21). This
phenomenon can be explained by taking into account charge compensation for acceptor and x = 0.10
x = 0.07
(Gd0.93Ca0.07)2Ti2O7-δ
![Table 1. Types of Fuel Cells and their applications [6].](https://thumb-eu.123doks.com/thumbv2/123dok_br/16059047.1105872/25.892.97.795.789.1029/table-types-fuel-cells-applications.webp)

![Fig. 2. Typical fuel cell current-voltage curve [7, p. 36].](https://thumb-eu.123doks.com/thumbv2/123dok_br/16059047.1105872/28.892.149.759.570.930/fig-typical-fuel-cell-current-voltage-curve-p.webp)
![Fig. 3. Voltage and power density as function of current density of SOFC [8].](https://thumb-eu.123doks.com/thumbv2/123dok_br/16059047.1105872/29.892.248.657.564.881/fig-voltage-power-density-function-current-density-sofc.webp)
![Fig. 7. Stability-field map for A 2 B 2 O 7 pyrochlores [12].](https://thumb-eu.123doks.com/thumbv2/123dok_br/16059047.1105872/33.892.248.643.695.1034/fig-stability-field-map-b-o-pyrochlores.webp)
![Fig. 8. Temperature dependence of partial oxygen-ionic (σ O ), electronic (σ e ) and protonic (σ H ) conductivities of La 1.95 Ca 0.05 Zr 2 O 7-δ ceramics [13]](https://thumb-eu.123doks.com/thumbv2/123dok_br/16059047.1105872/34.892.235.657.263.785/temperature-dependence-partial-oxygen-electronic-protonic-conductivities-ceramics.webp)

![Fig. 10. Oxygen ionic conductivity of selected pyrochlores in air [15].](https://thumb-eu.123doks.com/thumbv2/123dok_br/16059047.1105872/36.892.217.678.319.767/fig-oxygen-ionic-conductivity-selected-pyrochlores-air.webp)
![Fig. 11. Ionic conductivity of (Gd,Ca) 2 Ti 2 O 7 at 1000°C as a function of acceptor dopant concentration [1]](https://thumb-eu.123doks.com/thumbv2/123dok_br/16059047.1105872/37.892.247.656.538.924/fig-ionic-conductivity-gd-function-acceptor-dopant-concentration.webp)