doi:10.3168/jds.2007-0057
© American Dairy Science Association, 2008.
A Study of Lusitano Mare Lactation Curve with Wood’s Model
A. S. Santos*†1and A. M. Silvestre*
*Centre of Studies on Veterinary and Animal Sciences, Department of Animal Science, Apartado 5001-909, Vila Real, Portugal †University School Vasco da Gama, Department of Veterinary Medicine, Castelo Viegas, Portugal
ABSTRACT
Milk yield and composition data from 7 nursing Lusi-tano mares (450 to 580 kg of body weight and 2 to 9 parities) were used in this study (5 measurements per mare for milk yield and 8 measurements for composi-tion). Wood’s lactation model was used to describe milk fat, protein, and lactose lactation curves. Mean values for the concentration of major milk components across the lactation period (180 d) were 5.9 g/kg of fat, 18.4 g/ kg of protein, and 60.8 g/kg of lactose. Milk fat and protein (g/kg) decreased and lactose (g/kg) increased during the 180 d of lactation. Curves for milk protein and lactose yields (g) were similar in shape to the milk yield curve; protein yield peaked at 307 g on d 10 and lactose peaked at 816 g on d 45. The fat (g) curve was different in shape compared with milk, protein, and lactose yields. Total production of the major milk con-stituents throughout the 180 d of lactation was esti-mated to be 12.0, 36.1, and 124 kg for fat, protein, and lactose, respectively. The algebraic model fitted by a nonlinear regression procedure to the data resulted in reasonable prediction curves for milk yield (R2aof 0.89)
and the major constituents (R2
a ranged from 0.89 to
0.95). The lactation curves of major milk constituents in Lusitano mares were similar, both in shape and val-ues, to those found in other horse breeds. The estab-lished curves facilitate the estimation of milk yield and variation of milk constituents at different stages of lac-tation for both nursing and dairy mares, providing im-portant information relative to weaning time and foal supplementation.
Key words: mare, milk composition, lactation, Wood’s model
INTRODUCTION
The Lusitano horse plays an important role in equine production in Portugal. According to the Portuguese
Received January 26, 2007. Accepted October 12, 2007.
1Corresponding author: [email protected]
760
Lusitano breed association, there are about 11,000 Lus-itanos worldwide, with production being mainly located in Portugal (320 breeders) and Brazil (Fradinho, 2002). With a production system based on high-forage diets, the young foals depend almost exclusively and for an extended period on their mother’s milk.
A better understanding of the nutrient requirements for both mare and foal requires the knowledge of mare’s milk yield and composition. Information on milk compo-sition for the Lusitano breed is presented by Santos et al. (2005); the same study also indicates daily milk yields. Although information on daily milk yields and milk composition is extensive (Doreau and Boulot, 1989b), the information regarding milk yield in nursing mares is scarce, probably due to methodology limita-tions (Doreau and Boulot, 1989a).
The lactation curve is a graphical representation of the daily milk yield and can be described by mathemati-cal models. It is characterized by its smathemati-cale (initial and peak yields) and shape (day of peak yield and persis-tency; Gipson and Grossman, 1990). Various mathe-matical models have been used to describe the lactation curve. Linear regressions for representing milk yield in mares have been used (Gibbs et al., 1982). The use of nonlinear models such as Wood’s model (Wood, 1967) in dairy cows is common (Macciotta et al., 2005; Silves-tre et al., 2006). Wood’s model has been applied to the mare lactation curve (Doreau and Martuzzi, 2006a) and specifically to the Lusitano breed (Santos and Silvestre, 2006), but Wood’s model parameters for the major con-stituents of mare’s milk have never been published. The aim of this work was to model the lactation curve for milk yield and milk composition (protein, lactose, and fat) in Lusitano mares using Wood’s model.
MATERIALS AND METHODS
Animals
Data for this study were collected from 7 multiparous nursing Lusitano mares aged 7 to 12 yr, with an average BW after foaling of 472.1± 36 kg. These mares belonged to the Polytechnic Institute, Coimbra, Portugal, and were kept under normal breeding conditions for the Lusitano breed. They were allowed access to pasture
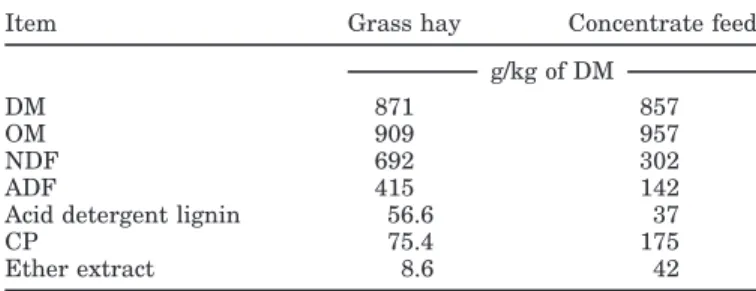
Table 1. Nutritive value of grass hay and commercial concentrate
offered to mares during the study period
Item Grass hay Concentrate feed
g/kg of DM
DM 871 857
OM 909 957
NDF 692 302
ADF 415 142
Acid detergent lignin 56.6 37
CP 75.4 175
Ether extract 8.6 42
(17.4% CP) between 0900 and 1800 h (except on milk collecting days, when they stayed indoors until after milk collection) and kept indoors during the rest of the time. Each pair (mare and foal) was fed twice a day, before and after the grazing period, with 3 kg of grass hay and 2 kg of commercial concentrate feed. Nutritive value of feeds offered is presented in Table 1.
Milk Collection and Analyses
Milk yield was evaluated on d 15, 45, 60, 90, and 120 postpartum, and milk composition was analyzed on d 15, 30, 45, 60, 75, 90, 105, and 120 postpartum. The milk sampling procedure was the same for each mare and collection date. Procedures for milk collection were as follows. The mare and foal were separated for 1 h (from 1300 to 1400 h). The mare and foal were able to see, touch, and smell each other, but the foal was not able to suckle. Then, 1.0 mL of an oxytocin solution (20 IU/mL, Ocitocina Sint., Novartis Laboratories, Portu-gal) was administered to the mare, followed by hand-milking of the 2 teats as deeply as possible in the pres-ence of the foal. The foal was left to suckle, and because the efforts of the foal were unsuccessful, the udder was assumed to be empty. The milk collected was then given to the foal. A second separation of the mare and foal occurred within 40 to 50 min. Oxytocin was again ad-ministered to the mare as before and the mare was handmilked. The amount of milk collected was mea-sured and a 200-mL sample was withdrawn. The re-maining milk was offered to the foal. Each 200-mL milk sample was frozen for later analysis for protein, fat, and lactose.
Samples were then prepared for chemical analyses according to current procedures of AOAC (1990). Fat was measured by the Gerber method, protein determi-nation was made according to Kjeldahl-N, and lactose was measured by infrared spectrophotometry on a Milkoscan (Foss, Hillerød, Denmark) analyzer. Goat milk was used for calibration of the infrared spectropho-tometer. Correction factors for mare’s milk were then
calculated by analyzing mare milk samples for lactose (enzymatic method; Kleyn, 1985).
Model Fit
Average daily milk yield and composition (protein, fat, and lactose) were used to test the Wood’s model fit (Wood, 1967):
Yt= a tbe−c t [1]
where Ytis the milk parameter on lactation day t, e is the Neper number, and a, b, and c are positive parame-ters that determine the curve’s shape.
Wood’s model represents the peak in lactation day t = b/c, which means that b and c are parameters that define the prepeak and postpeak of the curve, respec-tively. Peak values are independent of a, which repre-sents a scale factor. Persistency (s) in Wood’s model is a dimensionless quantity. However, it can be used for comparison of curves (Cobby and Le Du, 1978; Rekik et al., 2003):
s =−(b + 1) ln c [2]
For the adjustment of the model [1] to average daily values, the nonlinear module of the Systat program (Wilkinson et al., 1992) was used. This module applies the quasi-Newton method, and the convergence crite-rion has a precision of 5× 10⁻⁵. Total yields were esti-mated with a numeric integration process.
RESULTS
Milk Yield and Milk Composition
Average values of daily milk yield are presented in kilograms and kilograms/100 kilograms of BW in Table 2. Average daily milk yield was 12.4± 0.3 kg, represent-ing an average of 2.6 ± 0.06 kg/100 kg of BW, with a minimum yield of 10.7 kg (2.3 kg/100 kg of BW) and a maximum yield of 14.2 kg (3.0 kg/100 kg of BW). Daily results for the analyzed constituents (fat, protein, and lactose) given in grams per kilogram and grams are also presented in Table 2. The fat content averaged 5.9 ± 0.40 g/kg, with minimum and maximum values of 3.10 and 10.5 g/kg, respectively. Average daily fat yield was 75± 5.09 g, with minimum and maximum yields of 35 and 139 g, respectively. Milk protein content ranged from 14.9 to 22.7 g/kg with an average of 18.4± 0.4 g/ kg. The average of daily protein yield was 232 ± 5 g and ranged from 152 to 307 g. Lactose content ranged from 54.5 to 65.5 g/kg, with an average value of 60.8± 0.8 g/kg. Lactose daily yield averaged 755 ± 9 g, with
Table 2. Summary statistics of daily mare milk yield and composition across 120 d of lactation1
Item n Mean ± SD CV2(%) Minimum Maximum
Milk yield (kg) 35 12.4 ± 0.3 14.2 10.7 14.2 Milk yield (kg/100 kg of BW) 35 2.6 ± 0.1 15.4 2.3 3.0 Fat, g/kg 48 5.9 ± 0.4 47.6 3.1 10.5 Protein, g/kg 48 18.4 ± 0.4 15.2 14.9 22.7 Lactose, g/kg 48 60.8 ± 0.8 8.5 54.5 65.5 Fat, g 48 74.8 ± 5.1 47.2 34.9 138.6 Protein, g 48 231.8 ± 5.1 15.2 152.3 307.1 Lactose, g 48 755.4 ± 9.1 8.4 651.4 825.9
1Milk yield samples were taken from lactation d 15, 45, 60, 90, and 120 (n = 7 mares); fat, protein, and
lactose samples were taken at 15-d intervals from lactation d 15 to 120 (n = 6 mares).
2CV = coeffficient of variation.
minimum and maximum yields of 651 and 826 g. Fat content and yield showed the greatest coefficients of variation (47.6 and 47.2%, respectively), and lactose had the lowest variation coefficient (8.5 and 8.4% for content and yield, respectively). Protein (content and yield) and milk yield showed intermediate coefficients of variation (between 14.2 and 15.2%).
Model Fit
The prediction curves for milk yield and milk constit-uents are shown in Figures 1 and 2. We used a lactation length of 180 d because weaning in the Lusitano breed occurs around 6 mo (180 d). The estimated parameters for the model and the corresponding R2a are given in
Table 3. The model fitted the data with an R2a value
Figure 1. Lactation curves for milk yield (kg) and milk constituents (g/kg). Average daily yields from 7 mares (䊉).
>0.89. By applying Wood’s model, the milk production peak occurred on d 31 of lactation, and milk yield peaked at 14 kg/d. The estimate for total milk yield for the 180-d lactation was 2,020 kg. Concerning milk composition, the model showed that fat and protein (g/ kg) tended to decrease during lactation, whereas lactose (g/kg) increased (Figure 1). Fat yield decreased during lactation but protein and lactose yield followed the milk yield lactation curve (Figure 2). Estimated protein peak occurred on d 10 (307 g) and estimated lactose peak occurred on d 45 (816 g). Total yields of fat, protein, and lactose during the 180 d of lactation were estimated to be 12, 36, and 124 kg, respectively (Table 3). Persis-tency (s) values are shown in Table 2. Milk yield had an s value of 6.2, and protein and lactose yields had s values of 5.2 and 6.4, respectively.
Figure 2. Lactation curves for fat, protein, and lactose yields (g). Average daily yields from 6 mares (䊉).
DISCUSSION
Milk Yield and Milk Composition
Daily milk yields presented in this study (12.4 kg, 2.6 kg/100 kg of BW) were comparable to the majority of published data. Doreau and Boulot (1989b) presented values for nursing mares that range from 2 and 3.5 kg/ 100 kg of BW for heavy or saddle mares. The NRC (1989) estimated that average daily production for sad-dle mares is 2 to 3 kg/100 kg of BW. Pinto et al. (2001) reported milk yields between 2.5 and 3.0 kg/100 kg of BW for Murguese and Rir Pesante Rapido breeds dur-ing 6 mo of lactation.
Fat concentrations were low as noted in a study by Doreau and Boulot (1989b). The average fat content (5.9 g/kg) was lower than the values of 12.5 g/kg for
Table 3. Estimated Wood’s model parameters (a, b, c), peak (day and yield), total yield at 180 d, persistency,
and adjusted coefficient of determination (R2
a) for daily milk yield and composition for 180 d of lactation
Peak
Item R2
a a b c1 Day Yield Total yield Persistency
Milk yield, kg 0.89 8.48 0.1999 0.6397 31 14.0 2,019.6 6.06 Fat, g/kg 0.91 33.58 −0.4285 0.1272 — — — — Protein, g/kg 0.89 31.81 −0.1105 0.1703 — — — — Lactose, g/kg 0.90 39.38 0.1180 0.0606 — 65.21 — — Fat, g 0.94 307.80 −0.2617 0.6775 — — 11,995.7 — Protein, g 0.95 277.76 0.0783 0.7867 10 307.46 36,134.6 5.22 Lactose, g 0.93 338.91 0.3119 0.6859 45 816.13 123,632.1 6.54 1c = c× 10−2.
Haflinger, Boulonnais, and Breton mares (Csapo´ et al., 1995). According to Ku¨ cu¨ kcetin et al. (2003), the fat content of Frisian mares is 10 g/kg. Values obtained using the Gerber method can provide slightly lower results compared with turbidimetric methods (Doreau et al., 1985); nevertheless, we were not able to use an-other reference method. Doreau et al. (1985) note that both the Gerber and Kjeldahl-N methods give compara-ble results for mare milk. Average protein content (18.4 g/kg) was lower than the average of 20 g/kg reported by Oftedal et al. (1983) for Thoroughbred and Standard-bred mares and greater than that (16 g/kg) reported by Ku¨ cu¨ kcetin et al. (2003). The average lactose content (60.8 g/kg) was slightly lower than values (66.0 g/kg) reported by Pagan and Hintz (1986) in pony mares. Smolders et al. (1990) reported an average lactose con-tent of 62 g/kg, in light mares.
Model Fit
By applying Wood’s model, peak lactation was reached at d 31 of lactation. Gibbs et al. (1982) observed a maximum yield during the first month using the weigh-suckle-weigh method (values for average daily yields). Other measurements performed by using the isotope dilution method (Oftedal et al., 1983; Doreau et al., 1990) showed an increase in milk yield until 2 mo, but these measurements were not carried out later due to methodological restrictions. Doreau and Mar-tuzzi (2006a), in their review, applied Wood’s model to literature data and reported that peak lactation for saddle mares occurred on d 50. Estimated milk yield at peak of lactation was 14.0 kg/d (3.0 kg/100 kg of BW). These values agree with data reported by NRC (1989) and with results obtained for other light breeds such as Thoroughbred, French saddle, and Anglo-Arab (Oftedal et al., 1983; Doreau et al., 1993) when hand-milking with oxytocin, and for Quarterhorse mares (Gibbs et al., 1982) using the weigh-suckle-weigh method. In spite of the discrepancy in locating the peak of lactation, results shown in this study seem adequate when compared with literature values. Methodologies for estimating milk yield for nursing mares include milking with or without oxytocin administration, the weigh-suckle-weigh method, and the isotope dilution method. The use of Wood’s model to estimate and de-scribe the lactation curve of nursing mares provides results similar to data obtained with these methodolo-gies. According to the results obtained in our study, lactation peak is reached at the end of the first month of lactation
Estimated persistency (s values) for milk yield was 6.1, which reflects the decrease in milk yield after the peak is reached; the greater the value of s, the less the decrease in milk yield observed in that lactation. However, the value per se does not indicate a percent-age of milk yield decrease or any other unit. According to peak yield (14.2 kg) and estimated yield at d 180 (7.6 kg), estimated persistency is 91% per mo, which is similar to persistency of 95% per mo estimated by Gibbs et al. (1982) for Quarterhorse mares using the weigh-suckle-weigh method.
The estimate of total milk yield at 180 d was 2,019.6 kg. Yields of 1,400 to 2,200 kg in 150 d (weigh-suckle-weigh) for saddle breeds are reported in a review made by Doreau and Boulot (1989b). The same authors pres-ent slightly greater yield values for dairy mares re-corded by mechanical milking (from 2,060 to 2,100 kg in 180 d). Therefore, estimates of total yield at 180 d of lactation shown in this study with the application of Wood’s model seem suitable when compared with that of nursing and dairy mares reported in the literature.
The shape of lactation curves obtained for fat, protein, and lactose is different for concentration (g/kg) and total yields (kg). Fat and protein concentration curves (Fig-ure 1) are similar in shape, showing a continuously decreasing curve during the lactation period. This shape is similar to that reported by others (Doreau and Martuzzi, 2006a,b). Different shapes were found for dairy cattle (Stanton et al., 1992). The large decrease shown in the fat and protein curves in the first days of lactation probably reflects the passage from colostrum to milk, and the continuing decrease of these contents until 30 to 60 d of lactation is likely a dilution effect because of the increase in milk production. Martin-Ros-set and Younge (2006) indicate that, during the first 2 mo of age, foal growth is closely related to milk intake and, therefore, to milk yield and contents. In a study by Doreau et al. (1986), lactose and energy intake by the suckling foal increased daily, whereas fat intake decreased and protein intake remained constant during the first 8 wk of lactation. In the current study, the lactose curve (Figure 1) showed a different shape with a continuous increase during the lactation period, which agrees with other authors (Mariani et al., 2001).
Lactation curves presented in Figure 2 are similar in shape for total protein and lactose yields, both of which are similar to the milk yield curve. The estimated s value for lactose is greater (near milk yield) than the estimated s value for protein, which is probably because of the increase of lactose (g/kg) during the estimation period and the similarity in shape with the milk curve (g).
The goodness of fit for all curves was relatively high; R2aranged from 0.89 to 0.95. According to Macciotta et
al. (2005), goodness of fit is high when R2ais>0.8.
The application of Wood’s model to dairy data is com-mon in cattle (Rekik et al., 2003; Macciotta et al., 2005; Silvestre et al., 2006) and it has been applied to lacta-tion data in llamas (Riek and Gerken, 2006), rabbit does (Casado et al., 2006), and red deer (Garcı´a et al., 1999). Application of Wood’s model to milk data of mares was published by Santos and Silvestre (2006) and Doreau and Martuzzi (2006a,b). However, none of those studies presents estimates of Wood’s model parameters for mare’s milk constituents. To better esti-mate the shape of all curves (milk yield, fat, protein, and lactose) of Lusitano mares using this model, it would be desirable to have more data, namely more animals and milk samples before d 15 and after d 120 of lactation. Nevertheless, longitudinal modulation of the lactation curve allows extrapolation to estimate the beginning and end of the lactation curve, as well as the variation in total milk yield and constituents during the 180 d of lactation.
According to the recent review by Martin-Rosset et al. (2006), milk yield peak is located, depending on the feeding system used, between the first and third months of lactation. Our results indicate that the milk yield peak is located at the end of the first month. Protein peaks at d 10 and lactose at d 45 of lactation, and therefore, protein and energy requirements of the lac-tating mare would be expected to be greater during the first and second months. This is in accordance with nutrient requirements given by most of the European systems. Concerning foal supplementation, the curve we obtained allows us to extrapolate into late lactation: the curve shows a rapid decrease in milk production from 3 mo onward, and therefore, this should be the critical time to start foal supplementation. This is in accordance with the recent review published by Martin-Rosset and Younge (2006).
CONCLUSIONS
Concentrations of major constituents (fat, protein, and lactose) in Lusitano mare’s milk are, in general, consistent with those found for other horse breeds. Wood’s model, although developed for cattle lactation curves, seems to describe correctly the lactation curves for Lusitano mares. Lactation curves presented in this study for fat, protein, and lactose present important information when calculating the diet requirements of mares and foals. These estimates may also serve as a useful reference to establish standard values for formu-lation of milk replacers at different stages of lactation for orphan foals. Nevertheless, for this application to be widely used there is a need for more data collection, namely milk yields before d 15 and after d 120, to better adjust the model to the lactation curve of the mare. Further investigation including other mathematical functions would be desirable.
REFERENCES
AOAC. 1990. Official Methods of Analysis. 14th ed. Vol. 1. AOAC, Washington, DC.
Casado, C., O. Piquer, C. Cervera, and J. J. Pascual. 2006. Modelling the lactation curve of rabbit does: Towards a model including fit suitability and biological interpretation. Livest. Sci. 1:39–49. Cobby, J. M., and Y. L. P. Le Du. 1978. On fitting curves to lactation
data. Anim. Prod. 26:127–133.
Csapo´, J., J. Stefler, T. G. Martin, S. Makrey, and Zs. Csapo´-Kiss. 1995. Composition of mare’s colostrum and milk. Fat content, fatty acid composition and vitamin content. Int. Dairy J. 5:393–402.
Doreau, M., and S. Boulot. 1989a. Methods of measurements of milk yield and composition in nursing mares: A review. Lait 69:159–171.
Doreau, M., and S. Boulot. 1989b. Recent knowledge on mare milk production: A review. Livest. Prod. Sci. 22:213–235.
Doreau, M., S. Boulot, J. P. Barlet, and P. Patureau-Mirand. 1990. Yield and composition of milk from lactating mares: Effect of
lactation stage and individual differences. J. Dairy Res. 57:449–454.
Doreau, M., S. Boulot, and Y. Chilliard. 1993. Yield and composition of milk from lactating mares: Effect of body condition at foaling. J. Dairy Res. 60:457–466.
Doreau, M., S. Boulot, R. Jeunet, and J. M. Trin. 1985. Comparaison de diffe´rentes me´thodes de dosage des matie`res grasses et des matie`res azote´es du lait de jument. Lait 65:649–650.
Doreau, M., S. Boulot, W. Martin-Rosset, and J. Robelin. 1986. Rela-tionship between nutrient intake, growth and body composition of the nursing foal. Reprod. Nutr. Dev. 26:683–690.
Doreau, M., and F. Martuzzi. 2006a. Milk yield of nursing and dairy mares. Page 57 in Nutrition and Feeding of the Broodmare. Proc. 3rd Eur. Workshop Equine Nutr. EAAP Publication No. 120. N. Miraglia and W. Martin-Rosset, ed, Wageningen Academic Publishers, Wageningen, the Netherlands.
Doreau, M., and F. Martuzzi. 2006b. Fat content and composition of mare’s milk. Page 77 in Nutrition and Feeding of the Broodmare. Proc. 3rd Eur. Workshop Equine Nutr. EAAP Publication No. 120. N. Miraglia and W. Martin-Rosset, ed, Wageningen Academic Publishers, Wageningen, the Netherlands.
Fradinho, M. J. M. 2002. Mineral suplementation influence in Lusi-ano foals’s growth. MS Thesis. Faculdade de Medicina Veterina´-ria. Universidade Te´cnica de Lisboa, Portugal.
Garcı´a, A., T. Landete-Castillejos, A. Molina, B. Albin˜ana, C. Ferna´n-dez, J. Garde, and L. Gallego. 1999. Lactation curves in captive Iberian red deer (Cervus elaphus hispanicus). J. Anim. Sci. 77:3150–3155.
Gibbs, P., G. D. Potter, R. W. Blake, and W. C. McMullan. 1982. Milk production of quarter horse mares during 150 days of lactation. J. Anim. Sci. 54:496–499.
Gipson, T. A. and M. Grossman. 1990. Lactation curves in dairy goats: A review. Small Rumin. Res. 3:383–396.
Kleyn, D. H. 1985. Determination of lactose by an enzimatic method. J. Dairy Sci. 68:2791–2798.
Ku¨ cu¨ kcetin, A., H. Yaygin, J. Hinrichs, and U. Kulozik. 2003. Adapta-tion of bovine milk towards mare’s milk composiAdapta-tion by means of membrane technology for koumiss manufacture. Int. Dairy J. 13:945–951.
Macciotta, N. P. P., D. Vicario, and A. Cappio-Borlino. 2005. Detection of different shapes of lactation curve for milk yield in dairy cattle by empirical mathematical models. J. Dairy Sci. 88:1178–1191. Mariani, P., A. Summer, F. Martuzzi, P. Formaggioni, A. Sabbioni, and A. Lucio Catalano. 2001. Physicochemical properties, gross composition, energy value and nitrogen fractions of Haflinger nursing mare milk throughout 6 lactation months. Anim. Res. 50:415–425.
Martin-Rosset, W., W. D. Austbo, and M. Coenen. 2006. Energy and protein requirements and recommended allowances in lactating mares. Page 89 in Nutrition and Feeding of the Broodmare. Proc. 3rd Eur. Workshop Equine Nutr. EAAP Publication No. 120. N. Miraglia and W. Martin-Rosset, ed, Wageningen Academic Publishers, Wageningen, the Netherlands.
Martin-Rosset, W., and B. Younge. 2006. Energy and protein require-ments and feeding of the suckling foal. Page 221 in Nutrition and Feeding of the Broodmare. Proc. 3rd Eur. Workshop Equine Nutr. EAAP Publication No. 120. N. Miraglia and W. Martin-Rosset, ed, Wageningen Academic Publishers, Wageningen, the Neth-erlands.
NRC. 1989. Nutrient Requirements of Domestic Animals. No. 6. Nu-trient Requirements of Horses. 5th rev. ed. National Academy of Sciences, Washington, DC.
Oftedal, O. T., H. F. Hintz, and H. F. Schryver. 1983. Lactation in the horse: Milk composition and intake by foals. J. Nutr. 113:2196–2206.
Pagan, J. D., and H. F. Hintz. 1986. Composition of milk from pony mares fed various levels of digestible energy. Equine Vet. J. 16:263.
Pinto, F. M., A. Faccia, A. Di Summa, and G. Mangelo. 2001. Mare’s milk: Early result concerning quality and quantity from Mur-guese and TPR mares. Riv. Ippiatria Ippologia 7:7–19.
Rekik, B., A. Ben Gara, M. Ben Hamouda, and H. Hammami. 2003. Fitting lactation curves of dairy cattle in different types of herds in Tunisia. Livest. Prod. Sci. 83:309–315.
Riek, A., and M. Gerken. 2006. Changes in llama (Lama glama) milk composition during lactation. J. Dairy Sci. 89:3484–3493. Santos, A. S., and A. M. D. Silvestre. 2006. The lactation curve in
Lusitano mares – A preliminary study. Page 149 in Nutrition and Feeding of the Broodmare. Proc. 3rd Eur. Workshop Equine Nutr. EAAP Publication No. 120. N. Miraglia and W. Martin-Rosset, ed, Wageningen Academic Publishers, Wageningen, the Netherlands.
Santos, A. S., B. C. Sousa, L. Chambel, and V. C. Alves. 2005. Yield and composition of milk from Lusitano lactating mares. Pferdeil-kunde 21(Suppl. S.):115–116.
Silvestre, A. M. D., F. Petim-Batista, and J. Colac¸o. 2006. The accu-racy of seven mathematical functions in modelling dairy cattle lactation curves based on test day records from varying sample schemes. J. Dairy Sci. 89:1813–1821.
Smolders, E. A. A., N. E. Van der Veen, and A. Van Polanem. 1990. Composition of horse milk during the suckling period. Livest. Prod. Sci. 25:163–171.
Stanton, T. L., L. R. Jones, R. W. Everett, and S. D. Kachman. 1992. Estimating milk, fat and protein lactation curves with a test day model. J. Dairy Sci. 75:1691–1700.
Wilkinson, L., M. Hill, J. P. Welna, and G. K. Birkenbeuel. 1992. Systat for Windows, Version 5. Systat Inc., Evanston, IL. Wood, P. D. P. 1967. Algebraic models of lactation curve in cattle.