2019
UNIVERSIDADE DE LISBOA
FACULDADE DE CIÊNCIAS
DEPARTAMENTO DE BIOLOGIA ANIMAL
Single-cell transcriptomics in unravelling the molecular
complexity of immunity in human disease
Ana Marta Fernandes Bica
Mestrado em Bioinformática e Biologia Computacional
Dissertação orientada por:
Prof.ª Dr.
aMaria Fernanda Nunes Diamantino
Doutor Nuno Luís Barbosa Morais
ii
Acknowledgments
Firstly, I would like to express my sincere gratitude to my advisor Nuno Morais for the continuous support of my work, for his guidance, motivation, and immense knowledge. I could not have imagined having a better advisor and mentor.
I would like to thank Karine Serre, without your precious support it would not have been possible to conduct this project. All the times spent in your team meeting and all the things you taught me on cancer immunology inspired me to begin the next chapter in my life. I couldn't have done it without you. My sincere thanks also goes to professor Fernanda Diamantino, for enlightening me in biostatistics concepts that were fundamental for this project, and will continue to be throughout my career as a computational biologist. Your positivity and encouragement brightened my days.
A very special gratitude goes out to all down at the Disease Transcriptomics lab. Marie, Mariana, Nuno, Sofia, Sara and Arthur, you are the best colleagues and friends anyone could ask for, thank you. I would also like to thank the people that supported me continuously throughout my life, specially my mother, who passed on the science curiosity genes to me, and Fábio, for always supporting me in my aspirations.
Finally, a big thank you to my friends. Micaela, one of the best parts of this master’s was getting to know you. There were some tough semesters, but you helped me through them. Jorge, my academic accomplice, you are an amazing friend, and I hope we’ll keep on sharing academic insights for many years to come.
iii
Resumo
O sistema imunitário engloba milhões de células que formam uma estrutura dinâmica e em comunicação, com o objetivo de defender o hospedeiro contra a entrada de agentes patogénicos e outras ameaças, como o aparecimento de células cancerígenas. No ser humano, a resposta imunitária envolve diversos tipos de células e, para cada tipo, estados celulares diferentes, interagindo entre si, de forma a manter e a proteger a função e integridade do organismo.
Ao longo da vida o sistema imunitário vigia continuamente o organismo, através de um equilíbrio que envolve células imunitárias efectoras e reguladoras. No entanto, com o envelhecimento, ocorre um declínio gradual deste sistema, definido como imunosenescência. Esta deterioração leva a alterações nas proporções de diferentes tipos de células imunitárias no organismo e nas suas competências, o que, por sua vez, contribui para o aumento da prevalência de cancro, bem como para a propensão para um estado de inflamação crónica de baixo grau, implicado noutras doenças relacionadas com o envelhecimento, tais como as doenças neurodegenerativas. De facto, a idade é o principal fator de risco para o desenvolvimento da doença de Alzheimer e da doença de Parkinson. A sobreposição temporal entre o envelhecimento e a neurodegeneração tem alimentado um debate contínuo sobre se todos nós somos suscetíveis a desenvolver uma doença neurodegenerativa se vivermos tempo suficiente. Esta hipótese é sustentada pelo facto de o cérebro envelhecido apresentar várias lesões que não estão presentes no cérebro de pessoas mais jovens e de essas lesões se assemelharem a uma versão de grau inferior às encontradas nas doenças neurodegenerativas mais comuns. Muitos dos mecanismos implicados nas doenças neurodegenerativas são paralelos às mudanças que ocorrem com o envelhecimento e a maioria dos cérebros de idosos apresenta alterações específicas que podem ser ligadas a um certo nível de neurodegeneração, tal como a agregação de placas proteicas tóxicas e a neuro-inflamação.
A neuro-inflamação consiste numa desregulação do sistema imunitário, associada à ativação e hiper-reactividade da microglia, o principal tipo de células imunitárias no sistema nervoso central. Os astrócitos são outro tipo de célula não-neuronal presente no sistema nervoso central, que participa na constituição da barreira hematoencefálica e providencia suporte aos neurónios, entre outras funções. Estas células também se tornam excessivamente reativas com o envelhecimento. A neuro-inflamação é, assim, uma potencial causa das alterações funcionais que ocorrem durante o envelhecimento normal e patológico, tendo um efeito tremendo no aumento da suscetibilidade às doenças neurodegenerativas. A exacerbação, com a idade, de processos inflamatórios no sistema nervoso central leva à perda da homeostase e, consequentemente, à disfunção ou morte de células neuronais, tal como observado na doença de Alzheimer e na doença de Parkinson. Contudo, uma minoria de pessoas ultrapassa a idade dos 80 anos sem mostrar sinais de debilitação cognitiva. Estas pessoas são a prova da existência de mecanismos compensatórios, que lhes permitem envelhecer saudavelmente e manter uma cognição normal.
O envelhecimento é também um dos principais factores de risco do cancro. O cancro da mama é uma doença particularmente associada às mulheres mais velhas, raramente ocorrendo antes dos 30 anos de idade, e com maior prevalência acima dos 60 anos de idade. Todos os anos, mais de 1,5 milhões de mulheres são diagnosticadas com cancro da mama, tornando-o o cancro mais comum, bem como o segundo mais mortal, nas mulheres, a nível mundial.
As terapias tradicionais do cancro da mama incluem quimioterapia e radioterapia. Contudo, o tratamento desta doença continua a ser um desafio devido à sua natureza heterogénea. Aliás, existem vários subtipos de cancro da mama, sendo o mais agressivo o cancro da mama triplo-negativo. Ainda não existem medicamentos e/ou terapias especificamente direcionadas ao tratamento deste tipo de cancro, o que
iv enfatiza a necessidade de explorar terapias alternativas, tal como a imunoterapia, tendo em conta que a importância do sistema imunitário no cancro da mama é inequívoca.
O microambiente tumoral é composto por matriz extracelular e células infiltradas na massa tumoral. Estas incluem uma proporção elevada de células tanto do o sistema imunitário inato como do adaptativo. As células imunitárias no microambiente tumoral foram já descritas como sendo determinantes na iniciação, progressão e metastização do cancro. Apesar da existência de subtipos diferentes de cancro da mama, e da variabilidade interindividual de doentes, estudos recentes, focados no microambiente tumoral, demonstraram a existência de padrões de infiltração de células imunitárias correlacionados com prognóstico (negativo ou favorável) em doentes com cancro da mama. Por exemplo, existe uma associação entre a infiltração de linfócitos, nomeadamente células T CD8+, e prognóstico favorável da doente, dado que estas células possuem funções citotóxicas capazes de eliminar células tumorais. Desta forma, as células T, no microambiente tumoral, já foram extensivamente estudadas e relacionadas como um componente fundamental do mesmo, devido a ensaios clínicos recentes que demonstraram a capacidade de controlar a progressão do cancro nalguns doentes ao manipular estas células.
Contudo, as células mieloides, que englobam um conjunto de células do sistema imunitário inato, permanecem menos estudadas do que as células T, apesar de constituírem uma proporção significativa das células imunitárias infiltradas no microambiente tumoral. Dessas células, destacam-se os macrófagos, que podem atingir proporções superiores a 50% da própria massa tumoral na mama. Estas células apresentam polarizações diferentes conforme os estímulos do microambiente, podendo adotar um fenótipo que inibe o crescimento do tumor (anti-tumoral) ou que o favorece (pro-tumoral). A presença de macrófagos pró-tumorais no microambiente tumoral tem vindo a ser descrita como um indicador de prognóstico negativo no cancro, incluindo no cancro da mama. Por outro lado, os macrófagos anti-tumorais têm a capacidade de induzir a regressão dos tumores, pelo que, geralmente, encontram-se associados a um prognóstico favorável no cancro da mama. A existência de macrófagos com funções antagónicas torna-os num tópico de investigação ativo na área do cancro da mama, com o objectivo de desenvolver novas imunoterapias, direcionadas à diminuição dos números de macrófagos pro-tumorais, ou à re-polarização dos mesmos em macrófagos anti-tumorais.
Assim, é importante caracterizar a heterogeneidade celular do sistema imunitário, possibilitando o conhecimento dos processos biológicos fundamentais que ocorrem no envelhecimento saudável e na doença. Para tal, é possível utilizar single-cell RNA sequencing, uma abordagem que utiliza tecnologias de sequenciação do transcritoma de uma única célula, permitindo medir a distribuição dos níveis de expressão de cada gene numa população de células individuais e melhor entender os padrões de expressão génica em tecidos complexos, como o cérebro e o microambiente tumoral.
O desenvolvimento de protocolos de single-cell RNA sequencing foi motivado pela necessidade de estudar condições em que apenas uma pequena quantidade de material se encontrava disponível, tal como o desenvolvimento embrionário. Contudo, o aperfeiçoamento de protocolos e das plataformas de sequenciação permitiu um aumento no número de células utilizadas nestes ensaios, podendo chegar às centenas de milhares de células por estudo. Esta evolução contínua tem vindo a melhorar radicalmente a dissecção da heterogeneidade de populações celulares, particularmente na estimação da infiltração de células imunitárias em tumores sólidos, e na área das neurociências, permitindo caracterizar a grande diversidade de células neuronais e não-neuronais em várias regiões do sistema nervoso central.
Este trabalho consistiu em duas partes, ambas envolvendo a análise de dados públicos de single-cell
RNA sequencing. Na primeira parte, focámo-nos em desenvolver uma pipeline de análise
v cérebro, e como a abundância destas populações se correlaciona com o envelhecimento e patologias neurológicas.
Com esta análise demonstrámos que, para alguns tipos específicos de tecido cerebral, ocorre um decréscimo na proporção de neurónios com a idade, concomitante com um aumento na proporção de astrócitos. Esta alteração de proporções é acentuada na doença de Alzheimer e na doença de Parkinson, nas quais os tecidos afetados pela neurodegeneração demonstram uma proporção relativa inferior de neurónios, bem como uma proporção relativa superior de astrócitos, quando comparados com tecidos cerebrais sem doença.
Também demonstrámos que o sistema nervoso central não é um local totalmente imuno-privilegiado pois conseguimos estimar as abundâncias absolutas de diferentes tipos de células imunitárias no cérebro. Aliás, esta análise revelou que, as células T CD4+ de memória são as células imunitárias que se infiltram em maior quantidade no cérebro, existindo uma variabilidade elevada entre indivíduos.
A segunda parte deste trabalho teve como objectivo avaliar a diversidade celular e a assinatura molecular de macrófagos infiltrados no microambiente tumoral no cancro da mama, bem como caracterizar os padrões de infiltração de células imunitárias na massa tumoral e o modo como estes se encontram associados com a idade e o prognóstico.
Com esta análise, identificámos grupos de macrófagos infiltrados na massa tumoral com fenótipos diferentes, tais como macrófagos com funções pró-inflamatórias anti-tumorais e macrófagos alternativamente ativados, ou seja, com funções anti-inflamatórias pró-tumorais. Por outro lado, descobrimos ainda um grupo de macrófagos transcricionalmente ativos, que não se assemelham a nenhuma das polarizações previamente descritas, tratando-se, possivelmente, de um novo estado por descrever.
Verificámos ainda a ocorrência de um aumento significativo com a idade na proporção relativa de macrófagos pró-tumorais no microambiente tumoral do cancro da mama. Estes macrófagos têm a capacidade de suprimir a resposta anti-tumoral das células T CD8+ citotóxicas. Ao comparar grupos de tumores com uma proporção relativa elevada/baixa de macrófagos pró-tumorais, e grupos de tumores com uma proporção relativa baixa/elevada de células T CD8+, verificámos que a infiltração de macrófagos pró-tumorais parece estar associada com o processo biológico de transição epitelial-mesenquimal, o qual está envolvido no potencial metastático dos tumores malignos. Em contraste, a infiltração de células T CD8+ encontra-se associada ao reconhecimento do tumor e à consequente elicitação de uma resposta imunitária ativa.
vi
Abstract
Throughout the course of life, the immune system keeps surveilling the organism for foreign pathogens and cancerous cells. However, with ageing there is a gradual decline of the immune system fitness, which is defined as immunosenescence. This deterioration leads to alterations in the proportions of different immune cell types in the organism and in their capabilities. Moreover, it contributes to the increased prevalence of cancer as well as a propensity of a chronic low-grade inflammatory state implicated in other age-related diseases, such as neurodegenerative ones.
The immune system comprises a multitude of different cell types and states. It is important to assess this cell heterogeneity in order to understand fundamental biological processes in healthy ageing and disease. One way to do this is through single-cell RNA sequencing, an approach that uses sequencing technologies to profile the transcriptome of a single cell, thereby allowing to measure the distribution of expression levels for each gene across a population of individual cells, and to better understand gene expression patterns in complex heterogeneous tissues, such as the brain and the tumour microenvironment.
Using publicly available single-cell RNA sequencing datasets, the first part of this work was focused on developing a computational analysis pipeline to study the relative abundance of neuronal and non-neuronal cells in the brain and how they correlate with ageing and neurological health.
We found that, for some brain tissues, there is a decrease in the proportion of neurons with ageing, concomitant with an increase in the proportion of astrocytes. This shift in proportions is accentuated in Alzheimer’s disease and Parkinson’s disease, in which specific brain tissues affected by neurodegeneration show a relatively lower proportion of neurons and a relatively higher proportion of astrocytes, when compared with controls. We also demonstrated that the central nervous system in not totally an immune-privileged tissue without infiltration of blood-leucocytes, by estimating absolute abundances of different immune cell types in the brain. This revealed that resting CD4+ memory T cells present the highest proportion of brain-infiltrating immune cells, with a relatively high level of variability between individuals.
In the second part of this work, our goal was to evaluate the cellular diversity and molecular signature of breast tumour-associated macrophages, and to understand how the intra-tumoural diversity and functionality of infiltrating immune cell types was associated with age and prognosis.
By implementing single-cell RNA sequencing data analysis tools, we were able to discern groups of tumour-infiltrating macrophages with different phenotypes, such as the classically activated polarization (anti-tumour) macrophages and the alternatively activated polarization (pro-tumour) ones. On the other hand, we found a group of transcriptionally activate macrophages that do not resemble any of the previously described polarizations, possibly being a new unstudied state. We also found that there is a significant increase in the relative proportion of breast tumour-infiltrating pro-tumour macrophages with ageing. These macrophages are known to suppress CD8+ cytotoxic T cell-mediated anti-tumour immune responses. By comparing groups of breast tumour bulk RNA-sequencing samples with a high/low proportion of pro-tumour macrophages, and a low/high proportion of CD8+ T cells, we found that infiltration of pro-tumour macrophages is associated with the cancer metastasis hallmark (epithelial-mesenchymal transition). In contrast the tumours with higher infiltration of CD8+T cells, were associated with the recognition of the breast tumour as non-self and the consequent elicitation of an active immune response.
viii
Table of contents
Resumo ... iii
Abstract ... vi
List of figures ... xi
List of tables ... xii
Abbreviation List ... xiii
1. The Immune System ... 1
1.1. Innate Immune system ... 1
1.2. Adaptive immune system ... 2
2. Neurodegenerative diseases ... 3
2.1. Alzheimer’s disease ... 3
2.2. Parkinson’s disease... 4
2.3. Overlap between ageing and neurodegeneration ... 5
2.3.1. Neuro-inflammageing ... 6
3. Breast Cancer ... 7
3.1. Breast cancer subtypes ... 7
3.1.1. Histopathology ... 8
3.1.2. Immunohistochemistry markers ... 8
3.1.3. Gene expression profiling... 8
3.2. The tumour microenvironment ... 9
3.2.1. Immunosenescence and macroph-ageing ... 10
4. Single-cell transcriptomics ... 11
4.1. The technology of single-cell RNA sequencing ... 13
4.1.1. Number of cells vs sequencing depth ... 14
4.2. Computational analysis ... 15
5. Objectives ... 17
5.1. Single-cell RNA sequencing of the brain ... 17
5.2. Single-cell RNA sequencing of tumour-infiltrating immune cells ... 17
6. Methods ... 18
6.1. Single-cell RNA sequencing of the brain ... 18
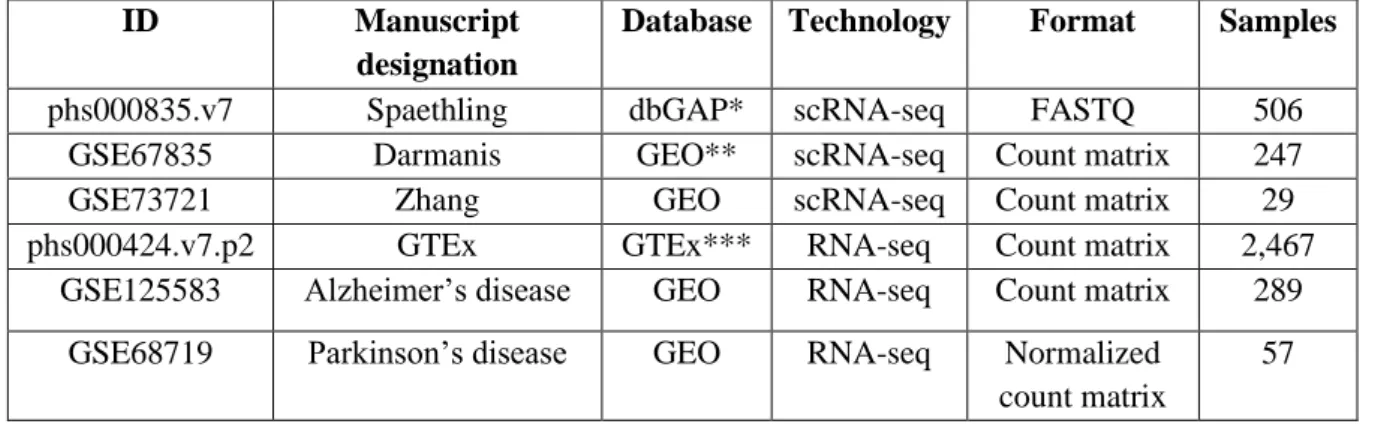
6.1.1. Datasets ... 18
6.1.2. Normalization ... 19
6.1.3. Feature selection ... 20
6.1.4. Pseudotime analysis ... 20
ix
6.1.6. Marker genes ... 21
6.1.7. Cell type deconvolution ... 22
6.2. Single-cell RNA sequencing of tumour-infiltrating immune cells ... 22
6.2.1. Datasets ... 22
6.2.2. Normalization ... 23
6.2.3. Feature selection and data scaling ... 23
6.2.4. Clustering ... 23
6.2.5. Marker genes ... 24
6.2.6. Estimation of relative immune cell type proportions ... 24
6.2.7. Survival analysis ... 24
6.2.8. Differential gene expression analysis ... 25
6.2.9. Gene Set Enrichment Analysis ... 25
7. Data Analysis ... 25
7.1. Obtaining the gene expression signatures of the major brain cell types... 25
7.1.1. Quality control and normalization ... 25
7.1.2. Pseudotime analysis ... 31
7.1.3. Feature selection and clustering ... 32
7.1.4. Marker genes ... 34
7.1.5. Merging scRNA-seq datasets ... 40
7.1.6. Gene signature for brain cell types ... 42
7.2. Unveiling how the relative abundance of neurons and glia in the brain correlates with ageing and neurological health ... 43
7.2.1. Cell type deconvolution of the healthy brain... 43
7.2.2. Cell type deconvolution of the brain in Alzheimer’s disease ... 46
7.2.3. Cell type deconvolution of the brain in Parkinson’s disease ... 47
7.2.4. Immune cell type deconvolution of the healthy brain ... 48
7.3. Evaluating the cellular diversity and molecular signature of TAMs ... 49
7.3.1. Normalization and clustering ... 49
7.3.2. Identifying macrophage subpopulations ... 52
7.4. Understanding how the intra-tumoural diversity and functionality of infiltrating immune cell types is associated with age and prognosis... 54
7.4.1. Deconvolution of immune cell types of TCGA samples ... 54
7.4.2. Differential expression and Gene Set Enrichment analysis ... 56
8. Concluding remarks ... 60
8.1. Analysis limitations ... 61
x 9. References ... 62 10. Supplementary figures ... 79
xi
List of figures
Figure 2.1: Disease progression in Alzheimer's disease. ... 4
Figure 2.2: Progression of Parkinson's disease as proposed by Braak et al.. ... 5
Figure 2.3: Staining of activated microglia in the white matter of the inferior frontal gyrus and in corpus callosum. ... 6
Figure 3.1 Schematic representation of immune cell immunosenescence-related changes ... 11
Figure 4.1: Scaling up of scRNA-seq experiments. ... 12
Figure 4.2: Steps of a scRNA-seq protocol with different experimental approaches.. ... 14
Figure 4.3: Relationship between sequencing depth and cell type identification. ... 15
Figure 7.1: Histograms of the library sizes (total_counts, top panels) and the number of unique features detected (total_features, bottom panels) in all cells of the Spaethling dataset. ... 26
Figure 7.2: Quality control of the Spaethling dataset. ... 27
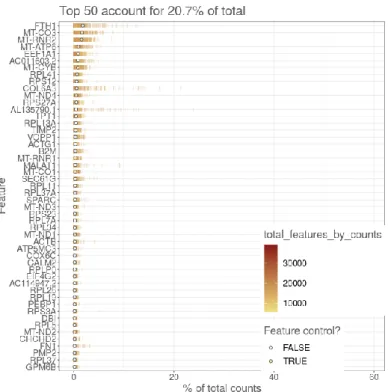
Figure 7.3: Percentage of total counts attributed to the top 50 most highly-expressed features in the Spaethling dataset. ... 28
Figure 7.4: Number of expressing cells vs the log10-transformed mean expression for each feature in the Spaethling dataset, before (left) and after (right) filtering lowly expressed genes. ... 28
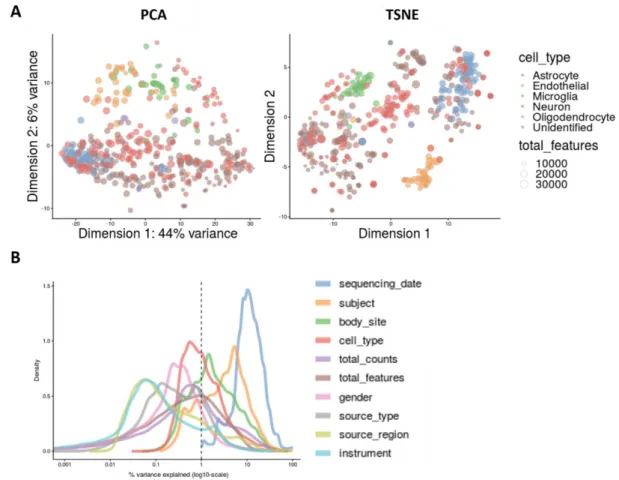
Figure 7.5: A- PCA and t-SNE of the Spaethling dataset; B – Explanatory variables. ... 29
Figure 7.6: Normalization and batch effect correction of the Spaethling dataset. ... 30
Figure 7.7:Example of the results of performing pairwise differential expression analysis in the Spaethling dataset. ... 31
Figure 7.8: Pseudotime analysis of the Spaethling dataset.. ... 32
Figure 7.9:Consensus matrices of the Spaethling dataset... 33
Figure 7.10:Consensus matrices of the Spaethling dataset, using only selected features with HDG. ... 34
Figure 7.11: Results of performing cell type deconvolution on pseudobulk data, using gene signatures that resulted from each of the combinations of methods used. ... 36
Figure 7.12: Results from performing cell type deconvolution with gene signatures generated by combinations of methods 1 to 8. This analysis was performed only on neurons from the Darmanis dataset. ... 37
Figure 7.13:Results from performing cell type deconvolution with gene signatures generated by combinations of methods 1 to 8. This analysis was performed only on astrocytes from the Darmanis dataset. ... 38
Figure 7.14: Results from performing cell type deconvolution with gene signatures generated by combinations of methods 1 to 8. This analysis was performed only on microglia from the Darmanis dataset. ... 39
Figure 7.15: t-SNEs of the merged Spaethling and Darmanis dataset, before normalization (A,D), after normalization for library size (B, E), and after normalization for batch effect (C, F)... 40
Figure 7.16: Explanatory variables of the Spaethling and Darmanis merged dataset ... 41
Figure 7.17:Results of cell type deconvolution on the Zhang dataset, with the final gene signature. .. 42
Figure 7.18: Box plots of age and relative proportions of brain cell types, grouped by brain tissue. ... 44
Figure 7.19:Box plots of age and relative proportions of brain cell types, in Alzheimer’s disease affected fusiform gyrus and healthy fusiform gyrus (control). ... 46
Figure 7.20: Box plots of age and relative proportions of brain cell types, in Parkinson’s disease affected frontal cortex and healthy frontal cortex (control). ... 47
Figure 7.21: Box plots of relative proportions of immune cell types in the non-diseased brain. ... 49
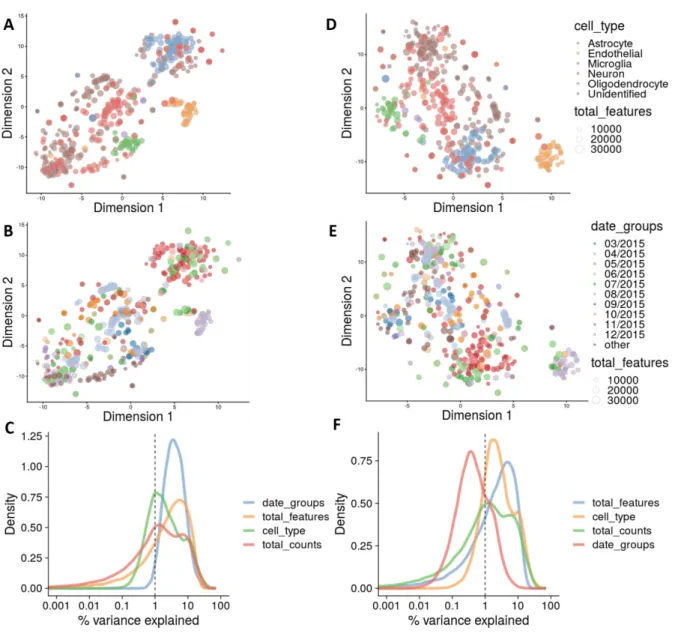
Figure 7.22: Density plots of the percentage of variance explained of the log-expression values across cells... 50
xii Figure 7.23: t-SNE of the Azizi dataset, coloured by cell type (A) and patient (B). ... 50 Figure 7.24: Results from the clustering analysis of breast tumour-infiltrating immune cells. ... 51 Figure 7.25: t-SNEs of the Azizi dataset, coloured by the results of clustering (A) and by patient (B). ... 52 Figure 7.26: Heatmaps representing the top 10 genes from the differential expression analysis between cluster 0, 1 and 2 (A), and between cluster 0 and 2 (B). ... 53 Figure 7.27: Analysis of cellular composition deconvolution of TCGA breast cancer RNA-seq datasets.. ... 55 Figure 7.28: Scatter plots of the relative proportion of M2 macrophages vs age (A) and the relative proportion of CD8+ T cells vs age (B).. ... 56 Figure 7.29: Kaplan-Meier plots for patient stratification based on the relative proportion of M2 macrophages (left) and the relative proportion of CD8+ T cells (right). ... 56 Figure 7.30: Volcano plot showing the results of linear regression analysis comparing the groups of samples with relatively high proportion of CD8+ T cells and low proportion of M2 macrophages vs samples with relatively low proportion of CD8+ T cells and M2 macrophages.. ... 57 Figure 10.1: Selection of breast tumour bulk RNA-seq samples to perform differential expressional analysis, as described in section 6.2.8. ... 79 Figure 10.2: Representation of different synthetic scRNA-seq data structures obtained with different clustering methods.. ... 79
List of tables
Table 6.1: Summarized description of the datasets used in the first part of the analysis. ... 18 Table 6.2: Summarized description of the datasets used in the second part of the analysis. ... 22 Table 6.3: Clinical metadata of the Azizi dataset ... 23 Table 7.1: Combination of feature selection and classification methods, to obtain the marker genes for each neuronal cell population. ... 35 Table 7.2: Results of the Spearman’s correlation analysis between the relative proportions of brain cell types in each analysed tissue and age. ... 45 Table 7.3: MSigDB’s Hallmark Gene Sets (FDR < 0.1). ... 59 Table 10.1: Results from the GO enrichment analysis using marker genes of reactive astrocytes from the Spaethling dataset. ... 80 Table 10.2: Results from the GO enrichment analysis using marker genes of resting astrocytes from the Darmanis dataset. ... 81
xiii
Abbreviation List
Aβ - β-amyloid peptide AD - Alzheimer’s disease APCs - Antigen-presenting cells APP - Amyloid precursor protein BBB - Blood-brain barrier CD - Cluster of differentiation CNS - Central nervous system DC - Dendritic cell
ER - Oestrogen receptor
FDCSP - Follicular dendritic cell secreted protein GFAP - Glial fibrillary acidic protein
GM-CSF - granulocyte-macrophage colony-stimulating factor GO – Gene ontology
HER2 - Human Epidermal growth factor Receptor 2 HDG - High dropout genes
HVG - Highly variable genes IHC - Immunohistochemistry LCM - Laser capture microdissection
M-CSF - Monocyte colony stimulating factor M0 - Non-polarized macrophages
MDSC - Myeloid-derived suppressor cell NK - Natural killer
PCA - Principal component analysis PD - Parkinson’s disease
pDC - Plasmacytoid dendritic cell PR - Progesterone receptor
TAM - Tumour-infiltrating macrophage Th - Helper T
xiv TME - Tumour microenvironment
TNBC - Triple negative breast cancer Treg - Regulatory T
1
1. The Immune System
The immune system consists of millions of cells that form a dynamic communicating structure, with the goal of defending the host against infecting pathogens and other agents, such as malignant transformed cells. The immune response in human health and disease involves a multitude of different cell types and states, interacting amongst each other and with non-immune cells, to maintain and protect tissue function and integrity. The distinct elicited immune responses, along with the immune cells that are part of this complex network, can be classified into two major components: the innate immune system and the adaptive immune system (Goldman and Prabhakar 1996).
1.1. Innate Immune system
The innate immune response is an immediate and non-specific defence mechanism. Besides including anatomical barriers that avoid the entrance of infectious agents in the organism, this response is dependent on the recruitment of natural killer and myeloid cells. Natural killer (NK) cells are effector lymphocytes with cytotoxicity and cytokine-producing effector functions, directed at killing infected host cells and tumour cells, limiting their spread (Vivier et al. 2008). Myeloid cells can be phagocytic (neutrophils, monocytes, dendritic cells and macrophages) or inflammatory mediator-releasing cells (basophils, mast cells, and eosinophils) (Delves and Roitt 2000).
Monocytes are blood-circulating phagocytes that can develop into macrophages or dendritic cells after migrating into tissues (Karlmark, Tacke and Dunay 2012).
Dendritic cells (DC) are potent antigen-presenting cells (APCs), acting in tissues that are in contact with the external environment, linking the innate and the adaptive arms of the immune system (Mellman 2013). Myeloid-derived DCs are usually considered a distinct cell type from plasmacytoid dendritic cells (pDC), given that they may not descend from the myeloid lineage (Reizis 2019).
Macrophages are highly adherent and motile phagocytes that patrol tissues for potential pathogens. They also produce large amounts of pro-inflammatory cytokines and chemokines, and are able to recruit lymphocytes through antigen-presentation, assisting the initiation of the adaptive immune response (Goldman and Prabhakar 1996).
Monocytes and macrophages from different tissues, together with their precursors, constitute the mononuclear phagocyte system, in which monocytes replace resident macrophages in all major organs, by adopting specific gene expression profiles, which translate into distinct functions. Kupffer cells in the liver and alveolar macrophages in the lung are two examples of specialized monocyte-derived macrophages (Hume, Irvine and Pridans 2019).
Neutrophils, basophils and eosinophils are granulocytic cells, i.e., they contain cytoplasmic granules filled with antimicrobial products, inflammation mediators, and cytotoxic proteins, respectively. While neutrophils engulf and digest pathogens, basophils and eosinophils degranulate the content of their granules in response to parasitic infections and allergies. Mast cells have similar functional characteristics as basophils. However, unlike the latter, they reside in tissue instead of the bloodstream (Goldman and Prabhakar 1996).
In the central nervous system (CNS), the major resident myeloid cells are microglia. Microglia survey the microenvironment and release trophic factors which are important for neuronal cell survival. Their
2 phagocytosis capability is also important in synaptic homeostasis and clearance of cellular debris resulting from injury. Although functionally similar to macrophages, microglia originate from the yolk sac and populate the CNS prior to its vasculogenesis (Nayak, Roth and McGavern 2014). Microglia, together with oligodendrocytes and astrocytes, are the major components of glia, i.e., the main non-neuronal cells of the CNS, that are key in maintaining homeostasis and non-neuronal function. Representing the larger fraction of glia in the brain, astrocytes are responsible for the maintenance of ion homeostasis and the blood-brain barrier (BBB), production of neurotrophic factors, participation in the formation, maturation and elimination of synapses, and uptake of neurotransmitters. Furthermore, astrocytes play a role in local immune regulation, by releasing inflammatory mediators that activate and amplify the initial innate immune response, and by altering BBB permeability, allowing the entrance of peripheral blood immune cells in the brain parenchyma (Vasile, Dossi and Rouach 2017; Farina, Aloisi and Meinl 2007).
1.2. Adaptive immune system
The adaptive immune response, also known as the acquired immune response, is mediated by specialized cells, capable of targeting pathogens more accurately than the innate system, and of a long-term response, enabled by the generation of immunological memory. This leads to a more efficient immune response when the pathogen is reencountered (Delves and Roitt 2000). These specialized cells are lymphocytes, namely antigen-specific B and T cells.
Activated B cells (short-lived plasma cells) secrete neutralizing immunoglobins that bind to and lead to the elimination of pathogens. Like macrophages and dendritic cells, they are also APCs. Some B cells become pathogen-experienced memory B cells, which are important in eliciting an enhanced immune response in the case of re-infection (Goldman and and Prabhakar 1996; Kurosaki, Kometani and Ise 2015).
T cells can be categorized into three distinct subsets: effector T cells, regulatory T cells and memory T cells. Effector T cells actively respond to stimuli and can be further divided into helper T cells and cytotoxic T cells. Helper T cells express the CD4 molecule and regulate the immune response, by producing cytokines that stimulate phagocytic cells, aid B cell proliferation and differentiation, and assist other effector T cells in cell-mediated immunity. Cytotoxic T cells express the CD8 molecule and directly kill infected or altered cells, through the production of cytolytic enzymes. Regulatory T cells, also known as suppressor T cells, express CD4 and are involved in preventing immune overreaction, by supressing T and B cell activity (Cano and Lopera 2013). Memory T cells can be either CD4+ or CD8+, and represent long-lived populations of T cells that can rapidly differentiate into effector T cells, when re-encountering pathogens to which they were previously exposed (Omilusik and Goldrath 2017). In summary, the innate response is a nonspecific response that is not altered by the number of times the same pathogen is encountered. The adaptive response is a highly specific and long-lasting response that is enhanced when the pathogen is re-encountered. Both systems are connected in a complex net of relationships that allows them to work together to neutralize potential threats to the organism. Thus, the failure in any component of the immune system may lead to a deficient immunosurveillance state.
3
2. Neurodegenerative diseases
For the first time in history, we are rapidly approaching a shift in the world’s population age distributions. It is expected that, by the year 2030, people older than 60 years will have already outnumbered children under the age of 10, and, by 2050, they will also outnumber children and young adults between 10 to 24 years of age (United Nations 2017).
Although the desired increase in life expectancy is a product of the success of medical advancements, public health and socio-economical improvements, global ageing is expected to lead to an accelerated increase in the prevalence of neurodegenerative disorders, such as Alzheimer’s disease (AD) and Parkinson’s disease (PD) (Erkkinen, Kim and Geschwind 2017). Both these diseases are sources of growing morbidity and mortality rates, particularly in the elderly.
AD and PD present different clinical symptomatology and progression, albeit there are overlapping features in their pathological processes, such as defects in proteostasis and immune regulation, concomitant with a common inflammatory mechanism, implicated in the chronic progression of most neurodegenerative diseases (Gao and Hong 2008).
2.1. Alzheimer’s disease
Late-onset AD is the most common cause of dementia in the world. It is characterised by progressive short-term memory loss, followed by language, visuospatial and executive function impairment. Patients in later stages may also display motor dysfunction. The disorder eventually culminates in death, with patients living, on average, 8 to 10 years, after diagnosis (Schachter and Davis 2000).
The pathology of AD is associated with the accumulation of neurofibrillary tangles and deposition of neuritic plaques in the brain (Figure 2.1B) (Zheng and Koo 2006). Neuritic plaques consist of insoluble deposits of β-amyloid peptide (Aβ), a fragment of the larger amyloid precursor protein (APP). Currently, it is still unclear whether neuritic plaques are a cause or a consequence of AD. Previous studies report contrasting hypotheses, for example, either stating that dysfunction in the metabolism of APP, with subsequent increase in the insoluble Aβ, is responsible for AD (Schachter and Davis 2000), or that plaques exist in both the cognitive impaired elderly and elderly which show no loss of cognitive ability (Makin 2018).
Neurofibrillary tangles are intracellular accumulations of modified tau protein, secondary to Aβ deposition. In the healthy brain, tau proteins are microtubule stabilizers. However, in AD brain, tau proteins are hyperphosphorylated, leading to their self-polymerization and to the formation of tangles (Kolarova et al. 2012).
In spite of their unclear role in the pathology of AD, it is known that neurofibrillary tangles and neuritic plaques are neurotoxic and can lead to neuron degeneration, either by directly disrupting signalling and obstructing cell function, or by indirectly causing inflammation and oxidative stress (Farias et al. 2011; Yankner, Duffy and Kirschner 1990; Huang, Zhang and Chen 2016).
The distribution pattern of neurofibrillary tangles and neuronal alterations in a subject’s brain is used to verify the stage of AD progression (Braak and Braak 1991). In Braak stages I and II, neuronal alterations are confined to the transentorhinal region of the brain (Figure 2.1A). Stages III and IV occur when there
4 is involvement of the transentorhinal region and the hippocampus, and V and VI when there is extensive neocortical degeneration (Dossi, Vasile and Rouach 2018).
Figure 2.1: Disease progression in Alzheimer's disease. A - Distribution pattern of neurofibrillary tangles and abnormal neurites; B - Immunohistochemical staining of intracellular neurofibrillary tangles (brown, indicated by arrows) and extracellular neuritic plaques (pink, indicated with a circle). Scale bar 50 µm. Adapted from Vies 2016.
Currently, there is no treatment to stop AD progression, with existing pharmaceutical therapies, e.g. acetylcholinesterase inhibitors and memantine, only providing modest cognitive and functional benefits (Pierce, Bullain and Kawas 2017).
2.2. Parkinson’s disease
PD is the second most common neurodegenerative disease. PD mainly affects the motor system and is characterised by slow movement and an impaired ability to move the body swiftly on command. Manifestations such as tremors and muscle stiffness are also common in PD. Dementia can also be present in later stages (Costantini, D’Angelo and Reale 2018). The median age of onset is 60 years, with patients living, on average, 15 years after diagnosis (Erkkinen, Kim and Geschwind 2017). However, the age of the patient seems to be responsible for the progression of clinical symptoms, rather than the age of disease onset (Hindle 2010).
Although the cause of PD is still unknown, motor symptoms are attributed to the loss of dopaminergic neurons in the substantia nigra pars compacta, resulting in a decrease of dopamine levels in the brain (Costantini, D’Angelo and Reale 2018). Another characteristic feature of PD is the presence of Lewy bodies, resulting from accumulation of α-synuclein and ubiquitin aggregates in the neuronal cytoplasm. α-synuclein is also present in neuronal processes, as well as in astrocytes and oligodendrocytes (Shults 2006).
Braak staging in PD is performed according to the degree and localization of Lewy body accumulation, neurodegeneration and consequent clinical symptomology. In stage I, pathological changes occur only in the dorsal motor nucleus and olfactory bulb. Stage II involves Lewy body formation in the pons and medulla. In stage 3 and 4, patients exhibit clinical motor symptoms, and stages 5 and 6 involve degeneration of the neocortex, leading to cognitive impairment and dementia (Figure 2.2) (Hindle 2010).
5
Figure 2.2: Progression of Parkinson's disease as proposed by Braak et al. From Visanji et al. 2013.
There is no cure for Parkinson's disease. Current therapies symptoms are mainly symptomatic and include pharmacologic therapies that target the motor features of PD, by improving dopamine signalling. Anticholinergics are also effective for patients with a tremor-predominant phenotype, as well as deep brain stimulation with microelectrodes, which can alleviate motor fluctuation (Erkkinen, Kim and Geschwind 2017).
2.3. Overlap between ageing and neurodegeneration
Age is the primary risk factor for AD and PD (Yankner, Lu and Loerch 2008). The overlap between ageing and neurodegeneration has fuelled a continuous debate as to whether we are all liable to develop a neurodegenerative disorder if we live long enough. This hypothesis is sustained by the fact that the aged brain presents several lesions that are not present in the brains of younger people, and that these lesions resemble a lower grade version of the ones found in neurodegenerative disease. In fact, many of the mechanisms implicated in neurodegenerative disease are parallel to the changes that occur with ageing, and the majority of aged brains show characteristic alterations, such as plaque accumulation, that can be linked to a certain level of neurodegeneration (Yankner, Lu and Loerch 2008; Hindle 2010). Moreover, the machinery behind protein synthesis, folding, disaggregation and degradation can be compromised with ageing, having profound consequences for disease presentation and progression (Wyss-Coray 2016).
Nevertheless, a minority of the population surpasses the age of 80 without showing any signs of cognitive impairment, and are designated as the “Super Agers” (Gefen et al. 2019). Super Agers highlight the possible existence of compensatory mechanisms, which are lost in normal agers, and that enable them to age healthily and maintain normal cognition.
6
2.3.1. Neuro-inflammageing
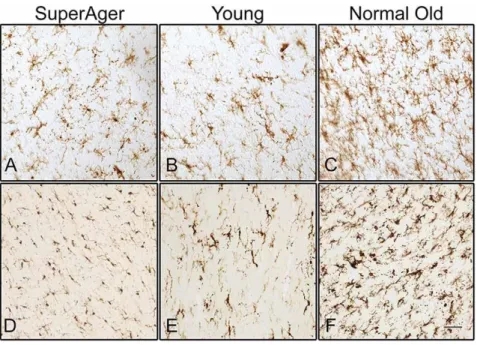
Inflammageing is a chronic low-grade inflammation state associated with ageing. In the CNS, this inflammatory phenotype is named neuro-inflammageing and is present in most neurodegenerative diseases, including AD and PD (Wyss-Coray 2016). Neuro-inflammageing consists of a dysregulation of the immune system, related to the activation and hyperreactivity of microglia, and the subsequent production of pro-inflammatory cytokines (Wyss-Coray 2016). There’s also an increase in the number and density of microglia in the aged brain (Figure 2.3), which may be due to compensatory mechanisms, related with their reduced capacity of phagocytosis, after being engorged with debris of degenerating myelin (Gefen et al. 2019).
With ageing, astrocytes also become reactive, showing increased expression of glial fibrillary acidic protein (GFAP) (Palmer and Ousman 2018; Hol and Pekny 2015). Pro-inflammatory activated microglia and reactive astrocytes are also present in AD and PD pathogenesis. This phenomenon occurs together with neuronal loss and increase in microglia proliferation (Figure 2.3A-2.3F) (Wyss-Coray 2016; Qian and Flood 2008; Joe et al. 2018; Clayton, Van Enoo and Ikezu 2017).
Figure 2.3: Staining of activated microglia in the white matter of the inferior frontal gyrus (A, B, C) and in corpus callosum (D, E, F). SuperAger – individual over the age of 85 whose memory test scores were at a level equal to or superior than scores of 50-to-65-year-olds. Normal Old - cognitively normal elderly over the age of 70; Young – cognitively normal young adult under the age of 24. From Gefen et al. 2019.
Activated microglia may also be involved in the generation of neuritic plaques seen in AD, either by secretion of Aβ or through the release of agents such as iron, which aggregates soluble Aβ fibrils (Wyss-Coray 2016). The progressive accumulation of iron is characteristic of ageing, and is exacerbated in selective brain regions in neurodegenerative disease, including the substantia nigra, leading to neurotoxicity (Ward et al. 2014; Hindle 2010).
Altered astrocytes contribute to a dysfunctional BBB with increased permeability (Yamazaki and Kanekiyo 2017), allowing activated peripheral blood immune cells, such as monocytes, to reach the
7 CNS. Monocytes differentiate into pro-inflammatory M1 macrophages, which produce cytokines and ROS, contributing to neuronal damage and death (Constantini, D’Angelo and Reale 2018).
In summary, neuro-inflammageing is a potential trigger of the functional changes that occur during normal and pathological ageing, and has a powerful effect on enhanced susceptibility to neurodegenerative diseases. Enhanced neuroinflammatory processes lead to loss of homeostasis in the brain environment, and, consequently, result in the death or dysfunction of neurons as seen in neurodegenerative disease.
3. Breast Cancer
Ageing is a major risk factor for the development of solid cancers (Zinger, Cho and Ben-Yehuda 2017; WHO 2011), with over 75% of all invasive cancers occurring in susceptible populations aged 55 years or older (Benz 2008). Moreover, the number of new cancer cases per year is expected to rise to 23.6 million by 2030 (National Cancer Institute 2019).
Breast cancer is also a disease primarily of older women, rarely occurring before age 30 and with the highest rates over 60 years of age (Fundo IMM Laço 2019). Over 1.5 million women (25% of all women with cancer) are diagnosed with breast cancer every year, making it the most common cancer in women worldwide and the second leading cause of cancer mortality in women (Sun et al. 2017).
The majority of breast cancers are of epithelial origin (carcinoma) and start from ductal hyperproliferation, with malignant connective tissue tumours (sarcomas) forming a negligible minority. Breast carcinomas have the potential to metastasize and can commonly transfer to distant organs such as the bones, liver, lung and brain, which mainly accounts for its mortality (Fentiman and D’Arrigo 2004; Sun et al. 2017).
Traditional breast cancer therapies include chemo- and radio-therapy. However, the treatment of breast cancer still remains a challenge due to its heterogeneous nature, which needs to be accounted for when choosing therapeutic options. Although more effective and individualized approaches to breast cancer treatment have been developed, in the past few years, there are still no targeted drugs approved for the most aggressive subtype — triple negative breast cancer (TNBC). The emergence of drug resistance also poses a threat to the successful therapy in molecular subtypes of breast cancer (BC) (Tong et al. 2018). It is therefore imperative to explore and design novel therapy alternatives, such as immunotherapy, considering that the role of the immune system in the emergence of breast cancer has been firmly established (Makhoul et al. 2018).
3.1. Breast cancer subtypes
Breast cancer is a heterogenous disease and can be classified into different subtypes with distinct biological features and different clinical implications (Dai et al. 2015). The subtyping of breast cancer has been performed based on histopathology, immunohistochemistry (IHC) markers and gene expression profiles, through the use of microarrays.
8
3.1.1. Histopathology
The histopathologic subtyping of breast carcinoma is based on its cytoarchitectural characteristics. Considering that it occurs in the mammary gland, the carcinoma is classified as in situ if it has not breached the epithelial component of the breast. Otherwise, if the carcinoma has invaded the breast stroma, it is considered invasive. Moreover, the carcinoma can be classified as ductal, if it originates from the inner lining epithelium of the ducts and lobules of the mammary gland, or lobular, if it arises from within the lobules that supply the ducts with milk (Dai et al. 2015). The combination of these features originates four different subtypes: invasive ductal carcinoma, ductal carcinoma in situ, invasive lobular carcinoma, and lobular carcinoma in situ. Invasive ductal carcinoma is the most common form of breast cancer, accounting for 50% to 70% of invasive breast cancers, while invasive lobular carcinoma accounts for 10% and is more likely to escape detection on mammography and physical examination (Alkabban and Fergunson 2019).
3.1.2. Immunohistochemistry markers
Breast cancer can be classified according to classical IHC markers, namely the oestrogen receptor (ER), progesterone receptor (PR) and the Human Epidermal growth factor Receptor 2 (HER2). Approximately 70% of all breast cancers are ER positive, meaning that oestrogen is able to bind to the ER in tumour cells, stimulating their division. Hence, ER positive tumours tend to respond well to endocrine therapy, using ER antagonists and oestrogen-producing enzymes inhibitors (Lumachi et al. 2013; Lange and Yee 2008). PR is expressed in over two-thirds of ER positive breast cancers and also has a role in the proliferation of tumour cells, in response to progesterone (Lim, Palmieri and Tilley 2016; Lange and Yee 2008). HER2 is an oncogene expressed in 20% to 30% of breast cancers, being associated with more aggressive cancers with higher recurrence and death rates. This receptor is established as a therapeutic target in HER2 positive patients, frequently using Trastuzumab, a monoclonal antibody, as a chemotherapy adjuvant (Mitri, Constantine and O’Regan 2012).
TNBC subtype does not express any of the aforementioned markers and therefore its treatment does not benefit from endocrine therapy. TNBC is typically an aggressive cancer, associated with poor prognosis and accounting for approximately 10% to 20% of all invasive breast cancers (Aysola et al. 2013). This cancer subtype does not respond well to current cancer immunotherapies and is treated almost exclusively with surgery, chemo- and radio-therapy (Feher 2017).
3.1.3. Gene expression profiling
Gene expression patterns of breast carcinomas were first assessed in a pioneering study by the Sørlie group (Sørlie et al., 2001). Using microarrays, they were able to characterize breast carcinomas at the molecular level, identifying five subtypes with distinct clinical outcomes: luminal A, luminal B, HER2 overexpression, basal and normal-like tumours. These subtypes are also associated with the IHC nomenclature, with exception of the latter.
Luminal A breast cancer is the most common subtype, accounting for approximately 50% of all invasive breast cancers (Makki 2015). It is usually also positive for ER, PR and HER2. Luminal B breast cancer is the second most common subtype, accounting for 20% of all invasive breast cancers (Makki 2015).
9 Like luminal A, it is positive for ER and PR. However, only part of these tumours express HER2, and are usually associated with worse prognosis, relative to luminal A. In general, luminal tumours are associated with good prognosis, responding well to endocrine therapy but poorly to conventional chemotherapy (Dai et al. 2015).
HER2 overexpressing tumours are negative for both ER and PR, and positive for HER2. These tumours, which are identified at the transcriptomic level, do not perfectly match tumours positive for HER2, identified through IHC. This subtype is associated with poor prognosis, mainly due to the fact that patients have a higher risk of relapsing (Dai et al. 2015).
Basal-like is a breast cancer subtype that has a tendency to affect younger women. It is typically a TNBC, and, although the latter comprises a more heterogenous group of tumours, there are studies defending that basal-like tumours should be divided into further categories, considering that patients may have divergent outcomes regarding mortality rates or recurrence (Milioli et al. 2017; Liu, Zhang and Zhang 2014). Like TNBC, the lack of hormone receptors leads to a limitation in therapeutic options, showing a lack of response to Trastuzumab and endocrine therapies. Thus, this subtype is usually associated with poor prognosis (Liu, Zhang and Zhang 1014; Makki 1015).
Normal-like tumours are TNBC distinct from basal-like, with an intermediate prognosis between the latter and luminal cancers. This subtype is poorly described and its clinical relevance is yet to be determined, due to the fact that it could be the result of technical artefacts from normal breast tissue contamination (Yersal and Barutca 2014; Wesolowski and Ramaswamy 2018).
3.2. The tumour microenvironment
The tumour microenvironment (TME) is an important determinant of the initiation, progression and metastasis of cancer. It consists of a complex and dynamic niche, made of extracellular matrix and cellular components. The main infiltrating cells include fibroblasts, neuroendocrine, adipose, and immune cells. Immune cells in the TME are both from the innate and immune system (Wang et al. 2017).
Despite the existence of different breast cancer subtypes and patient inter-variability, recent studies focused on the TME have been unveiling tumour-infiltrating immune cell patterns that are either correlated with poor patient prognosis or good outcome (Man et al. 2013; Fridman et al. 2010). One example of this relationship is the association between the infiltration of lymphocytes in breast tumours and prognosis. Amongst tumour-infiltrating lymphocytes (TILs), NK cells are able to naturally kill circulating tumour cells through cytolytic activity (Wu and Lanier 2003). However, while the role of NK cells outside the vascular system and in the tumour microenvironment still remains unclear in most cancer types (Larsen, Gao and Basse 2014), the association between high levels of CD8+ T cells and their anti-tumour effect is well established (Maimela, Liu and Zhang 2019). On the other hand, regulatory T (Treg) cells present immunosuppressive functions that are able to inhibit the cytotoxic activity of CD8+ T cells and NK cells, thus promoting tumour growth (Maimela, Liu and Zhang 2019). Tumour-infiltrating T cells have already been described as a key component of the tumour microenvironment, due to recent clinical trials that demonstrated the ability to durably control cancer in some patients by manipulating them (Sharma and Allison 2015). Tumour-associated myeloid cells, however, remain less studied than T cells, even though they comprise a significant part of the total
10 tumour immune cell infiltrates and have already been described as potent regulators of tumour-associated immune suppression, cell invasion and metastases (Weagel et al., 2015).
During tumour development, tumour cells secrete several cytokines, e.g., monocyte colony stimulating factor (M-CSF) and granulocyte-macrophage colony-stimulating factor (GM-CSF) (Tang et al. 1992; Kerkar and Restifo 2012). GM-CSF is a key factor in the differentiation of myeloid-derived suppressor cells (MDSCs). MDSCs are myeloid cells of granulocytic (neutrophil-like) or monocytic (monocyte-like) origin, induced into an immature and suppressor state. These cells are capable of not only supressing NK and CD8+ T cell anti-tumour activity, but also directly stimulating tumour cell proliferation, metastasis and angiogenesis (Kerkar and Restifo 2012; Mabuchi et al. 2018; Gonda et al. 2017). Moreover, GM-CSF, together with M-CSF, induce the recruitment of monocytes and their differentiation into non-polarized (M0) macrophages (Ushach and Zlotnik 2016; Qiu et al. 2018; Tang et al. 1992).
Tumour associated macrophages (TAMs) are a major component of the tumour microenvironment, reaching over 50% of the tumour mass in some breast cancers (Weagel et al., 2015; Qiu et al. 2018). Depending on the stimuli from the surrounding TME, macrophages are polarized into classically activated (M1) or alternatively activated macrophages (M2) and exert dual influences on tumourigenesis by either enhancing anti-tumour responses or by manifesting tumour-promoting activities, respectively. M2 macrophages have already been described as being potent regulators of tumour-associated immune suppression, cell invasion and metastasis. M2 macrophages aid in the process of angiogenesis, allowing new blood vessel growth, which feeds the malignant mass of cells (Weagel et al., 2015). Thus, their presence in tumour masses can be an indicator of poor prognosis in numerous cancer types, including breast cancer (Weagel et al., 2015; Cotechini, Medler and Coussens 2015; Gonda et al. 2017).
On the other hand, M1 macrophages are able to induce tumour-regression, through contact-dependent phagocytosis and cytokine production, and are usually associated with good prognosis (Poh and Ernst 2018). The contrasting roles of TAMs in breast cancer makes them an active topic of research, with the prospective of using these cells as targets in cancer immunotherapy, either by reducing the numbers of M2 macrophages and/or inducing re-polarization towards a M1 phenotype (Poh and Ernst 2018).
3.2.1. Immunosenescence and macroph-ageing
Throughout the course of life, the immune system keeps surveilling the organism for foreign pathogens, such as bacteria and viruses, and pre-cancerous and cancerous cells. This is a process known as immunosurveillance (Smyth, Dunn and Schreiber 2006). However, there is a gradual decline of the immune system with age, which is defined as immunosenescence (Zinger, Cho and Ben-Yehuda 2017). This deterioration leads to alterations in the proportion of different immune cell types in the organism and in their capabilities, including a decrease in the number of naïve CD8+ and CD4+ T cells (Pawelec 2017), impaired function of mature lymphocytes, and a decrease in the number and the phenotypic alteration of natural killer (NK) cells (Zinger, Cho and Ben-Yehuda 2017; Montecino-Rodriguez, Berent-Maoz and Dorshkind 2013). There is also evidence for an increase in myeloid-lineage cells (Montecino-Rodriguez, Berent-Maoz and Dorshkind 2013), which is coupled with reduced anti-tumour activity in macrophages and their predisposition for a pro-tumour phenotype (Figure 3.1) (Provinciali et al. 2017).
11
Figure 3.1 Schematic representation of immune cell immunosenescence-related changes. Adapted from Costantini, D'Angelo, and Reale 2018.
Macroph-ageing was defined by the Franceschi group (Franceschi et al. 2006) as the chronic macrophage activation, one of the major factors responsible for the pro-inflammatory state associated with ageing. Macroph-ageing and inflamm-ageing occur in association with immunosenescence, and lead to the reduction in the efficacy of the immune response, resulting in decreased immunosurveillance and anti-tumour effector function (Costantini, D'Angelo, and Reale 2018).
Increasing breast cancer rates with ageing have already been associated with immunosenescence. This association might not only impact the incidence and progression of breast cancer, but also the effectiveness of immunotherapy due to compromised immunosurveillance (Provinciali et al. 2017). The efficacy of more traditional cancer therapies, such as chemo- and radio-therapy, may also be impacted, given that they are at least partially dependent of tumour-specific immune responses and their ability to bring back immunosurveillance (Bracci, Schiavoni and Sistigu 2013; Kroemer et al. 2015). Therefore, the characterization of tumour-infiltrating immune cells may disclose better strategies for overcoming immune suppression and restoring immunosurveillance.
4. Single-cell transcriptomics
In the 17th century, Robert Hooke first used a microscope to describe little boxes distinct from one another in cork, which he named cells (Hooke 1665). Today, it is universally accepted that the cell is the unit of life, all cells come from pre-existing cells and all living organisms are composed of different cell types that share common basic features, but may vary vastly in their function and molecular profile (Feher 2017).
12 It is important to assess this cell heterogeneity in order to understand fundamental biological processes in health and disease, allowing for the improvement of existing therapies and the discovery of new ones (Hwang, Lee and Bang 2018). One way to do this is through single-cell RNA sequencing (scRNA-seq). scRNA-seq was first described in 2009 by Tang et al. and has since been gaining widespread popularity as a method to survey the diversity of cell types within a tissue sample. Its underlying principles are the same as in bulk RNA-sequencing (RNA-seq), an approach that uses sequencing technologies to profile the transcriptome, i.e., the complete set of RNA molecules in a biological sample, thereby allowing to quantify and assess differential gene expression between conditions of interest (Wang, Gerstein and Snyder, 2009). However, common bulk RNA-seq experiments measure gene expression levels as averages across populations of cells, under the assumption that tissues are composed of homogeneous populations of cells, only allowing the characterization of population-level gene expression. These methods are therefore insufficient for studying heterogeneous cellular systems due to the likelihood of missing important cell-to-cell variability (Hwang, Lee and Bang 2018). scRNA-seq experiments measure the distribution of expression levels for each gene in each cell, allowing to characterize a population of individual cells and to better understand gene expression patterns in complex heterogeneous tissues (Wang et al. 2018).
Although the development of scRNA-seq protocols was motivated by the need to study conditions where only a small amount of material was available, such as cells from the early embryonic development, protocol improvements and massively parallel sequencing platforms boosted an increase in the number of cells studied in these analyses, ranging from only a few cells to hundreds of thousands of single cells per study (Figure 4.1) (Tang et al. 2009; Svensson, Vento-Tormo and Teichmann 2018). This continuous evolution is radically improving the dissection of heterogeneity within cell populations, with many applications in diverse fields. One example is the deconvolution of highly diverse immune cell populations in health and disease (Hwang, Lee and Bang 2018; Papalexi and Satija 2017), which has been applied in the cancer research field, by enabling the estimation of specific immune cell composition of solid tumours (Schelker et al. 2017), and in the neurosciences research field, by allowing the characterization of neuronal and non-neuronal cell diversity across multiple human brain regions (Spaethling et al. 2017; Darmanis et al., 2015).
13
4.1. The technology of single-cell RNA sequencing
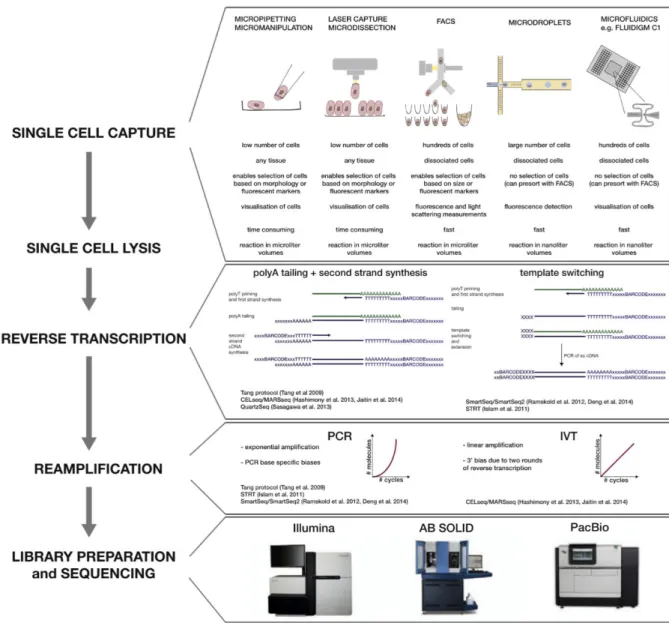
Every scRNA-seq experiment shares a common basic strategy, starting with tissue dissociation, sorting and isolation of single cells, followed by reverse transcription of mRNA, amplification of cDNA and, finally, library preparation and sequencing. Like in bulk RNA-sequencing, most protocols use the Illumina platform for sequencing. Thus, the major difference between bulk RNA-seq and scRNA-seq protocols is the sorting step.
There are several methods that can be used to sort cells, including the ones that capture only a small number of cells with high level of supervision, such as micromanipulation and laser capture microdissection (LCM), and automatic microfluidic methods which focus mainly on high throughput (Figure 4.2).
Micromanipulation consists of using microscope-guided capillary pipettes to extract single cells, while LCM uses a laser to attach individual cells from a tissue to a thin film that can be eliminated afterwards. These low throughput methods have the advantage of ensuring that only one cell is captured at a time, and allow the verification of cell viability and morphologic features through microscopic supervision (Kolodziejczyk et al. 2015).
Microfluidic platforms, on the other hand, allow sorting hundreds of single cells in each run. They consist of using integrated fluidic circuits to capture cells and isolate them in individual channels. Cell capture is followed by automated reverse transcription and pre-amplification in nanoliter volumes, which allows to control for reagent costs. One of the most common microfluidic platforms is the Fluidigm C1 (Gong, Do and Ramakrishnan 2018). However, this method possesses several restrictions, such as the limited size of the capturing sites, which implies that cells must also be relatively homogenous in size, and the low yield of captured cells, considering the need to input at least 1,000 cells to recover 96 per chip. To surpass these limitations, micro-droplet-based microfluidic platforms were developed. These do not use capturing sites, but instead encapsulate cells in oil droplets, together with the reagents needed for reverse transcription and amplification. Micro-droplet technologies, such as the 10X Genomics chromium system (See et al. 2018), are gaining popularity in the scRNA-seq field, due to escalating captured cell numbers up to thousands of cells per run, while also increasing yield up to 50% (Kolodziejczyk et al. 2015; Gong, Do and Ramakrishnan 2018).
14
Figure 4.2: Steps of a scRNA-seq protocol with different experimental approaches. From Kolodziejczyk et al. 2015.
4.1.1. Number of cells vs sequencing depth
The high number of samples used in scRNA-seq means that these assays usually involve a trade-off between the number of cells and sequencing depth, i.e., the number of RNA transcripts sequenced per cell. There is a direct dependence of cell type classification on sequencing depth, meaning that the resolution with which we are able to distinguish different cell types is dependent on the depth of cellular profiling (Streets and Huang 2014).
Previous systematic analyses of how the transcriptional identity of a cell is preserved, as sequencing depth is decreased, concluded that a majority of the primary genes that contribute to transcriptional variance among diverse types of cells are identified by low-coverage sequencing analysis, preserved in sequencing depths as low as 10,000 reads per cell. Cells with subtle transcriptional differences, such as neural cells at different stages of development, are distinguishable with a sequencing depth of about 50,000 reads per cell (Figure 4.3) (Streets and Huang 2014).
15
Figure 4.3: Relationship between sequencing depth and cell type identification. Resolution of different cell types and states increases with sequencing depth. Cells from different organs can be distinguished with less than 10,000 reads, while cells from the same type and at different stages of development can be identified with about 50,000 reads per cell. Adapted from Streets and Huang 2014.
Nevertheless, accurate estimation of sequencing depth per experiment should take into account both total mRNA content in individual cells and the diversity of mRNA species in those cells. Different scRNA-seq protocols with different cell number and sequencing depth capacities can be used in an integrated approach, whereby complex tissues are first discriminated using low-depth droplet-based technologies to identify new and/or rare populations of interest and their associated markers. Subsequently, these markers can be used for enrichment and deep sequencing using high-depth and low throughput approaches (Baran-Gale, Chandra and Kirschner 2017; Papalexi and Satija 2018).
4.2. Computational analysis
In scRNA-seq, each library represents a single cell rather than a population of cells, as is the case for bulk RNA-seq. Working with minute amounts of mRNA means that only 10%–20% of transcripts in a cell get reverse transcribed, leading to high technical noise, especially noticeable in lowly expressed genes (Kolodziejczyk et al. 2015).
The sources of discrepancy between libraries arise mostly from amplification bias and gene dropouts. Dropouts occur when a gene is expressed at moderate level in one cell, but fails to be captured in another cell, usually due to failures in reverse transcription. This binary modality in gene expression associated with zero-inflation is usually modelled in methods developed specifically for scRNA-seq data analysis (Sekula, Gaskins and Datta 2019).
Given that scRNA-seq is a relatively recent technology, currently there is still no gold standard pipeline to analyse this type of data. This leads to an underlying challenge in scRNA-seq data analysis, considering the vast variability between different datasets regarding experimental design, number of