IVALDO MARTINS BOGGIONE1, CAMILO DE LELIS TEIXEIRA DE ANDRADE2,
JOÃO CARLOS FERREIRA BORGES JÚNIOR3 and JOÃO HERBERT MOREIRA VIANA2
1Emater, Belo Horizonte, MG, Brasil, [email protected];
2Embrapa Milho e Sorgo, Sete Lagoas, MG, Brasil, [email protected], [email protected]; 3Universidade Federal de São João del-Rei, Sete Lagoas, MG, Brasil, [email protected]
Revista Brasileira de Milho e Sorgo, v.17, n.2, p. 201-215, 2018
ABSTRACT – In Brazil, the rainfed maize crop may undergo yield breaks due to uncertainties in the rainfall
distribution. Irrigation can be a management alternative that, however, requires evaluation and planning to be helpful. The objective of this work was to analyze the simulated yield data of irrigated maize in counties of Minas Gerais state, Brazil. The CSM-CERES-Maize model was used to simulated weekly sowings of maize considering optimum agronomic conditions. A sprinkler irrigation scheme with 80% efficiency was used with automatic applications when the crop withdrew 50% of the soil available water. The harvest was scheduled to happen automatically when the crop had reached physiological maturity. The results were statistically analyzed for each county, based on goodness of fit test, ANOVA, Tukey’s test and risk analysis (stochastic dominance). The most promising sowing period was from January 16 to March 27 for all locations, except for Janaúba, for which the best sowing window was from November 14 to January 2. The treatments of highest average simulated maize yield stochastically dominated the other treatments evaluated. The CSM-CERES-Maize model proved to be a useful tool to help making decision in irrigated maize crop systems.
Keywords: Zea mays L., CSM-CERES-Maize, DSSAT, risk analysis.
MODELAGEM APLICADA A DATAS DE SEMEADURA DE MILHO IRRIGADO RESUMO – No Brasil, a produção de milho de sequeiro pode sofrer quebras de rendimento devido a irregularidades na
distribuição de chuvas. A irrigação pode ser uma alternativa de manejo que, todavia, requer avaliação e planejamento para ser benéfica. O objetivo deste trabalho foi analisar a produtividade simulada de milho irrigado em municípios do estado de Minas Gerais, Brasil. O modelo CSM-CERES-Maize foi utilizado para simular semeaduras semanais de milho, assumindo condições agronômicas ótimas. Considerou-se um esquema de irrigação por aspersão com 80% de eficiência, com aplicações automáticas quando a planta extraísse 50% da água disponível do solo. A colheita foi programada para acontecer automaticamente quando a cultura atingisse a maturidade fisiológica. Os resultados foram estatisticamente analisados para cada município, com base em teste de aderência, ANOVA, teste de Tukey e análise de risco (dominância estocástica). O período de semeadura mais promissor foi de 16 de janeiro a 27 de março, para todos os locais, exceto Janaúba, em que a melhor janela de semeadura foi de 14 de novembro a 2 de janeiro. Os tratamentos de maior rendimento médio simulado de milho dominaram estocasticamente os demais tratamentos avaliados. O modelo CSM-CERES-Maize demonstrou ser uma ferramenta útil para auxiliar na tomada de decisão em sistemas de produção de milho irrigado.
Brazil is the third world largest maize producer. In some regions, the sowing season takes place twice a year. In the first growing season, at the traditional producing regions, the rainfall amounts can supply the crop water requirement, however, dry spells can occur. Currently, Minas Gerais is the leading state in maize production during this first growing period. It is expected to represent 19% of all national production for the 2016-2017 season (Acompanhamento da Safra Brasileira [de] Grãos, 2017). In a same sowing date, simulated maize yield for Janaúba, MG, Brazil, was sometimes above and sometimes below average due to water deficit (Alves et al., 2011). For the central region of Paraná state, Brazil, Wagner et al. (2013) concluded that maize yield is affected by the soil-water availability throughout the crop season and that the average probability of yield reduction due to water deficit is about 50%.
For the year of 2017, it was estimated that 61.3% of the national maize production will come from the off-season growing period (Acompanhamento da Safra Brasileira [de] Grãos, 2017), which is subjected to uncertainties due to climate elements’ variability (Soler et al., 2010). In a study using computer modeling, Cardoso et al. (2004) found that rainfed maize sowed off-season in northern Paraná state, Brazil, suffers yield breaks and cycle interruption due to lack of rainfall and low temperatures.
The use of irrigation eliminates the risk of maize yield loss due to water stress. Another simple management strategy is setting sowing periods for which high yields are more likely. This can be facilitated using computational models applicable to agricultural systems. These computer-implemented models, representing mathematically the soil-plant-atmosphere system, have been developed and applied in various countries (Katerji et al., 2013; Singh et al.,
2014; Negm et al., 2014; Kadiyala et al., 2015; Li et al., 2015). Calibrated crop models have the potential to be used as tools in studies of agricultural zoning and to establish sowing dates (Andrioli & Sentelhas, 2009). More recently, computer models have also been utilized in studies related to the impact of climate change on agricultural crops (Islam et al., 2012; Singh et al., 2014; Moradi et al., 2014).
DSSAT (Decision Support System for Agrotechnology Transfer) models cover 42 crops (Hoogenboom et al., 2017), including grain sorghum, wheat, millet, rice and maize (Negm et al., 2014; Kadiyala et al., 2015). The CSM-CERES-Maize is a deterministic model widely tested for different types of soils, climates and maize cultivars around the world (Jones et al., 2003; Soler et al., 2007; Liu et al., 2011; Salazar et al., 2012; Anothai et al., 2013; Li et al., 2015). It was employed to evaluate the off-season yield of four maize hybrids in Piracicaba, SP, Brazil, under rainfed and irrigated conditions, confirming the model accuracy to simulate crop cycle and yield (Soler et al., 2007).
The rainfed maize crop zoning was established in Minas Gerais state, Brazil, due to climate risk using the CSM-CERES-Maize model, which provided the advantage of obtaining yield estimates in addition to the sowing periods (Paixão et al., 2014). The DSSAT model was applied to simulate long-term trends in maize and wheat yield and the soil carbon and nitrogen dynamics using 14 years of weather data of northwestern China (Li et al., 2015). The authors found that the model could contribute to the definition of optimal management practices.
The objective of this work was to analyze, through the application of CSM-CERES-Maize model, the variation of irrigated maize yield in six counties of Minas Gerais state, Brazil, for different sowing dates throughout the year.
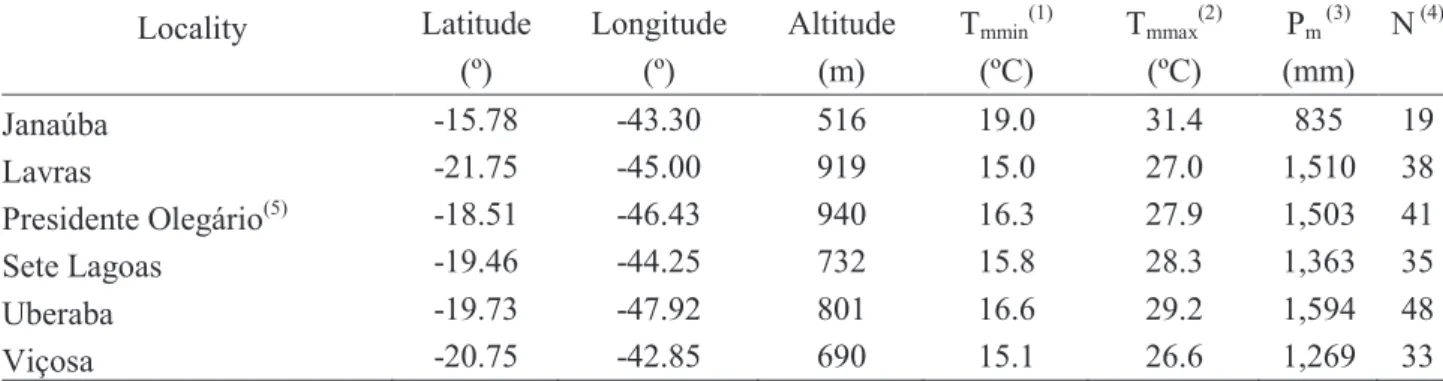
Table 1. Coordinates, average minimum temperature, average maximum temperature, average annual precipitation and number of years considered in the analysis.
(1) Average minimum temperature; (2)average maximum temperature; (3)average annual precipitation; (4)number of years considered in
the analysis; equivalent to the number of replicates per treatment; (5)Meteorological station of Patos de Minas. Material and Methods
The CSM-CERES-Maize model of DSSAT, version 4.5.1.023, previously parameterized for the single-cross hybrid DKB390YG (Amaral et al., 2011), was used in the study. Weather data from six counties of Minas Gerais state, Brazil (Janaúba, Lavras, Presidente Olegário, Sete Lagoas, Uberaba and Viçosa), were downloaded from the database of the National Institute of Meteorology (INMET) and were used as input in the model. For each county, 48 years (1961-2009) of observed daily data of maximum and minimum temperatures (°C), precipitation (mm) and solar radiation (MJ m-2day-1) were used. Discarding
some of the years of this period was necessary due to missing information and some anomalies in the dataset (Boggione, 2014). Information on elevation, latitude, longitude and number of years used in the simulations for each county, are presented in Table 1.
Samples were taken in the mid portion of five soil profile layers: 0 to 0.05 m 0.05 to 0.20 m, 0.20 0.40 m, 0.40 to 0.70 m and from 0.70 to 1.00 m. Data on soil particle size, bulk density, porosity, saturated hydraulic conductivity and soil upper and lower
limits of available water, required by the model, were obtained using standard methods of analysis (Boggione, 2014). To adequately represent the natural drainage conditions of tropical soils, data on total soil porosity estimated from the data of soil density and soil particle size were reduced by 5%. As the upper limit of available water (field capacity), it was used the soil-water content in equilibrium with -2 and -30 kPa, depending on the soil particle size (Table 2).
We used the seasonal analysis tool of DSSAT to simulate the weekly maize sowing dates, repeated every year for which meteorological data was available. The crop management files were prepared considering a high-yield maize cultivar, grown without water, nutrient and pest stresses. The simulations considered a no-tillage system, having dry beans as the previous crop, which left at the soil surface to the subsequent maize crop about 3,600 kg ha-1 of straw with 20% of nitrogen and 1.8% of
phosphorus. Sowing was performed at depth of 0.05 m, row spacing of 0.70 m and a population of 68,000 plants per hectare, as established in previous work (Tigges et al., 2016). As there was no data on initial soil-water content and soil nitrate and ammonium
Locality Latitude Longitude Altitude Tmmin(1) Tmmax(2) Pm (3) N (4)
(º) (º) (m) (ºC) (ºC) (mm) Janaúba -15.78 -43.30 516 19.0 31.4 835 19 Lavras -21.75 -45.00 919 15.0 27.0 1,510 38 Presidente Olegário(5) -18.51 -46.43 940 16.3 27.9 1,503 41 Sete Lagoas -19.46 -44.25 732 15.8 28.3 1,363 35 Uberaba -19.73 -47.92 801 16.6 29.2 1,594 48 Viçosa -20.75 -42.85 690 15.1 26.6 1,269 33
concentrations for each sowing date and year, the model was set to start the simulations three months before the sowing date.
It was considered a sprinkler irrigation system, with 80% application efficiency, set to automatically irrigate the maize crop. The irrigation was triggered when the simulated soil-water content at the 0 to 0.20 m soil layer corresponded to 50% of the total soil-water availability. It was also assumed a nitrogen fertilization rate that allowed the cultivar to express its genetic yield potential without nitrogen stress. The harvest was scheduled to happen automatically when the crop had reached physiological maturity. The Priestley–Taylor and FAO-56 Penman–Monteith methods are the only options in DSSAT to estimate potential evapotranspiration. The Priestley-Taylor method is a simplified version of combined equations (e.g. Penman-Monteith) having a dimensionless empirical coefficient which can be locally adjusted to reduce inaccuracies due to non-consideration of the aerodynamic component. Since no wind speed and relative humidity data were available the Priestley-Taylor method was used (Anothai et al., 2013).
As for the output data, grain yield, expressed as dry matter, was corrected to 13% moisture. In order
to analyze the impact of solar radiation on yield, three phases along the maize cycle were selected: Phase 1 (vegetative phase, from emergence to anthesis); Phase 2 (reproductive phase, from anthesis to 15 days after that event); and Phase 3 (grain filling phase, 15 days after anthesis to physiological maturity). To extract the solar radiation values accumulated for each period, the meteorological data were post-processed using macros in a spreadsheet.
The statistical analysis consisted of goodness of fit test, ANOVA, Tukey’s test and risk analysis. It was considered 52 treatments in a completely randomized design. The treatments were weekly sowing dates sequentially numbered over the year. The first treatment (T1) and the last treatment (T52) refer to the August 1 and July 24 sowing dates, respectively. Each year was considered a replication. The goodness of fit test aimed to verify the adequacy of the analysis of variance and support the risk analysis. The crop yield output data for each treatment was checked for normal distribution, by using the @RISK program, version 6 (Palisade Corporation). The goodness of fit test used was the Kolmogorov-Smirnov at a significance level of 5% as used in the F and Tukey tests. The analysis of variance by F test and Tukey’s test was performed Table 2. Water content at wilting point (θPM) and at field capacity (θCC) in the layer from 0.05 to 0.20 m for the six locations.
(1) Data not considered for the soil of the county.
Locality Texture (at -1.500 kPa) θPM (at -30 kPa) θCC (at -2 kPa) θCC (m³ m-3)
Janaúba Clay 0.219 0.303 - (1)
Lavras Very Clay 0.207 0.286 - (1)
Presidente
Olegário Very Clay 0.211 0.296 - (1)
Sete Lagoas Clay 0.249 0.310 - (1)
Uberaba Loamy-Clay-Sand 0.117 - (1) 0.409
using the Excel spreadsheet (Microsoft Corporation), developing specific macros for the latter.
The @RISK program was used to verify the stochastic dominance on the risk analysis of three selected treatments for each county. It was selected the treatment with the highest average yield, the first for which the yield was statistically different by Tukey’s test, and the one that required the lowest irrigation depth (Boggione, 2014).
Results and Discussion
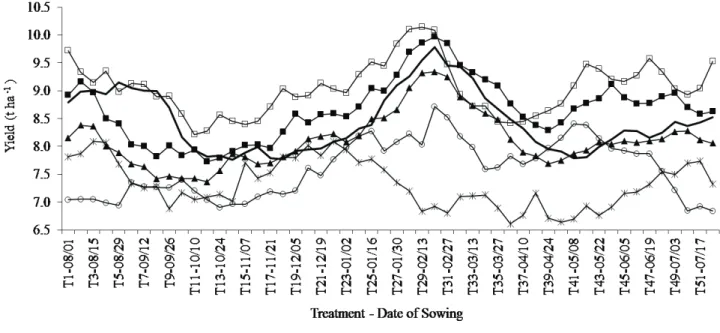
Analyzing the average simulated crop yield (Ym) for sowing dates (treatments) over the year, it was observed a trend of yield peak synchronization in five out of the six counties (Figure 1). For Lavras, Presidente Olegário, Sete Lagoas, Uberaba and Viçosa, the highest average yield occurred between
treatments 25 and 35, which encompasses the sowing period of first half of January to first half of March, with yield peaks occurring from 13 to 20 of February. For Janaúba, it was observed yield peaks between treatments 16 and 23, corresponding to sowings from the second half of November to the second half of December; a period with relatively low average yield in other counties. For this county, secondary peaks of high crop yield were observed for the treatments 3 and 4.
When applying the CSM-CERES-Maize model, for an off-season maize crop in Londrina, PR, Brazil, Cardoso et al. (2004) found that the highest potential yields were generally obtained for the first ten days of February and the smallest for the third ten days of March. The authors attributed the decrease in yield for sowing in March to less solar radiation availability and to the occurrence of low
Figure 1. Average simulated crop yield obtained for the different treatments (T1 refers to the sowing on August 1 and T52 to the sowing on July 24) for the six counties.
temperatures. The off-season sowing dates effect on four irrigated maize hybrids was studied by Soler et al. (2007) by applying the CSM-CERES-Maize model for Piracicaba, SP, Brazil. A positive difference of 21% in yield was found for sowing on February 1 as compared to that obtained for sowing on April 15.
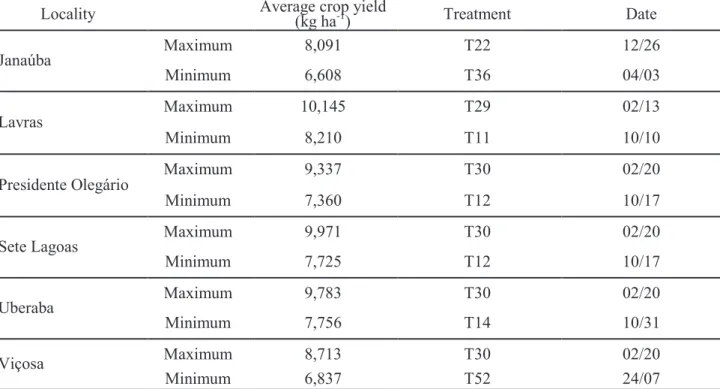
The amplitude between the maximum and minimum average simulated yield varied from 1483 to 2246 kg ha-1 for Janaúba and Sete Lagoas, respectively
(Table 3). A greater diversity of sowing dates was found for which we obtained minimal average yields compared to sowing dates that provided the highest yields. Still, at least in four locations we obtained close sowing dates. The lowest average yields were identified for sowings occurring in October in Lavras, Presidente Olegário, Sete Lagoas and Uberaba. In Janaúba and Viçosa, the treatments that led to lower average yields correspond to sowing in April and
July, respectively. The present study confirms the work done by Amaral et al. (2011), which applied the CSM-CERES-Maize model for the DKB390YG hybrid, irrigated by center pivot in the region of Sete Lagoas, MG, Brazil. In this work, the best sowing date was February 20, corresponding to T30, and the smaller yields occurred in October.
The highest average yields obtained in most of the years for sowing in February is due to the crop growth and development occurring during a period with high solar radiation incidence. For sowing dates in February, another favorable factor is the variation of the air temperature, with the occurrence of lower nighttime temperatures. For sowing periods that led to the lowest average simulated yields, obtained mainly in October, it was observed that there were high nighttime temperatures and high number of cloudy days. The prevalence of nighttime temperatures
Locality Average crop yield(kg ha-1) Treatment Date
Janaúba Maximum 8,091 T22 12/26
Minimum 6,608 T36 04/03
Lavras Maximum 10,145 T29 02/13
Minimum 8,210 T11 10/10
Presidente Olegário Maximum 9,337 T30 02/20
Minimum 7,360 T12 10/17
Sete Lagoas Maximum 9,971 T30 02/20
Minimum 7,725 T12 10/17
Uberaba Maximum 9,783 T30 02/20
Minimum 7,756 T14 10/31
Viçosa Maximum 8,713 T30 02/20
Minimum 6,837 T52 24/07
Table 3. Highest and lowest values of simulated average crop yield and respective sowing dates obtained with the CSM-CERES-Maize model.
above 24°C, entails high energy consumption due to the increase in cell respiration, which leads to a low photoassimilate balance and low crop yield. The period around maize anthesis is the one most sensitive to high temperatures (Moradi et al., 2014), which should be considered for sowing date definition. The lower maize yield observed in one of the years of study in counties of Nebraska, USA, was due to higher nighttime temperatures, combined with low solar radiation incidence after the silking stage, factors that led to a reduced grain filling period (Grassini et al., 2011).
The average low yield observed for Janaúba throughout the year, as compared to other locations, can be explained by the different climate conditions of that county. Despite the high solar radiation availability, the prevailing high temperatures in the region, especially during the nighttime, consisted in a yield reduction factor. In a study on the impact of climate change carried by applying a combination of RZWQM and DSSAT models for maize growing conditions of Colorado, USA, it was observed a
negative effect of rising temperatures on yield, even under conditions of full irrigation (Islam et al., 2012).
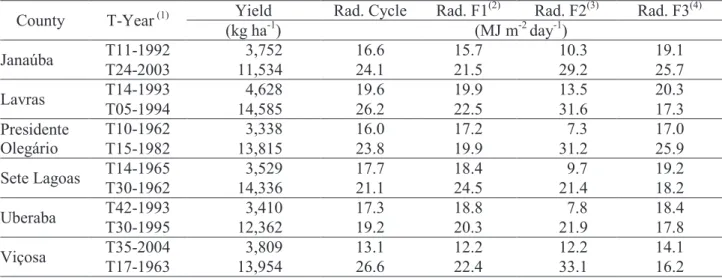
No correlation was found between data of mean crop yield (Ym) and average daily solar radiation. However, by separately analyzing crop yield values (Y) obtained by treatment per year, it was found a correlation with solar radiation, particularly that which occurs in phase 2 (Table 4), refereed as that which extends for 15 days after anthesis. It was observed minimal overall yield for treatments for which occurred low values of daily solar radiation in phase 2, as compared to the average daily radiation in the cycle or phase 1 and 3. One exception was verified for Viçosa, in which low average daily solar radiation for the entire cycle was found for the treatment of minimal crop yield. Regarding the maximum crop yield, we found highest daily solar radiation values in phase 2 for Janaúba, Lavras, Presidente Olegário and Viçosa, however, no relation between high levels of daily solar radiation, specifically in phase 2, and maximum crop yield was pointed out for Sete Lagoas and Uberaba.
County T-Year (1) Yield Rad. Cycle Rad. F1(2) Rad. F2(3) Rad. F3(4)
(kg ha-1) (MJ m-2 day-1) Janaúba T11-1992 T24-2003 11,534 3,752 16.6 24.1 15.7 21.5 10.3 29.2 19.1 25.7 Lavras T14-1993 T05-1994 14,585 4,628 19.6 26.2 19.9 22.5 13.5 31.6 20.3 17.3 Presidente Olegário T10-1962 T15-1982 13,815 3,338 16.0 23.8 17.2 19.9 31.2 7.3 17.0 25.9 Sete Lagoas T14-1965 T30-1962 14,336 3,529 17.7 21.1 18.4 24.5 21.4 9.7 19.2 18.2 Uberaba T42-1993 T30-1995 12,362 3,410 17.3 19.2 18.8 20.3 21.9 7.8 18.4 17.8 Viçosa T35-2004 T17-1963 13,954 3,809 13.1 26.6 12.2 22.4 12.2 33.1 14.1 16.2 Table 4. Simulated maximum and minimum crop yield by county and average daily solar radiation (Rad.) during the crop cycle and phases.
Bert et al. (2007), in a study conducted in the Argentine Pampas, found that the CSM-CERES-Maize showed greater sensitivity to solar radiation input data as compared to soil input data (N content at harvest time, organic matter content, soil’s capacity to retain water, etc.).
As expected, the simulations did not show risk of crop loss in irrigated systems, which may occur as a consequence of unfavorable distribution of temperature or solar radiation during the cycle, even if there is no water deficit. However, it is noteworthy that there is uncertainty in estimates of crop yield with the CSM-CERES-Maize arising from factors not considered in the model, such as weather short-term events (high intensity rains, high wind speeds, hail, etc.), as reported by Liu et al. (2011). In critical instances, such factors could cause significant crop yield losses.
The goodness of fit analysis applied to treatments and localities for the output variable crop yield indicated adjustment to the normal distribution at a significance level of 5% by Kolmogorov-Smirnov
test, to 94.2%, 98.1%, 84.6%, 92.3%, 86.5% and 92.3% of the cases, respectively, for Janaúba, Lavras, Presidente Olegário, Sete Lagoas, Uberaba and Viçosa. Therefore, the trends of medians are similar to the trends found for average simulated crop yield for sowing dates (treatments) over the year, as can be observed in Figures 2 to 7. In the notched box plots presented in these figures for each county, notch indicate the confidence interval for the median (M) which is based on the formulaM ±1.57IQR N, where IQR and N are interquartile range and number of observations (Table 1), respectively. IQR is also showed in box plots, as upper and lower whiskers and outliers (open circles). There is strong evidence to differences in two medians if respective notches do not overlap. Although it is an irrigated crop, we observed variable volatility of crop yield related to sowing dates throughout the year (treatments), as can be seen by the variation on the IQR and amplitude between whiskers (Figures 2 to 7). Alves et al. (2011) also observed an interannual variability in maize grain
Figure 2. Notched box plot for Janaúba (treatments 1 and 52 refer to the August 1 and July 24 sowing dates, respectively).
yield, even under adequate soil moisture conditions through irrigated management, proving that other environmental factors, besides water stress, affect significantly the crop yield. Thus, the simulated variability in crop yield was a result of annual differences in distributions of temperature and solar radiation. High and low outliers were commonly found for different counties and treatments.
The F-test indicated rejection of the null hypothesis for all locations. By Tukey’s test, it was found that the lower least significant difference of the average yield values occurred for Uberaba (836 kg ha-1) and the largest for Viçosa (1506 kg ha-1).
Considerably heterogeneous treatments regarding average crop yield were classified in the same stratum with no statistical difference. The number of treatments in the first stratum, i.e., one that includes the treatment with the largest simulated average crop yield, was 13 for Presidente Olegário and Uberaba, 23 for Sete Lagoas, 31 for Viçosa, 36 for Lavras and 50 for Janaúba, of a total of 52 treatments per location.
This variation had a strong negative correlation with the number of years (replications), considered in the analysis for each location.
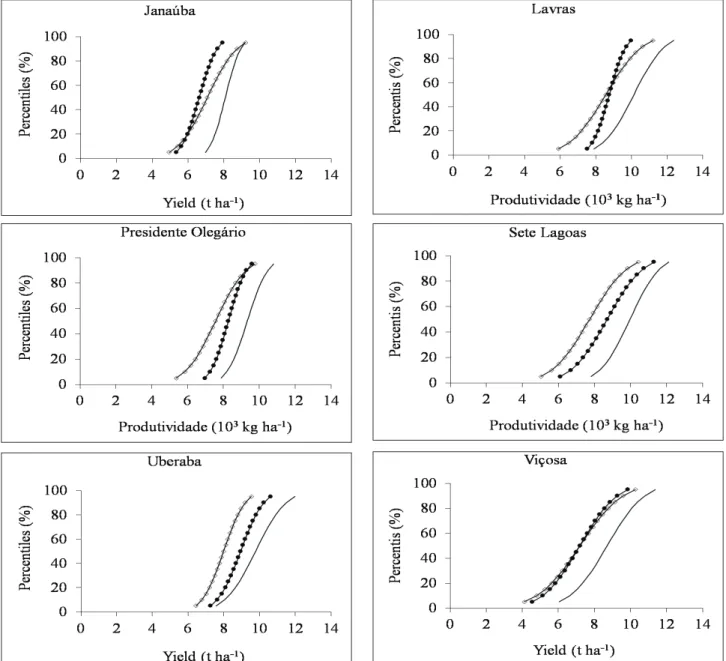
Considering the variability of the crop yield values, even if mitigated by the use of irrigation, the risk analysis based on the study of the cumulative probability function becomes a necessary tool for determining the most promising sowing windows, thus complementing the analysis of contrasts between means using the Tukey’s test. The treatments selected for the evaluation of cumulative probability functions are indicated in Table 5. As shown in Figure 8 to all locations, the treatment of highest simulated average crop yield presented stochastic dominance of first degree in relation to others, which can be seen by the right most position of the cumulative probability function curve for this treatment compared to others curves. For the first treatment to differ statistically from that of the highest average crop yield, it was found first-degree stochastic dominance in Sete Lagoas and Uberaba, and second-degree
Figure 3. Notched box plot for Lavras (treatments 1 and 52 refer to the August 1 and July 24 sowing dates, respectively).
Figure 4. Notched box plot for Presidente Olegário (treatments 1 and 52 refer to the August 1 and July 24 sowing dates, respectively).
Figure 5. Notched box plot for Sete Lagoas (treatments 1 and 52 refer to the August 1 and July 24 sowing dates, respectively).
Figure 6. Notched box plot for Uberaba (treatments 1 and 52 refer to the August 1 and July 24 sowing dates, respectively).
Figure 7. Notched box plot for Viçosa (treatments 1 and 52 refer to the August 1 and July 24 sowing dates, respectively).
stochastic dominance in Lavras and Presidente Olegário regarding the treatment of lowest irrigation requirement. For Janaúba, second-degree stochastic dominance was observed for the treatment of lowest
irrigation requirement compared to the first treatment statistically different from that of highest average crop yield. For Viçosa, the treatments for these two curves were almost overlapped.
Figure 8. Cumulative probability versus simulated grain yield for the treatment with the highest average crop yield, for the first to differ statistically from the best evaluated for average crop yield and to treatment with lowest irrigation requirement.
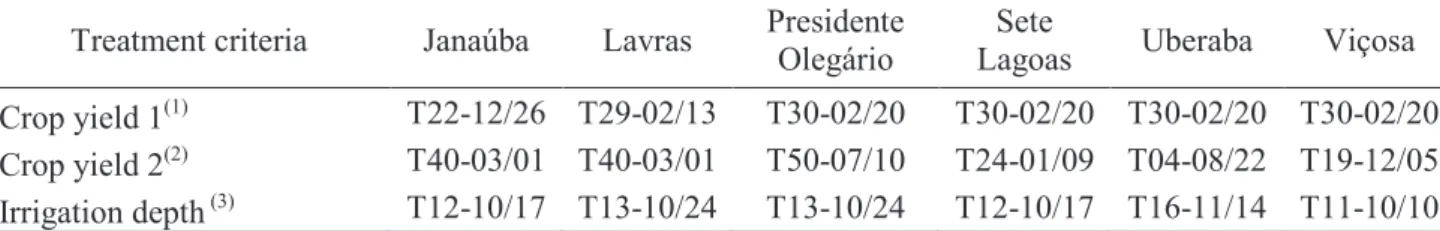
Table 5. Treatments and selected sowing dates for risk analysis.
(1) Treatment with highest simulated average crop yield. (2) First treatment statistically different, in relation to simulated crop yield, to
the treatment with highest simulated average crop yield. (3) Treatment with lowest simulated irrigation depth.
Treatment criteria Janaúba Lavras Presidente Olegário Lagoas Sete Uberaba Viçosa
Crop yield 1(1) T22-12/26 T29-02/13 T30-02/20 T30-02/20 T30-02/20 T30-02/20
Crop yield 2(2) T40-03/01 T40-03/01 T50-07/10 T24-01/09 T04-08/22 T19-12/05
Irrigation depth (3) T12-10/17 T13-10/24 T13-10/24 T12-10/17 T16-11/14 T11-10/10
Conclusions
The CSM-CERES-Maize model proved to be a useful tool in providing information regarding the variability of irrigated maize yield in the selected counties, allowing the sowing window establishing and the temporal synchrony analysis of the intra-annual crop yield variation among the counties.
Through the use of risk analysis software, it is possible to verify the stochastic dominance, which is a necessary tool to decision-makers for determining the most promising sowing window of irrigated maize.
Acknowledgements
The authors thank the National Institute of Meteorology, INMET, for providing the necessary weather data. The authors also thank Marina Luciana Abreu de Melo for helping the final adjustments in the manuscript.
References
ACOMPANHAMENTO DA SAFRA BRASILEIRA [DE] GRÃOS: safra 2016/17: décimo primeiro levantamento. Brasília, DF: Conab, v. 4, ago. 2017. 171 p.
ALVES, M. E. B.; ANDRADE, C. de L. T. de; RUIZ-CARDENAS, R.; AMARAL, T. A.; SILVA, D. F.
Identificação e quantificação do efeito de fatores ambientais na produtividade da cultura do milho na região de Janaúba, MG. Revista Brasileira de Agricultura Irrigada, Fortaleza, v. 5, n. 3, p. 188-201, 2011.
AMARAL, T. A.; ANDRADE, C. de L. T. de; ALVES, M. E. B.; SILVA, D. F. Applying CSM-CERES-Maize to define a sowing window for irrigated maize crop: the Riacho’s farm case study. Revista
Ambiente & Água, Taubaté, v. 6, n. 2, p. 38-53, 2011.
DOI: 10.4136/ambi-agua.184.
ANDRIOLI, K. G.; SENTELHAS, P. C. Brazilian maize genotypes sensitivity to water deficit estimated through a simple crop yield model. Pesquisa Agropecuária
Brasileira, Brasília, DF, v. 44, n. 7, p. 653-660, 2009.
DOI: 10.1590/S0100-204X2009000700001.
ANOTHAI, J.; SOLER, C. M. T.; GREEN, A.; TROUT, T. J.; HOOGENBOOM, G. Evaluation of two evapotranspiration approaches simulated with the CSM-CERES-Maize model under different irrigation strategies and the impact on maize growth, development and soil moisture content for semi-arid conditions.
Agricultural and Forest Meteorology, Amsterdam, v.
176, p. 64-76, 2013.
DOI: 10.1016/j.agrformet.2013.03.001.
BERT, F. E.; LACIANA, C. E.; PODESTA, G. P.; SATORRE, E. H.; MENENDEZ, A. N. Sensitivity of CERES-Maize simulated yields to uncertainty in soil properties and daily solar radiation. Agricultural Systems, Essex, v. 94, n. 2, p. 141-150, 2007.
BOGGIONE, I. M. Avaliação da viabilidade técnica e
financeira do cultivo de milho irrigado em diferentes regiões de Minas Gerais utilizando modelagem computacional. 2014. 105 f. Dissertação (Mestrado em
Produção Vegetal) - Universidade Federal de São João del-Rei, Sete Lagoas, 2014.
CARDOSO, C. O.; FARIA, R. T.; FOLEGATTI, M. V. Simulação do rendimento e riscos climáticos para o milho safrinha em Londrina - PR, utilizando o modelo CERES-Maize. Engenharia Agrícola, Botucatu, v. 24, n. 2, p. 291-300, 2004. DOI: 10.1590/S0100-69162004000200007. GRASSINI, P.; THORBURN, J.; BURR, C.; CASSMAN, K. G. High-yield irrigated maize in the Western U.S. Corn Belt: I. On-farm yield, yield potential, and impact of agronomic practices. Field Crops Research, Amsterdam, v. 120, n. 1, p. 142-150, 2011.
DOI: 10.1016/j.fcr.2010.09.012.
HOOGENBOOM, G.; PORTER, C. H.; SHELIA, V.; BOOTE, K. J.; SINGH, U.; WHITE, J. W.; HUNT, L. A.; OGOSHI, R.; LIZASO, J. I.; KOO, J.; ASSENG, S.; SINGELS, A.; MORENO, L. P.; JONES, J. W. Decision
Support System for Agrotechnology Transfer (DSSAT):
version 4.7. Gainesville: DSSAT Foundation, 2017. Disponível em: <https://DSSAT.net>. Acesso em: 18 mar. 2018.
ISLAM, A.; AHUJA, L. R.; GARCIA, L. A.; MA, L.; SASEENDRAN, A. S.; TROUT, T. J. Modeling the impacts of climate change on irrigated corn production in the Central Great Plains. Agricultural Water Management, Amsterdam, v. 110, p. 94-108, 2012.
DOI: 10.1016/j.agwat.2012.04.004.
JONES, J. W.; HOOGENBOOM, G.; PORTER, C. H.; BOOTE, K. J.; BATCHELOR, W. D.; HUNT, L. A.; WILKENS, P. W.; SINGH, U.; GIJSMAN, A. J.; RICHTIE, J. T. The DSSAT cropping system model. European
Journal of Agronomy, v. 18, n. 3/4, p. 235-265, 2003.
DOI: 10.1016/S1161-0301(02)00107-7.
KADIYALA, M. D. M.; JONES, J. W.; MYLAVARAPU, R. S.; LI, Y. C.; REDDY, M. D. Identifying irrigation and
nitrogen best management practices for aerobic rice-maize cropping system for semi-arid tropics using CERES-rice and maize models. Agricultural Water Management, Amsterdam, v. 149, p. 23-32, 2015.
DOI: 10.1016/j.agwat.2014.10.019.
KATERJI, N.; CAMPI, P.; MASTRORILLI, M. Productivity, evapotranspiration, and water use efficiency of corn and tomato crops simulated by AquaCrop under contrasting water stress conditions in the Mediterranean region. Agricultural Water Management, Amsterdam, v. 130, p. 14-26, 2013. DOI: 10.1016/j.agwat.2013.08.005. LI, Z. T.; YANG, J. Y.; DRURY, C. F.; HOOGENBOOM, G. Evaluation of the DSSAT-CSM for simulating yield and soil organic C and N of a long-term maize and wheat rotation experiment in the Loess Plateau of Northwestern China. Agricultural Systems, Essex, v. 135, p. 90-104, 2015. DOI: 10.1016/j.agsy.2014.12.006.
LIU, H. L.; YANG, J. Y.; DRURY, C. F.; REYNOLDS, W. D.; TAN, C. S.; BAI, Y. L.; HE, P.; JIN, J.; HOOGENBOOM, G. Using the DSSAT-CERES-Maize model to simulate crop yield and nitrogen cycling in fields under long-term continuous maize production. Nutrient
Cycling in Agroecosystems, Dordrecht, v. 89, n. 3, p.
313-328, 2011. DOI: 10.1007/s10705-010-9396-y.
MORADI, R.; KOOCHEKI, A.; MAHALLATI, M. N. Adaptation of maize to climate change impacts in Iran.
Mitigation and Adaptation Strategies for Global Change, v. 19, n. 8, p. 1223-1238, 2014.
DOI: 10.1007/s11027-013-9470-2.
NEGM, L. M.; YOUSSEF, M. A.; SKAGGS, R. W.; CHESCHEIR, G. M.; JONES, J. DRAINMOD–DSSAT model for simulating hydrology, soil carbon and nitrogen dynamics, and crop growth for drained crop land.
Agricultural Water Management, Amsterdam, v. 137, p.
30-45, 2014.
DOI: 10.1016/j.agwat.2014.02.001.
PAIXÃO, J. S.; ANDRADE, C. de L. T. de; GARCIA Y GARCIA, A.; AMARAL, T. A.; STEIDLE NETO, A. J.; MARIN, F. R. An alternative approach to the actual
Brazilian maize crop zoning. Revista Brasileira de Milho
e Sorgo, Sete Lagoas, v. 13, n. 3, p. 347-363, 2014.
DOI: 10.18512/1980-6477/rbms.v13n3p347-363.
SALAZAR, M. R.; HOOK, J. E.; GARCIA Y GARCIA, A.; PAZ, J. O.; CHAVES, B.; HOOGENBOOM, G. Estimating irrigation water use for maize in the Southeastern USA: A modeling approach. Agricultural Water Management, Amsterdam, v. 107, p. 104-111, 2012.
DOI: 10.1016/j.agwat.2012.01.015.
SINGH, A. K.; MADRAMOOTOO, C. A.; GOYAL, M. K.; SMITH, D. L. Corn yield simulation using the STICS model under varying nitrogen management and climate-change scenarios. Journal of Irrigation and Drainage
Engineering, New York, v. 140, n. 4, 2014.
DOI: 10.1061/(ASCE)IR.1943-4774.0000682.
SOLER, C. M. T.; SENTELHAS, P. C.; HOOGENBOOM, G. Application of the CSM-CERES-Maize model for planting date evaluation and yield forecasting for maize grown off-season in a subtropical environment. European
Journal of Agronomy, v. 27, n. 2/4, p. 165-177, 2007.
DOI: 10.1016/j.eja.2007.03.002.
SOLER, C. M. T.; SENTELHAS, P. C.; HOOGENBOOM, G. The impact of El Niño southern oscillation phases on off-season maize yield for a subtropical region of Brazil.
International Journal of Climatology, Hoboken, v. 30,
p. 1056-1066, 2010. DOI: 10.1002/joc.1951.
TIGGES, C. H. P.; ANDRADE, C. de L. T. de; MELO, B. F.; AMARAL, T. A. Épocas de semeadura de milho em
plantios de sequeiro e irrigado em Minas Gerais. Sete
Lagoas: Embrapa Milho e Sorgo, 2016. 20 p. (Embrapa Milho e Sorgo. Circular Técnica, 225).
WAGNER, M. V.; JADOSKI, S. O.; MAGGI, M. F.; SAITO, L. R.; LIMA, A. S. Estimativa da produtividade do milho em função da disponibilidade hídrica em Guarapuava, PR, Brasil. Revista Brasileira de Engenharia Agrícola e
Ambiental, Campina Grande, v. 17, n. 2, p. 170-179, 2013.