Universidade de Lisboa
Faculdade de Ciências
Departamento de Biologia Vegetal
Minia Antelo Varela
Dissertação
Versão pública
MESTRADO EM MICROBIOLOGIA APLICADA
2014
Tropism based analysis of Chlamydia trachomatis
chromosome
Universidade de Lisboa
Faculdade de Ciências
Departamento de Biologia Vegetal
Tropism based analysis of Chlamydia trachomatis
chromosome
Minia Antelo Varela
MESTRADO EM MICROBIOLOGIA APLICADA
ORIENTADORES:
Doutor João Paulo Gomes
Doutor Francisco Dionísio
Tropism based analysis of Chlamydia trachomatis
chromosome
Minia Antelo Varela
2014
This thesis was fully performed at Instituto Nacional de Saúde Dr. Ricardo Jorge
under the direct supervision of Doutor João Paulo Gomes in the scope of the
Master´s degree in Applied Microbiology of the Faculty of Sciences of the University
of Lisbon. Doutor Francisco Dionísio was the designated internal supervisor.
ACKNOWLEDGMENTS
To everyone who offered their support and advisement during the concretion of my thesis project I offer my sincerest gratitude. I would also like to thank the host Institution, Instituto Nacional de Saúde Dr. Ricardo Jorge (INSA), for receiving me. I present a special acknowledgement to:
- my supervisor Doctor João Paulo Gomes, responsible for the Unit of Investigation and Development of the Department of Infectious Diseases of INSA, for the reliance with which he accepted to supervise my work, for his constant availability and for his accurate and critic review of this dissertation.
- Doctor Maria José Borrego, head of the National Reference Laboratory for sexually transmitted infections of INSA, for her availability and help.
- my colleagues Vítor Borges, Rita Ferreira, Vera Damião, Miguel Pinto and Alexandra Nunes, for their support, friendship and unconditional help.
- Professor Francisco Dionísio, my internal supervisor, for reviewing my dissertation and for his recommendations.
- all the staff of the Department of Infectious Diseases of INSA, for their kindness.
- my family and friends. Without their companionship and unconditional support the concretion of this work would have not been possible.
1. INTRODUCTORY NOTE 2. RESUMO 3. GENERAL INTRODUCTION 4. OBJECTIVES 5. PART I 5.1. ABSTRACT 5.2. INTRODUCTION
5.3. MATERIAL AND METHODS 5.3.1. Alignments generation 5.3.2. Exclusion criteria
5.3.3. Polymorphism and evolutionary analyses
5.3.4. Characterization of the mosaic structure of the strains from the most prevalent serovars
5.3.5. Statistical analysis 5.4. RESULTS
5.4.1. Evaluation of the genetic backbone of the strains in the whole-genome phylogenetic cluster of the most clinically prevalent serovars
5.4.2. Gene based analysis of C. trachomatis chromosome (i) Polymorphism and evolutionary analysis (ii) Correlation between p-distance and dN/dS (iii) Species polymorphism versus number of taxa 5.5. DISCUSSION 1 2 5 7 8 8 9 11 11 11 11 12 13 14 14 14 14 19 20 21
Index
FIGURE 1: Developmental cycle of Chlamydia. PART I.
FIGURE 1: Nucleotide sequences of crossovers for strains D(s)/2923 and D/SotonD1. FIGURE 2: Recombination analyses of the D(s)/2923 and D/SontonD1 strains. FIGURE 3: Phylogenetic reconstruction of C. trachomatis species.
FIGURE 4: Genes that segregate strains according to their biological characteristics. FIGURE 5: Genomic distribution of dN/dS and p-distance.
FIGURE 6: Differences obtained during the analyses using 53 and 17 strains.
5 12 15 16 17 19 20
Figure’s Index
PART I.
TABLE 1: Top five ranking of the most polymorphic C. trachomatis chromosomal genes.
TABLE 2: Number of C. trachomatis chromosomal genes that segregate a particular group of strains. TABLE 3: C. trachomatis known and putative pseudogenes for a particular disease group and genes that present differences in gene length among strains from different disease groups.
TABLE S1: C. trachomatis strains used in the present study.
TABLE S2: Bioinformatical results of all C. trachomatis ORFs with detailed information of putative pseudogenes, strains' segregation, overall mean distances and dN/dS values. (Only available in CD version) 16 17 18 39 CD
Table’s Index
INTRODUCTORY NOTE
The dissertation is divided in two different sections. In the first part I’m co-first author of a paper that is currently under review. Therefore, in order to reflect the exact work that was done, the first part of the dissertation matches the paper. One of the supplementary tables (Table S2) is only provided in the CD version (an extensive excel worksheet with the detailed analysis of the ~900 genes).
RESUMO
Alguns microrganismos possuem vários fatores de virulência que lhes conferem a capacidade de infetar de forma específica nichos biológicos distintos. Chlamydia é um excelente exemplo para representar esta competência, uma vez que evoluiu de forma a poder colonizar diversos grupos de animais vertebrados. Trata-se de um género bacteriano gram-negativo e intracelular obrigatório, com um ciclo de vida bifásico único entre os procariotas, de 30 a 72 horas. Apresenta duas formas celulares morfologicamente distintas: forma extracelular infeciosa, o corpo elementar e uma forma replicativa não-infeciosa, o corpo reticulado. Ao longo do desenvolvimento, a bactéria reside e multiplica-se dentro de um vacúolo - a inclusão, e manipula a célula hospedeira através de um sistema de secreção do tipo III (T3SS) pela translocação de proteínas efetoras para o interior da célula hospedeira. Embora a história taxonómica deste género bacteriano tenha sido controversa, propôs-se recentemente que a família das Chlamydiaceae fosse agregada num único género,
Chlamydia, incluindo nove espécies com um largo espetro de hospedeiros e de patologias: C. muridarum, C. suis, C. pecorum, C. caviae, C. psittaci, C. abortum, C. felis, C. pneumoniae e C. trachomatis, sendo esta última
o foco do nosso estudo, dado tratar-se da única espécie que infecta estritamente o homem e cujas infeções constituem um sério problema de saúde pública. Chlamydia trachomatis é classificada em 15 serovars principais, de acordo com o serotipo diferencial da MOMP (proteína principal da membrana externa). Os serovars de A a C infetam a conjuntiva ocular, provocando o tracoma, que é a principal causa de cegueira susceptível de prevenção em todo o mundo; os serovars D a K estão associados às infeções ano-urogenitais não invasivas, constituindo a primeira causa de doenças bacterianas sexualmente transmissíveis a nível mundial; finalmente, os serovars L1 a L3 são responsáveis por doenças mais invasivas e sistémicas, tais como o linfogranuloma venéreo (LGV), através da infeção do tecido genital e proliferação para os nódulos linfáticos inguinais.
O genoma de C. trachomatis, o qual foi sequenciado em 1998, tem aproximadamente 1-Mpb, o que é considerado pequeno para uma bactéria, resultando dum processo de redução evolutiva aquando da transição deste patogéneo para o meio intracelular. Esta bactéria contém também um plasmídeo altamente conservado com ~7,5 kb, que codifica para 8 genes, dois dos quais (pgp3 a pgp4) já tendo sido implicados em funções de virulência. Apesar das diferenças biológicas dos vários serovars de C. trachomatis em relação ao seu tropismo, virulência e sucesso ecológico, estes apresentam um elevado grau de similaridade genómica (>98%). Assim, pensa-se que estas discrepâncias fenotípicas tenham origem em polimorfismos genéticos específicos (mutações pontuais ou pequenos eventos de inserção/deleção) circunscritos aos restantes 2% do genoma. Neste âmbito, este estudo visa avaliar quais os genes que possam estar envolvidos nas diferenças de tropismo, virulência e sucesso ecológico entre os diversos serovars de C. trachomatis,sendo dividido em duas partes.
Na primeira parte estudámos todos os ~900 genes de C. trachomatis, tanto a nível filogenético, como evolutivo, para avaliar a sua possível associação com apetência celular e sucesso ecológico, tendo como base
cerca de 50 genomas totalmente sequenciados que estão disponíveis no GenBank. Vimos que apenas ~1% dos genes mostram ter uma segregação filogenética dos três grupos de doença (agrupando diferencialmente estirpes que infetam a conjuntiva ocular, o epitélio genital e os nódulos linfáticos). Por outro lado, aproximadamente 80% dos genes segregam as estirpes de LGV, e 28% de todos os genes, incluindo a maioria dos efetores do T3SS e proteínas da inclusão de membrana, as agrupam de forma exclusiva. Metade dos genes estão envolvidos na segregação das estirpes dos serovars genitais mais prevalentes, mas apenas 61 proteínas exibem este padrão mutacional de forma exclusiva. Notavelmente, estas últimas mostraram ser co-segregadas com as estirpes LGV por ~20% dos genes, o que não deixa de ser curioso, tendo em conta o carácter mais invasivo destas últimas. Identificámos também alguns pseudogenes, especificamente associados a estirpes com determinado tipo de tropismo. Aproximadamente 3.5% dos genes mostraram uma sobre representação de mutações não-sinónimas, onde a maioria codifica proteínas que interagem diretamente com o hospedeiro. Globalmente, esta previsão in silico dos genes de C. trachomatis associados a um fenótipo específico pode constituir uma importante base de dados, abrindo portas para futuros estudos cujo objetivo seja o desenvolvimento de medidas profiláticas para o combate às infeções por esta bactéria.
A segunda parte deste trabalho foca-se na avaliação da dinâmica genómica de C. trachomatis, subjacente à adaptação ao meio laboratorial. Este tipo de estudos de evolução adaptativa in vitro têm permitido recolher conhecimento importante relativo à base molecular subjacente a processos de evolução microbiana, podendo posteriormente relacioná-lo com dinâmicas adaptativas ocorrentes em populações naturais. Demonstram normalmente a existência de alterações fenotípicas tipicamente observadas em populações propagadas em laboratório, nomeadamente o desenvolvimento de novas capacidades metabólicas, o desenvolvimento de resistência/sensibilidade a antibióticos e perda geral de virulência. Estas características têm sido exploradas pelos investigadores, de forma a esclarecer mecanismos subjacentes ao processo de infeção, e descobrir novos genes de virulência, uma vez que a sua perda de função poderá estar possivelmente relacionada com a sua dispensabilidade no meio in vitro, corroborando o facto de que estes genes possam ter um papel essencial in vivo. Foram utilizadas neste estudo de propagação laboratorial intensiva e de análise genómica comparativa (sequenciação genómica total das estirpes antes e após a sua propagação laboratorial), estirpes com características de tropismo diferentes, nomeadamente seis estirpes representativas dos três grupos de doença (4 urogenitais não-invasivas, uma ocular e uma LGV). Propagámos as estirpes através de 30 passagens in vitro de forma a perceber quais os mecanismos que levam à acumulação de mutações ao longo da passagem laboratorial. Detetámos a emergência de clones com mutações inativantes no gene CT135 (previamente descrito como potencial fator de virulência), para todas as estirpes urogenitais, mas não para as restantes estirpes (oculares e LGV), sendo que os mutantes CT135-nulos subiram rapidamente a sua frequência na população. Ocorreu um cenário semelhante para o gene CT713/porB, em que 3 das 4 estirpes urogenitais não invasivas foram alvo de possíveis mutações inativantes, um panorama que possivelmente reflete um processo de adaptação metabólica, dado que este gene está associado ao transporte de dicarboxilatos. Detetámos também dois genes que foram alvos de mutações
inativantes: CT257 e CT645, indicando que estes genes não são essenciais para o crescimento in vitro de C.
trachomatis. Curiosamente, a estirpe ocular C/TW-3 evoluiu de forma a reter um gene CT135 funcional,
opostamente à estirpe LGV, que não mostrou o aparecimento de qualquer mutação. Também verificámos que a taxa de crescimento para as estirpes propagadas in vitro aumentou relativamente às populações ancestrais, refletindo uma melhoria gradual do fitness ao longo do tempo. Globalmente, esta segunda parte do trabalho contribui para a compreensão de alguns mecanismos subjacentes à adaptação laboratorial de C. trachomatis e corrobora o papel do gene CT135 como um importante fator de virulência. Também identifica possíveis problemas em relação à interpretação de resultados de estudos in vivo que usam estirpes propagadas em laboratório.
De uma forma geral, pensamos que este trabalho possa fornecer novo conhecimento em relação aos genes que possam estar envolvidos nos processos de tropismo diferencial, sucesso ecológico e virulência dos diversos serovars de C. trachomatis, abrindo novos caminhos de pesquisa para estabelecer associações entre genótipo e fenótipo.
GENERAL INTRODUCTION
A key feature of bacterial evolution is the ability to adapt to and colonize particular niches. Chlamydiae sets a good example for this, since it has effectively evolved to colonize a varied group of vertebrates. This gram-negative obligate intracellular bacterium possesses a unique and specialized biphasic cycle of 30-72h. Bedson and Bland described it for the first time in 1932. They identified two morphologically different forms: the extracellular and infectious form, the elementary body (EB), and a non-infectious but replicative form, the reticulate body (RB). The EB is small (0.3 µm) and round, containing a dense nucleoid and a rigid cell wall that allows chlamydial extracellular survival. Oppositely, the RB ranges from 0.5 to 1.0 µm and possesses a more flexible structure than the EB’s, making it osmotically fragile. The RB’s are metabolically active, containing diffuse and fibrillar DNA and are richer in RNA. As a result, intracellular replication, uptake and transport of nutrients, protein synthesis and other metabolic activities are ensured (Moulder, 1991). Chlamydiae developmental cycle (Figure 1) can be divided into 5 main steps: i) attachment and internalization of EB’s into host cells. The emergent phagocytic compartment is rapidly altered by Chlamydia-derived proteins, producing a parasitophorous vacuole (inclusion); ii) EBs begin to differentiate into RBs inside the inclusion; iii) RBs start
FIGURE 1. Developmental cycle of Chlamydia. Within the first two hours postinternalization into cells, EBs fuse to form a nascent
inclusion. Between 2-6h postinfection (hpi) EBs start to differentiate into RBs. By 12 hpi RBs can be observed dividing by binary fission and 18-24 hpi they reach their highest number. Around 24 hpi the rising numbers of RBs differentiate back to EBs until lysis or release takes place. It happens between 48 and 72 hpi, depending on the chlamydial species.
to divide by binary fission; iv) RBs peak in number as the inclusion expands throughout the cycle until the RBs differentiate back into EBs; and v) EBs are released by cell lysis or by extrusion to continue the infectious process in neighboring cells (reviewed in Dautry-Varsat et al. 2005; Hybiske and Stephens, 2007).
Chlamydia employs a type III secretion (T3SS) system, throughout all the stages of infection. This system
is responsible for the translocation of effector proteins into the host cell cytoplasm in order to modulate its basic cellular function, like: cell invasion and inhibition of phagocytosis, settlement of the inclusion, uptake of nutrients, redirection of the intracellular trafficking, early inhibition and late stimulation of apoptosis and evasion of immune response (Valdivia, 2008).
The history of chlamydial taxonomy is controversial and it has been suffering numerous adjustments throughout the years. However, in 2009 (Stephens et al., 2009), it was proposed that the Chlamydiaceae family should be assembled into a single genus – Chlamydia – encompassing 9 species with a broad host range, tissue tropism and disease pathology. For instance: C. muridarum, C. suis, C. pecorum and C. caviae cause infection in mice, swine, livestock and guinea pigs, respectively (Barron et al, 1981; Schautteet and Vanrompay, 2011; Mohamad and Rodolakis, 2010 and Murray 1981). Other Chlamydia species have the capability to cause zoonotic infections, namely: C. psittaci, C. abortum and to a lesser extent C. felis. The former is a pathogen of avian species that causes respiratory infections and as a consequence has considerable impact on poultry farming. It can be transmitted to humans by inhalation of the organism when it is dispersed in the air as fine particles (Knittler et al, 2014). C. abortum has the ability to infect the placenta of sheep and goats, resulting in abortions. Pregnant women who are exposed to this bacterium are also at risk of abortion (Longbottom and Coulter, 2003). C. felis is a common cause of conjunctivitis in cats (Sykes, 2005), however there are also reports of human conjunctivitis caused by this pathogen (Yan et al, 2000 and Hartley et al, 2001). The other two species encompass the main human chlamydial pathogens: C. pneumoniae and C.
trachomatis. The former causes acute respiratory infections and has been linked epidemiologically to
atherosclerosis and increased risk of heart disease (Grayston et al, 2000). C. trachomatis, the most important chlamydial pathogen and also the focus of this study, causes ocular and genital infections. It is traditionally classified into 15 major serovars based on the differential serospecificity of the major outer membrane protein (MOMP) or polymorphism of ompA, the gene that encodes for MOMP (Yuan et al., 1989). Serovars A to C typically infect the ocular mucosa causing trachoma, a chronic inflammatory disease that is the world’s leading cause of preventable infectious blindness (Wright et al, 2008; Whitcher et al., 2001). Serovars D to K are associated with noninvasive ano-urogenital infections, constituting the primary cause of bacterial sexually transmitted diseases worldwide (World_Health_Organization, 2011). They consist fundamentally in cervivitis and urethritis. However, these may progress to the upper genital tract, causing inflammatory pelvic disease in women and epididymitis in men, which can guide to major permanent sequelae, such as ectopic pregnancy and infertility (Peipert, 2003). C. trachomatis is also responsible for more invasive and systemic diseases (caused by serovars L1 to L3) such as lymphogranuloma venereum (LGV) via the infection of macrophages that migrate to regional lymph nodes, leading to an inguinal lymphadenopathy (Schachter, 1978).
Chlamydia trachomatis genomes are approximately 1-Mbp, a result of this pathogen ancient transition
to the intracellular environment which caused its extensive genome reduction (Zomorodipour and Andersson, 1999). C. trachomatis also retains a highly conserved plasmid of approximately 7.5 kb which codes for eight extremely conserved genes (Palmer & Falkow, 1986), two of which (pgp3 and pgp4) have been implicated in virulence functions (Li et al, 2008; Song et al, 2013).
Despite Chlamydia trachomatis biological properties regarding tissue tropism (ocular conjunctiva, epithelial genitalia and lymph nodes), virulence (disease outcomes) and ecological success, serovars present a large degree of genome homology (>98%). Therefore, one may speculate that these discrepancies in cell-appetence are encrypted in the remainder 2% of the genome and in punctual mutations or small events of insertion/deletion (indel) in a restricted number of genes. As such, decoding this microorganism genome might help the elucidation of the genes that are involved in the differential tissue appetence and thus may also constitute a useful tool for the development of prophylactic or therapeutic strategies.
OBJECTIVES
Taking this into account and given the recent availability of tenths of C. trachomatis fully sequenced genomes, the first goal of this thesis project was to inspect all the ~900 genes of this pathogen phylogenetically and evolutionarily, with the purpose of establishing a relation between the strains’ genotype and phenotype. This may allow us to identify genes involved in tissue-specific adaptation and exclusively shared by strains infecting a specific niche.
The second objective was to propagate strains representative of the three disease groups in a monolayer of epithelial cells, performing whole-population sequencing at various time points, in order to assess if strains causing dissimilar disease outcomes reveal different ways of adaptation to this specific cell type.
ABSTRACT
Microbes possess a multiplicity of virulence factors that confer them the ability to specifically infect distinct biological niches. Contrarily to what is known for other bacteria, for the obligate intracellular human pathogen
Chlamydia trachomatis, the molecular basis underlying serovars’ tissue specificity is scarce. We scrutinized all
its ~900 genes at both phylogenetic and evolutionary levels to assess their putative association with cell-appetence and ecological success. Only ~1% of the genes showed a phylogenetic segregation of the three disease groups (strains infecting the ocular conjunctiva, epithelial-genitalia and lymph nodes). About 80% of the genes segregate the lymphogranuloma venereum (LGV) strains, and 28% of all genes, including the majority of T3SS effectors and inclusion membrane proteins, cluster them exclusively. Half of the genes are involved in strain segregation of the most prevalent genital serovars, but only 61 proteins display this restricted mutational pattern. Notably, the latter are co-segregated with the LGV strains by ~20% of the genes. Some putative pseudogenes were identified as likely expendable for a particular phenotype. About 3.5% of the genes revealed a significant overrepresentation of nonsynonymous mutations, where the majority encode proteins that directly interact with the host. Overall, this in silico prediction of C. trachomatis phenotype-associated genes may constitute an important database, opening avenues for future studies aiming the development of disease-specific prophylaxis.
KEYWORDS
Chlamydia trachomatis, genomics, clinical prevalence, tropism, loci
PART I
INTRODUCTION
The observation that there are pathogenic and non-pathogenic microbes compelled investigators to search for traits underlying their phenotypic differences. This search for the so called “virulence factors” has greatly contributed to the understanding of pathogenicity, and to the elucidation of the genetic mechanisms underlying the capability to infect different cell-types or organs. The notions that the microbial pathogenicity relies on the interaction between a pathogen and its host (or a specific tissue), and that a virulence factor is either a microbial product or a strategy capable of causing damage to a susceptible host, can be broadly applied (Casadevall and Pirofski 2009). In this perspective, virulence factors may involve an endless list of products or mechanisms, such as toxins, adhesins, motility structures like flagella and pili, immune evasion determinants, capsules, biofilms, secretion systems, and signal transduction mechanisms (reviewed in Casadevall and Pirofski 2009). Usually, microbes carry several of these virulence factors which work together in the process of host invasion and microbe survival.
Among pathogenic agents, several bacteria present intracellular lifestyles (obligatory or facultative). Their host-cell targets range from epithelial cells to phagocytes, like macrophages and neutrophils (Wilson et al. 2002), which implies that these pathogens have been developing specialized strategies that allow them, for instance, to survive within or avoid the adverse environment of the macrophage phagosome (membrane-bound vacuole) (Garcia-del Portillo and Finlay 1995; Pizarro-Cerdá et al. 1995). Some bacteria (e.g., Salmonella spp, Coxiella burnetii and Cryptococcus neoformans) are able to reside within the lysosomal vacuole, others (e.g., Chlamydia trachomatis and Mycobacterium spp) need to “remodel” it to allow their survival, while others (e.g., Listeria monocytogenes and Shigella spp) degrade the vacuole membrane to gain access to the host-cell cytosol where they may complete their developmental cycle (Pizarro-Cerdá, et al. 1997; Ernst et al. 1995). Moreover, some pathogenic bacteria are also able to infect different cell-types or organs of a given host. For example, L. monocytogenes can cross the intestinal epithelium, the blood–brain and fetoplacental barriers (Cossart 2011), and may cause severe septicaemia and meningoencephalitis (Allerberger and Wagner 2010), while Streptococcus pneumoniae is capable of infecting the lung, the blood and the naso-pharynx (Hava and Camilli 2002).
Another example of bacteria capable of infecting different cell-types is C. trachomatis, an obligate intracellular human pathogen that can be classified into 15 major serovariants (serovars): serovars A-C cause ocular infections that can progress to trachoma, the leading cause of preventable blindness worldwide (Burton, 2007; Wright et al. 2008); serovars D-K cause ano-urogenital infections that can evolve into cervicitis, urethritis, epididymitis (men) or pelvic inflammatory disease (women), the latter of which can lead to significant long term sequelae such as infertility and ectopic pregnancy (Peipert 2003); and serovars L1-L3 are responsible for an invasive disease, the lymphogranuloma venereum (LGV), through the infection of macrophages and dissemination to regional draining lymph nodes (Schachter 1978). However, contrarily to well studied bacterial pathogens, and despite the huge phenotypic differences among C. trachomatis serovars
regarding tissue tropism, virulence and ecological success, little is known about the molecular factors underlying serovars’ biological uniqueness. This is mostly due to the inexistence of a suitable animal model that mirrors the human chlamydial infection in vivo and because C. trachomatis has been genetically intractable until very recently (Kari et al. 2011; Wang et al. 2011; Mishra et al. 2012; Nguyen et al. 2012). Probably the only unequivocal demonstration of the association of a virulence factor with tropism was provided by Caldwell and colleagues (Caldwell et al. 2003) showing that an active tryptophan operon (trpRBA) is mandatory for any C. trachomatis strain to infect the genitalia. Nevertheless, a revision concerning the genetics beyond tropism was recently published (Nunes et al. 2013).
Recent phylogenetic analysis (Harris et al. 2012) using the complete genome of several C. trachomatis strains evidenced: i) the segregation of strains by their cell-appetence, suggesting a co-evolution with the infected tissue; ii) the separation of the LGV strains prior to the separation of the ocular and the epithelial-genital strains; iii) that the most prevalent serovars (E and F), which account for ~50% of all chlamydial epithelial-genital infections among the heterosexual population (Nunes et al. 2010), clearly segregate apart from the remainder epithelial-genital strains; and iv) that the ocular strains probably derived from a non-prevalent genital serovar. On the other hand, the small genome (~1Mb) of C. trachomatis reveals a high degree of conservation among serovars (> 98%), with nearly identical pan- and core-genomes, a high coding density and no evidence of recent horizontal gene transfer, which suggests a likely ended genetic reduction process as a result of a long-term intracellular niche adaptation process (Horn et al. 2004; Read et al. 2013). Considering this, one may speculate that the phenotypic disparities (tissue tropism, virulence and ecological success) among strains are encrypted in a small number of variable genes along the C. trachomatis genome. Thus, given the recent availability of tenths of C. trachomatis fully sequenced genomes, our goal was to scrutinize all the ~900 genes at the phylogenetic and evolutionary level in order to better understand the relation between the genetics and the strains’ phenotypic disparities. The rational basis for this analysis is that genes showing a mutational pattern shared exclusively by strains infecting a specific niche may be involved in tissue-specific adaptation processes or disease outcomes. The identification of such genes may be helpful for developing prophylactic or therapeutic measures targeting specifically each type of C. trachomatis infection.
MATERIALS AND METHODS
Alignments generation
For the general polymorphism and evolutionary analyses, different alignment strategies were conducted. Firstly, the whole-genome sequences of the 53 studied C. trachomatis strains were retrieved from the GenBank (Table S1) and aligned using the progressiveMauve application from Mauve software, version 2.3.1 (Darling et al. 2010). This alignment was then used for further retrieving the individual alignment of each one of the 896 genes (based on the available D/UW-3/CX sequence). These individual alignments were subsequently uploaded into the Molecular Evolutionary Genetics Analysis software, version 5 (MEGA 5; http://www.megasoftware.net) (Tamura et al. 2011) and visually inspected for further correction (whenever needed) prior to evolutionary and genetic diversity analyses. A core-alignment was also extracted by keeping regions where the 53 genomes aligned over at least 500 bp (corresponding of ~97% of the C. trachomatis chromosome), to be further used in the construction of the species phylogenetic tree. This alignment was then exported and directly uploaded into MEGA 5 for whole-genome analyses purposes.
Exclusion criteria
Distinct annotations in GenBank for the start codon of the same gene were handled by eliminating the discordant 5’ regions while keeping the identical start sites for all the 53 strains. This was not applied when an upstream codon was annotated as a consequence of a mutation in the codon correspondent to the translation initiation codon of the other sequences. We also observed that, for some other genes, there were strains that had more than one coding sequence annotated at the same region. These cases were treated like pseudogenes and the respective strains were removed from the analysis. There were also genes for which a single frameshift yielded a biased polymorphism, and for this reason they were not considered has truly polymorphic. Nevertheless, some of them (CT120, CT160, CT162, CT172, CT172.1, CT358, CT480.1, CT793, and CT852) constitute interesting cases as the frameshift occurred solely for the strains of the same disease group. Moreover, for 22 chromosomal genes, it was not possible to obtain an accurate alignment (Table S2) mainly due to accentuated gene size differences, hampering the analyses.
Polymorphism and evolutionary analyses
Each alignment (core-genome and individual genes) was analyzed according to previously described methods (Nunes et al. 2008; Almeida et al., 2012). Concerning the individual alignments of all homologous genes, we first removed from each analysis the strains’ sequences that were considered as pseudogenes or with annotation issues (see Exclusion criteria section above) when necessary. By using the algorithms available in MEGA 5, we determined the overall mean distances (number of differences and p-distance) and matrices of pairwise comparisons at both nucleotide and amino acid level, along with the respective standard error estimates (bootstrap = 1000). Then, for each gene, the number of synonymous substitutions per
Figure 1. Nucleotide sequences of crossovers for strains D(s)/2923 and D/SotonD1.
Crossover regions (red boxes) are delimitated by informative sites from SimPlot/BootScan analysis. Panels A and B represent the partial alignments used for the determination of the crossovers in CT680/rpsB and the CT681/ompA, respectively. Panel C shows the genetic localization of those partial alignments.
synonymous site (dS) as well as the number of nonsynonymous substitutions per nonsynonymous site (dN) were determined by using the Kumar model (Nei and Kumar 2000) and the standard error estimates were obtained by a bootstrap procedure of 1000 replicates. dN/dS ratios were determined and the Z-test of positive selection was applied for the genes revealing dN/dS > 1. The probability of rejecting the null hypothesis of strict-neutrality (dN = dS) in favor of the alternative hypothesis of positive selection (dN > dS) was considered significant when P < 0.05 (bootstrap = 1000) (Nei and Kumar 2000).
Phylogenetic trees for both the whole-genome sequences and the individual genes were inferred by using the Neighbor-Joining (NJ) method (bootstrap = 1000) (Felsenstein 1985; Saitou and Nei 1987). For the nucleotide sequences, the evolutionary distances were computed using the Kimura 2-parameter method (K2P) (Kimura 1980), whereas for the amino acid sequences (for individual genes solely), the evolutionary distances were computed based on the number of differences (Nei and Kumar 2000). A gene was considered to segregate a specific group (ocular, genital and LGV serovars) by taking into account both the tree topology and the number of differences between sequences of different taxa. Additionally, phylogenies were also inspected for the segregation of the strains from the most prevalent genital serovars.
Characterization of the mosaic structure of the strains from the most prevalent serovar
We have performed a fine-tune analysis of the D(s)/2923 and the D/SotonD1 strains that had been previously shown to cluster with the strains from the most clinically prevalent serovars (E and F) (Harris et al. 2012; Jeffrey et al. 2010). We first compared both the D(s)/2923 and the D/SotonD1 strains genome sequences with that of the F/SW5 strain (because this strains was found to be the most closely related to both – see Results section) using the DNA polymorphism tool of the DnaSP software, version 5 (Librado and Rozas 2009), with a window size and
step size of 1000 each (Figure 1). Chromosomal regions with high SNP density, which may indicate the occurrence of recombination events, were
further analyzed by
SimPlot/BootScan
(http://sray.med.som.jhmi.edu/ SCRoftware/simplot/) (Lole et al. 1999; Salminen et al. 1995) for a precise determination of potential mosaic structures. These analyses were performed as previously described (Gomes
et al. 2007), using a sliding window size of 200 bp moved across the alignment in a step size of 30 bp. Briefly, each putative recombinant sequence (“query”) was compared with sequences from the probable parental strain(s) and a known outgroup sequence (both chosen according to the similarity degree shown by the phylogenetic trees of the respective genes putatively involved in the recombination events). At each nucleotide window range, nucleotide pairwise distances were calculated using the NJ method on the basis of pairwise genetic distances (K2P; Bootstrap = 500; gaps strip off; ts/tv of 2.0). For BootScan analyses, the likelihood that the observed distribution of informative sites (Robertson et al. 1995) favouring specific phylogenetic groupings might occur randomly was assessed using the maximum χ2 test. The most likely crossover region occurred where the observed distribution is less likely to occur randomly (maximum χ2 value). A P-value for any specified breakpoint was determined by the Fisher’s Exact Test (two-tailed). A Bonferroni multiple correction testing was applied to evaluate the significance of the P-values at 95% confidence. Results with P-values < 0.05 were considered statistically significant. To support the recombination regions given by SimPlot and to accurately infer the phylogenetic relationships of the putative recombinant strains, the defined breakpoint regions were used to divide the
alignments into delimited genomic regions, and phylogenetic trees were inferred by NJ method (K2P, bootstrap = 1000).
Statistical analysis
To assess the existence of correlation between two groups of samples (see the Correlation between p-distance and dN/dS section) we used the Pearson’s Product Moment Correlation coefficient (R), which is a statistical measure of the strength and direction of a linear relationship between two variables. Results vary from -1 and 1, where a result of -1 means that there is a perfect negative correlation between the two variables, a result of 1 means that there is a perfect positive correlation between the two variables, and a result of 0 meaning that there is no linear relationship between the two variables (Rodgers and Nicewander 1988).
RESULTS
Evaluation of the genetic backbone of the strains in the whole-genome phylogenetic cluster of the most clinically prevalent serovars
In previous studies (Harris et al. 2012; Jeffrey et al. 2010), two D strains (D(s)/2923 and the D/SotonD1) clustering together with the strains of the most prevalent serovars (E and F) had been suggested to have a backbone of the latter. We performed a detailed evaluation of the genomic structure of those serovar D strains, in order to identify the recombination phenomena. We verified that those D strains differ by 51 nucleotides and distant ~5500 nucleotides to the same serovar prototype strain (D/UW-3/CX). By contrast, they are most similar to a serovar F strain (F/SW5), differing by only ~300 nucleotides, with ~50% of these mutations occurring at the CT681/ompA region (Figure 2A ). SimPlot and BootScan analyses identified the exact location of the two breakpoints underlying the recombination event (identical for both strains) (Figure 1). One breakpoint is located at the beginning of CT680/rpsB, and presents a total of 147 informative sites (Figure 2B). Seventy-one informative sites support the similarity between the recombinant strain and F/SW5 (“left” side of the first breakpoint), whereas 76 support its similarity with D/UW-3/CX (“right” side of the first breakpoint) (P = 9.28x10-44). The other breakpoint is located at the beginning of CT681/ompA, and presents a total of 69 informative sites (Figure 2C). Forty-four informative sites support the similarity between the recombinant strain and D/UW-3/CX (“left” side of the second breakpoint), whereas 25 support its similarity with F/SW5 (“right” side of the second breakpoint) (P = 6.65x10⁻¹⁹). In these defined regions there are no informative sites supporting the alternative hypotheses. These results clearly indicate that both recombinant D strains have a genome backbone of a serovar F strain, whereas solely the region spanning between the two recombination breakpoints was inherited from a serovar D strain.
Gene-based analysis of C. trachomatis chromosome
(i) Polymorphism and evolutionary analysis. We were able to analyse ~97.5% (874/896) of all the C.
trachomatis chromosomal genes. The 22 genes excluded from the analysis (see Exclusion criteria section)
comprise five housekeeping genes, the cytotoxin locus, genes encoding 13 hypothetical proteins, two of the phospholipase D endonuclease superfamily gene members (PLDs), and CT081 (Table S2).
Besides those well known polymorphic genes (CT870/pmpF, CT872/pmpH, CT681/ompA, CT049-CT051), the polymorphism analyses highlighted the CT619 (Table 1 and Table S2) (coding for a putative type III secretion system (T3SS) secreted protein with unknown function) that, to our knowledge, had never been considered before as polymorphic.
Figure 2. Recombination analyses of the D(s)/2923 and D/SontonD1 strains.
Panel A shows the number of nucleotide differences (vertical axis) that exist between the genomic sequence of D(s)/2923 or D/SotonD1 and F/SW5. This polymorphism assessment was performed by using the DnaSP software, v5, with a window size and a step size of 1000 base pairs each. The smaller graph represents an enlarged view of the detected highly polymorphic region. Panels B (first crossover) and panel C (second crossover) show the genes in each analyzed region (1) and also the results of the SimPlot (2), the BootScan (3) and the phylogenetic (4) analyses. Recombination breakpoints were individually analyzed because they were better mapped when a different outgroup strain was used for each one, i.e., the L3/404 for the first (B) and the C/TW-3 for the second (C) breackpoints. SimPlot graphs (2) show the level of similarity between the recombinant sequences and the respective parental strains (the number of informative sites supporting the relatedness are coloured according to the graph legend box), whereas the BootScan graphs (3) show the phylogenetic relatedness (% of permuted trees) between those same sequences. Both analyses were obtained with a sliding window size of 200 bp and a step size of 30 bp. The sequence of the recombinant D strains was used as query. The vertical dashed black lines indicate the location of the estimated crossovers, shown in detail in Fig. S2. The phylogenetic trees (4) were constructed with the nucleotide sequences adjacent to each estimated breakpoint region (NJ method; K2P; bootstrap = 1000) and support the recombination event.
Figure 3. Phylogenetic reconstruction of C. trachomatis species. The tree was constructed
using the whole genome of 53 strains encompassing the majority of the CT681/ompA serovars. The asterisks indicate the 17 strains representative of the major tree branches (in red) that were used to evaluate the relation between species polymorphism and the numer of taxa (see Results for details).
We observed that the whole-genome tree topology (Figure 3) is supported by the existence of 136, 14, 431, and 695 genes segregating the ocular, genital, prevalent genital and LGV groups, respectively (Figure 4, Table 2 and Table S2). The low number of genes segregating the group of genital serovars reflects the high heterogeneity within this group as a direct consequence of the recombination background affecting mostly these strains (Harris et al. 2012) and the existence of distinct polymorphism signatures. An example of the latter stands for the F(s)/70 strain, which was isolated from the cervix and frequently showed a rather unusual polymorphism pattern that did not resemble any of the other 52 strains. Therefore, only 11 (1.3%) genes and 12 (1.4%) proteins were found to segregate strains by full-tropism (Figure 4 and Table 2). Some of these genes have already been implicated in the different cell-appetence of the strains, like CT456/tarp, CT870/pmpF, CT872/pmpH, CT115/incD, CT116/incE, two PLD (CT156 and
CT157), and one MACPF domain family protein (CT153) (Gomes et al. 2006; Thomson et al. 2008; Borges et al. 2012; Lutter et al. 2012). The remainders include three housekeeping genes (CT106/yceC, CT110/groEL1 and CT703/engA), and genes encoding one T3SS effector (CT161) (da Cunha et al. 2014) and one putative inclusion membrane protein (Inc) (CT383) (Dehoux et al. 2011) (Table S2).
Of note, the group of strains from the most prevalent genital serovars (E, F and recombinant D strains) are exclusively segregated by 61 proteins, which may contain molecular features that contribute for their higher ecological success. We also observed that the most prevalent and the LGV serovars share hundreds of mutations, particularly in 173 genes (Table 2) revealing a major tree branch where these two groups co-segregate apart from the remaining strains. Concerning the LGV group, ~28% of all chromosomal genes exclusively segregate
Rank Nucleotide Amino acid
No. differences p-distance No. differences p-distance
1 CT870/pmpF (217.3) CT681/ompA (0.121) CT870/pmpF (72.4) CT681/ompA (0.107) 2 CT681/ompA (143.7) CT051 (0.07) CT619 (48.4) CT051 (0.093) 3 CT619 (124.2) CT870/pmpF (0.069) CT051 (46.6) CT049 (0.08) 4 CT872/pmpH (109) CT049 (0.048) CT681/ompA (42.1) CT870/pmpF (0.071) 5 CT050 (104.9) CT619 (0.047) CT049 (38.9) CT050 (0.058)
Table 1. Top five ranking of the most polymorphic C. trachomatis chromosomal genes.
Figure 4. Genes that segregate strains according to their biological characteristics.
The outer circle in both panels represents the genome of C. trachomatis D/UW-3/CX strain, where each bar represents a gene at its respective genomic position (light grey bars - forward strand; dark grey bars - reverse strand). In panel A, the tracks’ colour scheme represent genes whose phylogeny segregates at least a group of strains according to their biological characteristics, i.e., each colour illustrates a particular segregation (that may not be exclusive): full-tropism (purple), LGV strains (orange), strains from prevalent genital serovars (green), co-segregation of LGV and prevalent genital serovar strains (blue), genital strains (prevalent and non-prevalent serovars) (black), and ocular strains (red). In panel B, the tracks’ colour scheme was maintained for the different groups of strains and represent genes that exclusively segregate a unique group of strains. For both panels, the outer and inner tracks of each colour correspond to nucleotide and amino acid results, respectively.
these strains (Figure 4B), conferring this group a unique genetic make-up within the species diversity.
Also, based on either the presence of non-sense mutations or the considerable differences in gene size, we scrutinized the genome for the existence of genes that are putative pseudogenes exclusively for a specific disease group (Table 3). This set includes: i) CT058 (a putative Inc (Almeida et al. 2012)), CT105 (a T3SS effector possibly involved in the cell-appetence of the genital strains (Borges et al. 2012; da Cunha et al. 2014)), trpRBA operon (Caldwell et al. 2003) and CT374/aaxC (Giles et al. 2009) that are pseudogenes for most ocular strains; ii) CT101 (Inc (Almeida et al. 2012)) is a pseudogene for the majority of the genital strains;
iii) CT473 (predicted α-hemolysin) is a pseudogene for the prevalent genital serovar strains; iv) CT373/aaxB
(Giles et al. 2009) and CT300 (putative Inc (Dehoux et al. 2011)) are pseudogenes for LGV strains (Almeida et al. 2012) (for CT300, this occurs only if one considers the same start codon as that annotated for ocular and genital strains); and v) CT037 (conserved hypothetical protein) is a pseudogene for both prevalent genital and LGV serovars strains. This scenario suggests that these genes may be expendable for the C. trachomatis infection of specific biological niches.
Tropisma
Segregationb Exclusive Segregationc
Ocular Genitald Prevalent Genital
Prevalent Genital +
LGVe
LGV Ocular Genitald Prevalent Genital LGV Nucleotide 11 (1.3%) 136 (15.6%) 14 (1.6%) 431 (49.3%) 173 (19.8%) 695 (79.5%) 7 (0.8%) 0 (0%) 47 (5.4%) 245 (28%) Amino acid 12 (1.4%) 105 (12%) 15 (1.7%) 302 (34.6%) 146 (16.7%) 531 (60.8%) 21 (2.4%) 1 (0.1%) 61 (7%) 240 (27.5%)
Table 2. Number of C. trachomatis chromosomal genes that segregate a particular group of strains.
The numbers in parenthesis refer to the proportion of genes, found in each category, relative to the 874 analyzed genes.
a
Gene Functional Category Strains group Observations Reference Ocular Non-prevalen t genital Prevalen t genital LGV CT037 HP = R Ψ Ψ
A/2497, A/363, A/5291 and A/7249 are smaller than the non-prevalent genital serovars.
This study
CT052 Coproporphyrinog
en III oxidase > > = R This study
CT058 Putative inclusion
membrane protein Ψ = = R A/Har13 and C/TW-3 are not Ψs. 26 CT101 Inclusion
membrane protein = Ψ Ψ R
E/Bour, E/11023 and D/UW3 are
not Ψs. This study
CT105 T3S effector Ψ = = R 40 CT106 Predicted pseudouridine synthetase family = > > R This study
CT135 HP < = = R F(s)/70 is smaller. This study CT160 HP > > > R B/Jali20 is a Ψ and F(s)/70 is
smaller. This study CT161 HP = < < R B/Jali20 and E/SotonE8 are Ψs. This study CT162 HP < < < R E/SotonE8, F(s)/70, J/6276, Ia/SotonIa1, Ia/SotonIa3 are Ψs. This study
CT171 Tryptophan synthase (alpha chain) Ψ = = R B/TZ is not a Ψ. 17 CT172 HP < << << R This study CT234 Membrane transport protein from the major facilitator superfamily = = < R This study CT300 Putative inclusion membrane protein R = = Ψ 26 CT358 HP > > > R B/Jali20 is smaller. 26 CT373 HP R = = Ψ 44; This study CT374 Arginine/ornithine
antiporter Ψ = = R 44; This study
CT392 HP > > > R This study
CT441 Tail-specific
protease < < = R
Ia/SotonIa1, Ia/SotonIa3 and J/6276 have the size of the LGV and prevalent genital serovars sequences. This study CT470 HP = = > R This study CT473 HP = = Ψ R This study CT480. 1 HP > > > R G/9301, G/9768, G/11074, J/6276, Ia/SotonIa1 and Ia/SotonIa3 are smaller than the remainder strains’ sequences.
This study
CT522 S3 ribosomal
protein = = < R This study
CT605 HP > > = R This study
CT793 HP > > > R G/9301, G/11074 and G/9768 are Ψs. This study
CT807 Glycerol-3-P
acyltransferase < < = R This study
CT809 HP < < = R This study
CT833 Initiation factor 3 < < < R This study
CT852 YhgN family < < < R This study
CT868
Membrane thiol protease (predicted)
> > > R This study
Table 3. C. trachomatis known and putative pseudogenes for a particular disease group and genes that present differences in gene length among strains from different disease groups.
The differences in sequence length shown only refer to differences in termination between strains. Genes with discordant 5’ annotation, for which the correct start codon lacks confirmation, were not included. The differences in length do not contemplate indel events.
“Ψ” – Sequences considered as pseudogenes;
“R” – The sequence whose size was used for reference purposes. LGV sequences were used by default except for LGV pseudogenes; “=” – Gene of the same size as the reference;
“>” – Gene larger than the reference; “<” – Gene smaller than the reference;
“<<” – Gene with the smallest size. Three sequence sizes were observed for CT172, depending on the disease group;
a
A/2497, A/363, A/5291 and A/7249 are smaller than the non-prevalent genital strains;
b
A/Har13 and C/TW-3 are not Ψs;
c
D/UW3 are not Ψs;
d
E/Bour and E/11023 are not Ψs;
e
5' sequence length differences;
f
To understand the underlying evolutionary pressures that drove amino acid changes of all 874 analyzed chromosomal proteins, we evaluated their molecular evolution by determining the dN/dS values of the respective genes. We verified that 150 genes (~17%) revealed a dN/dS > 1 but only 31 (3.5%) showed a significant Z-test of positive selection (Table S2), and were thus considered as putative targets of positive selection. Twenty-three out of the latter encode 11 Incs, 10 T3SS effectors and two putative membrane proteins, which are proteins expectedly involved in interactions with the host. We also found three hypothetical proteins encoding genes, one PLD encoding gene and four housekeeping genes that are likely under positive selection. We have no reasonable explanation for the latter finding, as housekeeping genes are usually highly conserved and expectedly under purifying selection.
(ii) Correlation between p-distance and dN/dS. We evaluated the linkage between nucleotide polymorphism and evolutionary parameters, such as dN, dS and dN/dS, for all 874 chromosomal genes. From the inspection of the genomic distribution of these parameters and by determining the Pearson’s Product Moment Correlation coefficient, we observed a nearly absolute positive linear correlation between p-distance and both dN (R = 0.92) and dS (R = 0.9) (data not shown). On the other hand, no global correlation between polymorphism and dN/dS was found (R = 0.02) besides minor coincident peaks (Figure 5A and 5B). For a better visualization of the lack of correlation between p-distance and dN/dS values we established a top 25 ranking of the genes displaying the highest values for both parameters (Figure 5C).
Figure 5. Genomic distribution of dN/dS and p-distance.
Panels A and B represent the distribution of dN/dS and p-distance values, respectively, obtained from the analyses of all the 874 genes from the 53 strains. The horizontal axis represents the C. trachomatis chromosomal positions where genes are placed in their chromosomal order, from the CT001 to the CT875 (genes names and positions according to D/UW-3/CX strain annotation). Panel C shows the 25 genes (ordered by their relative chromosomal position) that displayed the higher values for both analyses, which are representative of the lack of correlation between dN/dS and polymorphism.
Figure 6. Differences obtained during the analyses using 53 and 17 strains.
The graphs show the differences obtained between the results of the p-distance (panel A) and the dN/dS (panel B) analyses of all the 53 and the set of 17 strains (representative of the majority of the tree branches). Each black dot represents one of the 100 polymorphic genes selected for these comparisons. P-values were calculated through the paired two-tailed t test.
(iii) Species polymorphism versus number of taxa. We aimed to assess if the results obtained through the analyses of polymorphism and selective pressure depend on the number of sequences that are used. Thus, besides using all 53 strains, we also selected a group of 17 strains representative of the major branches of the phylogenetic tree constructed with the whole-genome sequences (Figure 3). Both groups of strains (17
vs 53) encompass the same set of 13 C. trachomatis serovars. We then used the 100 most polymorphic genes
(as they provide the vast majority of informative sites) and compared the distribution of polymorphism and dN/dS obtained from the analysis of the two groups (Figure 6). The P-values (paired two-tailed t test) calculated for the p-distance and the dN/dS results were 0.91 and 0.13, respectively, which indicates that these parameters do not depend on the number of same-serovar sequences that are used. Although the validity of the traditional CT681/ompA typing has been strongly questioned (as its tree does not segregate strains by tissue tropism properties and disease outcomes) (Harris et al. 2012), it is worth noting that a small group of strains encompassing the majority of the C. trachomatis serovars represent the main genetic variability of this bacterium.
DISCUSSION
Phylogenetic studies in C. trachomatis have been extensively performed, with tenths of genes already evaluated. Given the recent availability of more than 50 genomes, we sought to perform comparative genomics to scrutinize all the ~900 C. trachomatis genes. We aimed to assess their putative association with tropism, ecological success and disease outcomes, since different chlamydial serovars preferentially infect distinct human anatomic sites. In fact, the molecular basis underlying tissue specificity in C. trachomatis remains to be elucidated although it is believed that it may rely on SNPs or small indel events in specific genes (Nunes et al. 2013) given the tremendous genome similarity (> 98%) among sequenced strains.
We analyzed the putative association of genes with cell-appetence and found that only ~1.4% (12/874) of the proteins presented a plain segregation of strains according to the three disease groups. This low number is probably due to the existence of intra- and inter-genic recombination events that take place during mixed infections (believed to occur at a frequency of about 1% (Clarke 2011)), essentially involving the genital strains (Harris et al. 2012). Although C. trachomatis is known to be a low recombining bacterium, based on the frequency and relative weight of recombination and mutation events (Joseph et al. 2011; Ferreira et al. 2012; Joseph et al. 2012), recombination has been detected, even among different disease-causing strains, and hotspots were already identified (Harris et al. 2012; Gomes et al., 2007).
A radically different scenario is found for the lymph nodes niche, as the majority of the genes (~80%) segregate the LGV strains and 28% (245/874) segregate them in an exclusive manner (Figure 4 and Table 2). This corroborates the earliest divergence of these strains (Stephens et al. 2009) and/or their fastest evolutionary nature. The latter hypothesis is plausible as LGV strains are the only capable of infecting two distinct cell-types (epithelial and mononuclear phagocytes) and thus are more prone to undergo a wider set of molecular interactions. It is worth noting that the majority of the genes encoding T3SS effectors and Incs (known and putative) segregate the LGV strains. One interesting example is CT144 that codes for a putative substrate of the T3SS (da Cunha et al. 2014) and is likely involved in the “men who have sex with men” epidemiological sexual network (Christerson et al. 2012), for which most of LGV-specific polymorphisms are concentrated in ~150 bp on the first half of the gene (Nunes et al. 2008), highlighting this specific region as the one hypothetically involved in the interaction with the host cell. Another example comes from the well-studied T3SS effector Tarp (Translocated actin-recruiting protein) for which the enhanced phosphorylation found in LGV strains was shown to additionally promote high affinity interactions with proteins associated with the immune signaling pathways (Mehlitz et al. 2010), likely explaining the capacity of these strains to cross the mucosa epithelium and to infect mononuclear phagocytes.
We also observed that half of the C. trachomatis genes segregate strains of the most prevalent genital serovars, where 61 encode proteins displaying a mutational pattern that is exclusive of these strains. The majority of these genes (33/61) are genes encoding proteins that mediate basic cellular functions, like some redox reactions (CT078/folD, CT278/nqrB, CT539/trxA and CT745/hemG), structural ribosomal proteins
(CT125/rplM, CT506/rplQ, CT511, CT523/rplV, CT525/rplB and CT787/rpsN) and proteins intervenient in the translation process (CT193/tgt, CT437/fusA and CT851/map). However, given the tremendous representation of these functional categories in C. trachomatis genome, we can hardly assume that specific metabolic functions underlie the higher clinical prevalence of strains from serovars E and F. Nevertheless, it seems clear that these serovars share a singular genomic makeup. In fact, two recombinant strains classified as serovar D that cluster in the same branch as E and F are actually F-like strains, and so, the branch of the most ecological succeeded serovars involve exclusively taxa with E or F backbone.
Curiously, we also found that 173 genes (19.8%) co-segregated the strains from the most prevalent genital serovars and the LGV strains. Some relevant examples refer to CT651, a possible virulence factor since it is under the regulation of C. trachomatis plasmid (Song et al. 2013), and CT338 and CT619, two T3SS substrates (Muschiol et al. 2011; da Cunha et al. 2014). The easiest explanation for the existence of hundreds of shared polymorphisms between these two groups would be recombination. However, we consider that this scenario cannot be fully explained by recombination because it has been recently demonstrated that the genetic exchange between these two groups is believed to be restricted to limited genomic regions (Harris et al. 2012). An alternative hypothesis would be the existence of a short co-evolutionary process prior to LGV separation. Regardless any scenario, one may speculate that some of the shared polymorphisms may confer the strains from the most prevalent serovars some invasive properties. If that would be the case, it would mirror for instance the infection scenario of L. monocytogenes which is capable of surviving within macrophages and also replicating in a variety of nonphagocytic cells (Pizarro-Cerdá et al. 2012). Therefore, one could expect to identify E or F strains during recent LGV outbreaks in Europe and USA. However, the full-genome sequencing was not performed for all strains identified in those outbreaks and, to our knowledge, no E and F strains were identified so far, thus no immediate assumption can be made concerning specific phenotypes conferred by the related mutational pattern in those 173 genes between E/F and invasive strains.
We also identified several putative pseudogenes occurring in different strains, whose sequences were not considered for pairwise comparison analysis (Table 3). The most relevant cases were the genes that were truncated only for strains of the same disease group, as it is a strong indication of their expendability for a particular phenotype. Besides the well known trpRBA operon, whose functionality seems to be mandatory for any strain to infect the genitalia (Caldwell et al. 2003), we highlight the CT473, a lipid droplet-associated protein (Lda3) found to be translocated into the host cell cytoplasm and capture lipid droplets (Kumar et al. 2006), which is likely being lost on the course of the evolutionary process of the strains from prevalent genital serovars, and the CT037 (conserved hypothetical protein), which is a pseudogene for both the prevalent genital and LGV serovar strains. It is also noteworthy the identification of genes with differences in sequence length according to strains phenotype. This is the case, for instance, of CT833 (translation initiation factor) and CT852 (integral membrane component) that have longer sequences for all LGV strains, making them interesting targets for future evaluation of their putative role in each type of infection.
The analysis of polymorphism and dN/dS revealed no correlation between the two parameters, indicating that positive selection is highly targeted on specific genes or gene regions, or acts on strains with specific cell-appetence (Borges et al. 2012). Although our analysis was focused on the gene as a whole (leading to an underestimation of positive selection), it is notable that the genes with significant dN/dS > 1 were mainly incs and T3SS effectors encoding genes, whereas the most polymorphic ones code essentially for membrane and hypothetical proteins. This reinforces the assumption that proteins involved in strict pathogen-host interactions during the infection process are more prone to fix non-synonymous mutations, as previously reported in smaller scale studies (Almeida et al. 2012; Borges et al. 2012). On the other hand, polymorphism seems to occur more pronouncedly in genes of different functional categories and may be due to discrete genetic drift, as most of the polymorphism is given by dS.
Finally, despite the controversial use of the traditional ompA-based typing method, it is worth noting that the main genetic variability within the C. trachomatis species is given by the different serovars, where additional strains from the same serovar contribute with few novel polymorphisms (driven either by drift or positive selection) that may impact the individual gene phylogenies (Figure 6).
As concluding remarks, this in silico prediction of C. trachomatis tropism-associated genes may constitute an important database of the genes possibly involved in the phenotypic differences among the chlamydial strains regarding cell-appetence, virulence and ecological success. It will certainly be an important tool for prioritising the targets for studies aiming to understand the molecular mechanisms underlying the different types of infection.
ANNEXES
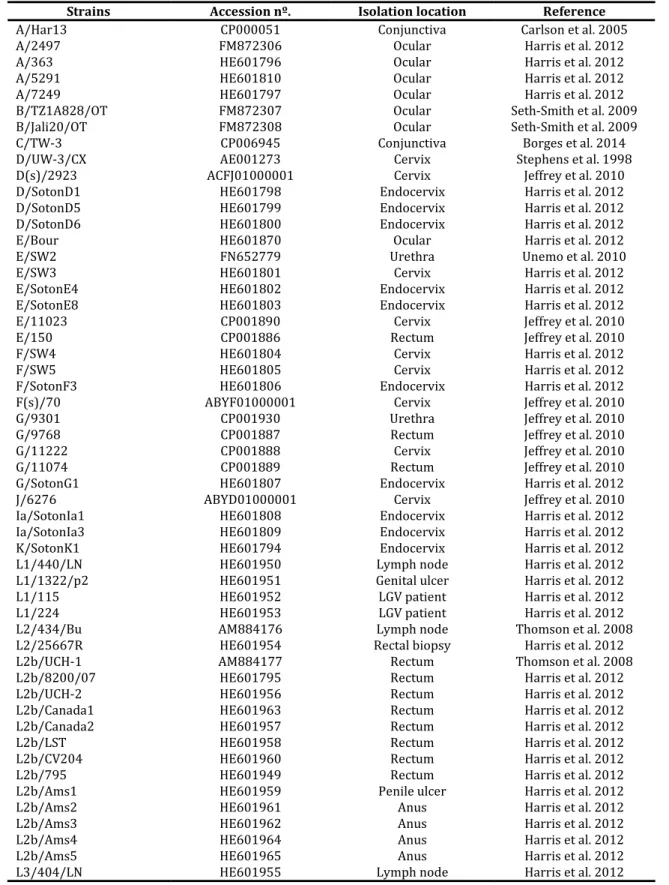
Table S1. C. trachomatis strains used in the present study.
Strains Accession nº. Isolation location Reference
A/Har13 CP000051 Conjunctiva Carlson et al. 2005
A/2497 FM872306 Ocular Harris et al. 2012
A/363 HE601796 Ocular Harris et al. 2012
A/5291 HE601810 Ocular Harris et al. 2012
A/7249 HE601797 Ocular Harris et al. 2012
B/TZ1A828/OT FM872307 Ocular Seth-Smith et al. 2009 B/Jali20/OT FM872308 Ocular Seth-Smith et al. 2009 C/TW-3 CP006945 Conjunctiva Borges et al. 2014 D/UW-3/CX AE001273 Cervix Stephens et al. 1998 D(s)/2923 ACFJ01000001 Cervix Jeffrey et al. 2010 D/SotonD1 HE601798 Endocervix Harris et al. 2012 D/SotonD5 HE601799 Endocervix Harris et al. 2012 D/SotonD6 HE601800 Endocervix Harris et al. 2012
E/Bour HE601870 Ocular Harris et al. 2012
E/SW2 FN652779 Urethra Unemo et al. 2010
E/SW3 HE601801 Cervix Harris et al. 2012
E/SotonE4 HE601802 Endocervix Harris et al. 2012 E/SotonE8 HE601803 Endocervix Harris et al. 2012 E/11023 CP001890 Cervix Jeffrey et al. 2010
E/150 CP001886 Rectum Jeffrey et al. 2010
F/SW4 HE601804 Cervix Harris et al. 2012
F/SW5 HE601805 Cervix Harris et al. 2012
F/SotonF3 HE601806 Endocervix Harris et al. 2012 F(s)/70 ABYF01000001 Cervix Jeffrey et al. 2010 G/9301 CP001930 Urethra Jeffrey et al. 2010 G/9768 CP001887 Rectum Jeffrey et al. 2010 G/11222 CP001888 Cervix Jeffrey et al. 2010 G/11074 CP001889 Rectum Jeffrey et al. 2010 G/SotonG1 HE601807 Endocervix Harris et al. 2012 J/6276 ABYD01000001 Cervix Jeffrey et al. 2010 Ia/SotonIa1 HE601808 Endocervix Harris et al. 2012 Ia/SotonIa3 HE601809 Endocervix Harris et al. 2012 K/SotonK1 HE601794 Endocervix Harris et al. 2012 L1/440/LN HE601950 Lymph node Harris et al. 2012 L1/1322/p2 HE601951 Genital ulcer Harris et al. 2012 L1/115 HE601952 LGV patient Harris et al. 2012 L1/224 HE601953 LGV patient Harris et al. 2012 L2/434/Bu AM884176 Lymph node Thomson et al. 2008 L2/25667R HE601954 Rectal biopsy Harris et al. 2012 L2b/UCH-1 AM884177 Rectum Thomson et al. 2008 L2b/8200/07 HE601795 Rectum Harris et al. 2012 L2b/UCH-2 HE601956 Rectum Harris et al. 2012 L2b/Canada1 HE601963 Rectum Harris et al. 2012 L2b/Canada2 HE601957 Rectum Harris et al. 2012 L2b/LST HE601958 Rectum Harris et al. 2012 L2b/CV204 HE601960 Rectum Harris et al. 2012 L2b/795 HE601949 Rectum Harris et al. 2012 L2b/Ams1 HE601959 Penile ulcer Harris et al. 2012
L2b/Ams2 HE601961 Anus Harris et al. 2012
L2b/Ams3 HE601962 Anus Harris et al. 2012
L2b/Ams4 HE601964 Anus Harris et al. 2012
L2b/Ams5 HE601965 Anus Harris et al. 2012