I
Sarah Gamal Muhammed Abdelkader
February 2018
Pointing to a Place Across a Barrier.
Pointing to a Place Across a Barrier.
Study of Barriers Effect on Human Survey Knowledge.
Dissertation supervised by
Jakub Krukar, PhD
Institute for Geoinformatics (IFGI),
Westfälische Wilhelms-Universität, Muenster, Germany.
Angela Schwering, PhD Professor
Institute for Geoinformatics (IFGI),
Westfälische Wilhelms-Universität, Muenster, Germany.
Marco Painho, PhD Professor
NOVA Information Management School,
Universidade Nova de Lisboa, Lisbon, Portugal.
I
Declaration
I hereby certify that this thesis, entitled “Pointing to a Place Across a Barrier: Study of Barriers Effect on Human Survey Knowledge”, has been entirely composed by me and is based on my own work and under the guidance of my supervisors. Data collected by me is genuine and was used exclusively in this thesis. No other person’s work has been used without due acknowledgment. All the references used have been cited, and all sources of information, including graphs, illustrations and data sets, have been specifically acknowledged.
Signature:
February 2018 Münster, Germany
II
Acknowledgments
First of all, I would like to admit that no words can express how thankful I am to God Almighty for the blessings he shed on me throughout my life, and the success I therefore achieved.
I would like to express my gratitude to my supervisor Dr. Jakub Krukar for his continuous help and support, from the very beginning all the way throughout the thesis process. My gratitude extends to my co-supervisors Prof. Angela Schwering and Prof. Marco Painho for the guidance they offered, and for their constructive feedback that paved the way to me to improve my work and present it in the best way possible.
I thank you all for your motivation, vital comments, discussions and insightful remarks that inspired me and gave me the strength to get over all the challenges I faced.
Many thanks go to all my international friends I had in Spain and Germany. My deepest gratitude to Emad Hawish and Anke Makowski for being there through my ups and downs, and for sharing all those unforgettable moments during my stay in Münster. My extended gratitude to Nourhan Khalifa who encouraged me and gave me valuable advice through her previous experience with this study program.
The same applies to my friends back home for the support they always showed and the high spirit they could relay to me.
Finally, I would like to express my sincere thanks and gratitude to my beloved family who has always been by my side, offering unconditioned endless support, love and caring.
To all of you, I would say that your help and support has incredibly and effectively given me the confidence and enthusiasm to go on with high spirit, have my thesis completed and my dreams come true.
III
by Sarah Abdelkader
Abstract
People use their mental representation of space to perform activities that involve spatial tasks. Over the past decades, several methods were applied to study the effect of different factors on the way people acquire spatial knowledge.
Through a pointing task, this study attempts to investigate the influence of spatial barriers on human survey knowledge in an outdoor environment. The task involved pointing from the same origin to targets in two separate conditions: one target lies across a barrier and another with no barrier in the pointing direction. The experiment was conducted in three locations: two in Muenster city and one in Dortmund city. A total of 204 random subjects participated in the whole experiments. In each location, the number of subjects participating was divided into two equal groups, each group pointing in only one separate condition. Subjects were asked to give an estimation of the direction to the target using a 360° dial, followed by a question about the direction they would go to get to that target. Pointing errors away from the target were calculated and analysed.
Preliminary results of the study highlighted interesting patterns in the distribution of pointing error in each condition. One major finding of the study reveals that participants made a higher error in case of pointing across a barrier. In two of the study locations, the results show that in such a case, the pointing error is more biased in accordance with people’s path preference when crossing a barrier to reach a destination, while this effect was not observed in the third location.
The study suggests a new viewpoint of understanding how barriers can have an impact on survey knowledge acquisition, and therefore, opens the door to more comprehensive research on this effect. The results also imply that in some cases, such an effect might need to be considered in the process of developing orientation-based applications.
Study of Barriers Effect on Human Survey Knowledge.
IV
Table of Contents
Acknowledgments ---II Abstract --- III Table of Contents --- IV Table of Figures --- VI Table of Tables ---IX Keywords ---X Acronyms ---XI 1. Introduction --- 1 1.1 Background --- 1 1.2 Problem Statement --- 2 1.3 Study Aim --- 2 1.4 Research Question --- 21.5 Organisation of the Thesis --- 3
2. Related Work --- 4
2.1 Spatial knowledge frameworks --- 4
2.2 Spatial orientation across different environments --- 5
2.3 Influence of Barriers --- 7 3. Overall Method ---10 3.1 Task Preparation ---10 3.2 Study Locations ---10 3.3 Selection of Targets ---10 3.4 Subjects ---11 3.5 Study Hypothesis ---12
V
4. Field Experiment ---13
4.1 Location 1: Dortmund Main Railway Station ---13
4.1.1 Procedure ---15
4.1.2 Results ---15
4.2 Location 2: Lake Aa in Muenster city ---21
4.2.1 Procedure ---23
4.2.2 Results ---23
4.3 Location 3: Muenster Main Railway Station ---29
4.3.1 Procedure ---31 4.3.2 Results ---31 5. Discussion ---37 5.1 Location 1 ---38 5.2 Location 2 ---40 5.3 Location 3 ---41 6. Conclusion ---43 6.1 Contribution ---43 6.2 Study Limitation ---43 6.3 Future Recommendations---45 Bibliography ---46 Appendices ---49
VI
Table of Figures
Figure 1: The pointing location and the pointing directions to the chosen targets (Location 1). ---13 Figure 2: Barrier Condition. Walking path from the origin to the cinema through the tunnel (Location 1). ---14 Figure 3: No Barrier Condition. The walking path from the origin to the Football Museum (Location 1). ---14 Figure 4: Pointing vectors to the direction of the target across the barrier (Location1). ---15 Figure 5: Barrier Condition. The distribution of pointing errors to the direction of the target (Location 1). ---16 Figure 6: Barrier Condition. Pointing error distribution of the two categories classified based on the match between the direction of pointing error and the path preference (Location 1). ---17 Figure 7: Pointing vectors towards the direction of the target in the absence of a barrier (Location1). ---18 Figure 8: No Barrier. The distribution of pointing errors in the direction of the target (Location 1). ---18 Figure 9: Distribution of pointing error towards the left of the pointing direction to the target in each condition (Location 1). ---20 Figure 10: Distribution of pointing error towards the right of the pointing direction to the target in each condition (Location 1). ---20 Figure 11: The pointing location and the pointing directions to the chosen targets (Location 2). ---21 Figure 12: Barrier Condition. Two routes crossing the lake from the pointing location towards the Zoo (Location 2). ---22 Figure 13: No Barrier Condition. The walking path from the pointing location towards the student dormitory (Location 2). ---22 Figure 14: Pointing vectors to the direction of the target across the barrier (Location2). ---23
VII Figure 15: The distribution of pointing error towards the target in the barrier condition (Location 2). ---24 Figure 16: Barrier Condition. Pointing error distribution of the two categories classified based on the match between the direction of pointing error and the path preference (Location 2). ---25 Figure 17: Pointing vectors to the direction of the target in the absence of a barrier (Location2). ---26 Figure 18: No Barrier. The distribution of pointing errors towards the direction of the target (Location 2). ---26 Figure 19: Distribution of pointing error towards the left of the pointing direction to the target in each condition (Location 2). ---28 Figure 20: Distribution of pointing errors towards the right of the pointing direction to the target in each condition (Location 2). ---28 Figure 21: The pointing location and the pointing directions to the chosen targets. (Location 3). ---29 Figure 22: Barrier Condition. Three route options that can lead to the location of the cinema. (Location 3). ---30 Figure 23: No Barrier Condition. The walking path from the pointing location towards the Highschool of Music (Location 3). ---30 Figure 24: Pointing vectors to the direction of the target across the barrier (Location 3). ---31 Figure 25: Barrier Condition. Distribution of pointing error in the directions of the target (Location 3). ---32 Figure 26: Barrier Condition. Pointing error distribution of the two categories classified based on the match between the direction of pointing error and the path preference (Location 3). ---33 Figure 27: Pointing vectors to the direction of the target in the absence of a barrier (Location 3). ---34 Figure 28: No Barrier Condition. Distribution of pointing error in the directions of the target (Location 3). ---34
VIII Figure 29: Distribution of pointing errors towards the left of the pointing direction to the target in each condition (Location 3). ---36 Figure 30: Distribution of pointing errors towards the right of the pointing direction to the target in each condition (Location 3). ---36
IX
Table of Tables
Table 1: Field Experiment details in the three locations ---11 Table 2: Descriptive Statistics of the distribution of pointing error in Barrier Condition (Location 1). ---16 Table 3: Descriptive Statistics of the distribution of pointing error in No Barrier Condition (Location 1). ---19 Table 4: Descriptive Statistics of the distribution of pointing error in Barrier Condition (Location 2). ---24 Table 5: Descriptive Statistics of the distribution of pointing error in No Barrier Condition (Location 2). ---27 Table 6: Descriptive Statistics of the distribution of pointing error in Barrier Condition (Location 3). ---32 Table 7: Descriptive Statistics of absolute value of errors in No Barrier Condition (Location 3). ---35 Table 8: Summary of the significance test results used to test hypothesis 1. ---37 Table 9: Summary of the significance test results used to verify hypothesis 2. ---38
X
Keywords
Spatial Barrier Barrier Effect Cognitive Map
Survey knowledge Acquisition Pointing Bias
XI
Acronyms
Acronym Definition SD Standard Deviation M Median value B Barrier Condition NB No Barrier Condition1
1. Introduction
1.1 Background
We learn about the location of specific places and the routes we frequently travel through our daily activities; whether going to university, to work or to a supermarket. Depending on our different individual abilities, we store the exact locations of those places and routes in our memory. Linking those locations along with the routes stored in our minds forms what is called cognitive maps (Hegarty, Montello, Richardson, Ishikawa, & Lovelace, 2006; Wolbers & Hegarty, 2010).
People tend to retrieve those stored maps in their minds when they come across situations that require the use of spatial knowledge. A case when this frequently happens is, for example, when someone asks a local citizen about the location of a certain place in the city. Depending on the individual differences of how people build their cognitive maps (Ishikawa and Montello, 2006), they respond to this question in several ways. Some people start by estimating the location of the destination in relevance to their current position. Other people will adjust their position by facing the direction of walking and start giving directions to this destination. Another will point to the location of that place, and explain the route to follow to reach this destination. In all those techniques, people use their mental image of the city to decide where the exact location of this place is, and which route to follow to get there (Lynch, 1960).
In a situation when people are familiar with both locations, their current location and the destination, it is expected that the error of pointing around the direction of the destination will be randomly distributed. However, it was noticed in the study carried out by Schwering et al. (2017), which involved a pointing task, that in some cases the pointing error is biased away from the direction of the target to the left or right direction. This phenomenon is likely to occur when the pointing direction differs from the commonly used route to that target. Such a condition can be observed in the presence of a spatial barrier in the direction of pointing to the target.
2 1.2 Problem Statement
As defined in Merriam-Webster dictionary (Barrier, 2014), a barrier is any kind of obstacle that blocks the ability to do a certain activity. In this study, I refer to a barrier as the spatial element that limits the direct movement to only a few specific passages. In other words, to reach a destination on the other side of this barrier, one must follow a certain route to get to a point from which it would be possible to cross to the other side. Examples of the barriers that I deal with in this study are railway stations and small lakes which can be crossed either through footbridges or tunnels.
This study is an attempt to address the issue that happens when reaching the destination requires a detour either to the left or the right direction, depending on the available options as well as the personal preferences, to get to the path crossing that barrier. At the same time, pointing to the location of that target is still possible even in the presence of the barrier. In such a situation, it is obvious that the pointing direction does not correspond to the walking direction, accordingly causing a contradiction between the stored route knowledge and survey knowledge.
1.3 Study Aim
The aim of the study is to examine the degree of distortion resulting from the conflict between pointing direction and walking direction, upon estimating the location of a target across a barrier. Consequently, this helps in understanding to what extent survey knowledge acquisition might be influenced in similar cases.
1.4 Research Question
The research question of the study is composed of two parts. The first part studies the relation between the pointing bias and route used to cross the barrier. The second part investigates whether there is a difference in the pointing accuracy in case of pointing to a target across a barrier and the pointing in the absence of a barrier. To test the validity of those two assumptions, I performed a field experiment in three different location. The experiment is a pointing task in which two groups of participants were tested. One group was asked to point to the direction of a target across a barrier and the other group pointing to another target in the absence of a barrier.
3 The results were then recorded and the pointing error distribution between the two groups was compared. In the next step, I analysed the distortion in the condition of a barrier and checked whether there is a relation between the bias of people’s pointing and their route preference in crossing the barrier.
Then I compared the distribution of error between the group pointing across a barrier and the other pointing in the absence of a barrier to check for the difference of pointing accuracy between them.
1.5 Organisation of the Thesis
In the first part of the thesis, I start by discussing the frameworks developed to understand people’s spatial knowledge and I demonstrate the different studies that investigated how barriers affect the way people acquire and develop their spatial knowledge.
Following this, I explain thoroughly the overall method applied in the field experiment that was performed to test the hypothesis.
In the next section, the results of the experiment in each of the study locations were demonstrated. Then, I move to the next section where I discuss the results of the experiment and check the validity of my assumptions.
4
2. Related Work
People acquire knowledge about the surrounding space as they perform their daily life activities. This knowledge is shaped by what they directly see, hear, and experience when moving through the environment. Spatial knowledge can be also gained indirectly from other forms as in maps, diagrams, virtual reality or using navigation applications (D. R. Montello, Hegarty, & Richardson, 2004). This information about locations is stored in people’ s mind and they construct the base of cognitive maps (Lynch, 1960). People retrieve this information when they are in a situation that requires achieving a spatial task.
In this section, I will go through different approaches from which researchers examined spatial orientation.
2.1 Spatial knowledge frameworks
The question of how people navigate in space have been under investigation in different fields of study. Researchers worked over the past decades on defining frameworks to investigate how people develop their mental maps and use it to orient in space. Siegel and White (1975) suggested a framework classifying human spatial knowledge into three types of knowledge: landmark knowledge, route knowledge, and survey knowledge. Earlier, this framework was referred to as the dominant framework. Based on this dominant framework, landmarks are defined as specific features in a precisely defined location. Route knowledge is the sequential order of landmarks and the connecting paths from one to another. Survey knowledge is the level of information gained and by which people can estimate distances and directions in space.(Skagerlund, Kirsh, & Dahlbäck, 2012) In their framework, Siegel and White claimed that spatial memory is gradually developed over time from landmark knowledge to route knowledge until reaching the highest level of acquiring survey knowledge.
In further research, Montello (1998) introduced an alternative framework of how people build their cognitive maps; through what was later called the continuous framework.
5 His argument stated that in a new environment survey knowledge can be acquired in a relatively early stage along with landmark or route knowledge. In the results of their study, Ishikawa and Montello (2006) emphasized that the accurate acquisition of survey knowledge is highly influenced by individual differences and not only based upon the long timeframe of interaction with the surrounding. Although they agreed with the continuous framework, they explained that it cannot be generalised for all individuals. They assumed that the continuous framework can be applied for people with high sense of orientation.
Wide range of researchers from the field geography as well as psychology is still interested in understanding the mechanism by which people build their cognitive maps and how the space elements contribute to their development.
2.2 Spatial orientation across different environments
To understand how people acquire spatial knowledge, it is important to study the way they develop their orientation skills in different environments, and what can affect the way they perform spatial tasks within this environment. Accordingly, we can identify the factors that contribute to developing their cognitive maps.
From the same perspective, multiple examples in the literature have explored how the nature and the scale of the surrounding environments can influence spatial knowledge acquisition.
In the study done by Montello (2007), he stated various mechanisms by which the humans physically interact with the surrounding environment. Later, he illustrates how this interaction can influence human experience thus affect their behaviour. One example of the ways of interaction with the environment is through our senses. Taking walls as an example of a spatial element in an environment, they are built for multiple reasons. From one perspective they provide a shelter or give some privacy, but for others, walls represent a barrier in the environment that blocks movement and visual access to a place. In each case, the perception of the importance of this element differs depending on the scale and the nature of the environment, consequently, the behaviour towards its presence will vary from a person to another.
6 One of the main spatial behaviours that is based on the interaction with the environment is the developing our sense of direction. As defined by Sholl et al. ( 2000) our sense of direction is the ability to estimate location and direction of a place, relative to another one. Sholl explained that our sense of direction can be also measured in terms of pointing accuracy to a previously known, yet not directly visible target. This takes us to the importance of visual access as a key factor in spatial orientation. Montello (2007) explained that visual access provides higher degree of understanding of one’s current location and the routes connecting to a destination, and thus gaining a better sense of orientation in an environment.
In the same sense, a study was carried out by Hegarty et al. (2006) trying to understand individual spatial differences in different scales of the environment, the results showed that there is a wide difference in spatial abilities between individuals in the performorance of spatial tasks in large scale environments. However, after learning about the environment thorugh direct contact, subjects showed a higher degree of accuracy and accordingly lower error was detected.
One key factor of measuring the accuracy in performing a spatial task in an environment is the magnitude of error. That is because the way errors are calculated can highly affect the results. In the experiment carried out by Ishikawa and Montello (2006) trying to investigate how people develop their estimation of distance in thus their spatial orientation, the indicator of accuracy was the value of error done by each subject. Being such an indicator Spray (1986) claimed that absolute error is the optimum indicator of measuring directional errors and calculating variable and constant error come in the second place. From another approach, Montello et al. (1999) highlighted that the analysis based on only calculating absolute error does not provide convenient results. He then argued that upon breaking the absolute error down into variable error and constant error, where the value of the error is directional (positive or negative), the calculated results become more meaningful. Previous studies show that several contributions were made, using various spatial tasks, trying to understand that factors affecting how people develop their sense of orientation, and what are the most precise ways by which the can identify that development.
7 2.3 Influence of Barriers
The influence of barrier on human spatial memory was investigated in several studies. During their study, Newcombe and Liben (1982) examined the relationship between age and cognitive map development in the presence of a barrier. Their study was an extension of the previous work of Kosslyn, Pick and Fariello (1974) who developed an experiment to study the effect of transparent and opaque barriers on spatial mapping.
After learning the location of ten toys, subjects were asked to estimate the distance between one toy and the others. The results demonstrated that children exaggerate their evaluation of distance in the presence of a barrier, despite whether this barrier restricts vision or not. Unlike children, adults tend to overestimate distances only in the case of visual barriers. Their explanation of this phenomena was based on the way subjects perceive space in the existence of a barrier. They pointed out that children divide space into smaller parts depending on the number of barriers in a space, whereas adults split space into sections only if they come across a barrier that prevents visual access to a location.
Newcombe and Liben (1982) replicated the study to examine whether the nature of the given task was the reason behind the limitation of children’s cognitive ability compared to adults. Thus, their new study focused on the performance of multiple orientation tasks in the presence of barriers.
Subjects first learned about the environment of the test, then they went through the procedure of two experiments. In the first experiment, subjects were asked to give a ranking for the distance of toys in relation to a given one. The question was repeated with each toy until the last one. In the other experiment, subjects were asked to estimate the distance between pairs of toys after moving one of them from its original position.
The results of the first experiment emphasized what Kosslyn, Pick, and Fariello (1974) proved about the relationship between age and distortion caused by barriers. However, results from the second experiment suggest that there is no significant evidence of this relation in the case of distance estimation.
8 Barriers exist in different forms and scales. Large parks, lakes, and mountains are examples of natural barriers in an outdoor environment. Built barriers range from the scale of indoor walls, to the scale of buildings, railways, industrial districts. As mentioned earlier, scientific studies proved that the nature of the environment influences the way we understand our surrounding space and navigate through it (D. R. Montello, 2007).
As pointing accuracy is seen a good indicator of human spatial orientation (Bell & Saucier, 2004), multiple experiments used it as a technique to understand the development of cognitive maps. In earlier studies, building a cognitive map in indoor locations was thought to be more complicated than outdoors as it faces multiple difficulties (Berry & Bell, 2014). One is the ability to have proper spatial representation of the relation between floors in a building, even after moving through it for several times(Moeser, 1988). In a study conducted to test the development of survey knowledge indoors, Moeser (1988) suggested that the complex design of the floors is the reason why it is difficult to navigate through. The complexity of the design is explained in terms of walls, corridors and rooms, which all represent a barrier of direct movement in an indoor space. Another difficulty in acquiring survey knowledge indoors is the ability to accurately estimate the location of outdoor elements and their relation to the indoor environment (Wang & Brockmole, 2003).
To further understand the individual differences between indoor and outdoor environments, Berry and Bell (2014) conducted a study based on a pointing task. The hypothesis of the study tested the impact of space elements in different environments on spatial orientation. The results confirmed the assumption of previous studies which illustrated that the level of space complexity affects the way people develop their mental maps (D. Montello & Sas, 2006). They observed that people’s pointing accuracy in the outdoor environment was higher than that in the indoors. One explanation for this phenomenon is the nature of the pointing environment. As claimed earlier, indoor space elements restrict movement and prevent visual access which in turn affects spatial orientation.
9 Although previous research thoroughly studied the factors affecting pointing accuracy as well as the distortion caused by space elements indoors, they did not specifically address the magnitude or the direction of that distortion away from a given target. Moreover, there is still a need to study how the spatial barriers in an outdoor environment can impact the way people build their cognitive maps and thus develop their survey knowledge.
10
3. Overall Method
In this section, I will go through the overall method that was applied in the preparation process to perform the field experiment and test the study hypothesis.
3.1 Task Preparation
The field experiment was conducted in the form of a pointing task that involved two questions. Using a 360° dial, depicted in Appendix A, subjects were first asked to decide, at their best estimation, the angle that points to the exact location of a predefined target. In all the pointing trials, the zero of the dial was pointing towards the area where the target is located, but not necessarily pointing to its exact location. In the next question, subjects were asked about the direction of the route that they would follow to get to the target.
3.2 Study Locations
The experiment took place in three locations: two in Muenster city and one in Dortmund city in Germany. The pointing locations were chosen so that the condition of having a barrier in the direction of pointing, from a certain location to a defined target, is applicable. As explained earlier, an essential part of the experiment design is to let the direction of the path used to cross that barrier and reach the target differs from the direction of pointing to this target.
3.3 Selection of Targets
From each pointing location two targets were selected to meet a certain condition: • Barrier condition, where a barrier lies between the pointing location and the
target, so that people will have to point across the barrier to the target whereas they follow a path in a different direction to get there.
• No barrier condition: where no barrier exists between the pointing location and the target so the walking path corresponds with the pointing direction. In both conditions, barrier and no barrier, targets are not visible from the pointing location. The reason behind this is to let people depend on their own survey knowledge to estimate the location of the target.
11 One of the main criteria for choosing a target is being a local landmark. According to previous studies, this makes it easier for people to recall the location of this landmark in their cognitive map when asked about its location (Steck & Mallot, 2000). However, this made it challenging to find two targets with equal distance from the same pointing location that can validate the desired criteria.
3.4 Subjects
The subjects who participated in the experiment were recruited from the pedestrians walking along the defined study points. The subjects were randomly selected to avoid any bias in the collected data. Neither the age nor the gender of the subjects was significantly considered in the study. The number of subjects in each location is illustrated in Table 1.
Because subjects are asked the same two questions in each condition, I decided to divide the participants into two equal groups in each pointing location: the first group were asked to point to the target in the barrier condition and the second group were asked to point to another target in no barrier condition. By applying this separation between the two groups, I would guarantee that subject’s answers will not be biased as a result of knowing the questions in advance.
The experiment is a simple pointing task; thus, no preliminary training was required. However, it was essential that the subject is a resident of the city or is at least familiar with the city and its well-known buildings.
The following table summarizes the experiment design in each of the three locations.
ID Location subjects Total Condition Displacement in meters (origin target) Subjects per condition 1 Dortmund Railway Station 60 Barrier 350 m 30 No Barrier 350 m 30 2 Lake Aa, Muenster 64 Barrier 850 m 32 No Barrier 850 m 32 3 Muenster Railway Station 80 Barrier 835 m 40 No Barrier 500 m 40
12 3.5 Study Hypothesis
The first hypothesis that I am testing in this study expects that the error of pointing from a location to a target that lies across a barrier is biased more towards the direction of the path that people prefer to follow to cross that barrier. On the other hand, pointing error in the case of no barrier is random, with no bias in any specific direction.
The second hypothesis assumes that the pointing to the direction of a target across a barrier results in a higher distortion, thus higher pointing error, than in the case on pointing where no barrier exists in the pointing direction.
13
4. Field Experiment
This section is divided into three main parts. Each part describes the procedure and the results of the experiment for each of the selected study locations separately. In this experiment, the key factor that can demonstrate a significant difference between the two conditions is the magnitude of pointing error.
In the first part of the analysis, I calculate the absolute value of error in the barrier condition. I use the calculated values to identify whether they are biased in the direction of the route followed to cross the barrier.
In the second part, I follow the same methodology explained by Montello (1999). I first begin with computing the magnitude of error away from the direction to the target in each condition. Then, I compare the value of those errors between both conditions.
All the measured in this experiment are in degrees. 4.1 Location 1: Dortmund Main Railway Station
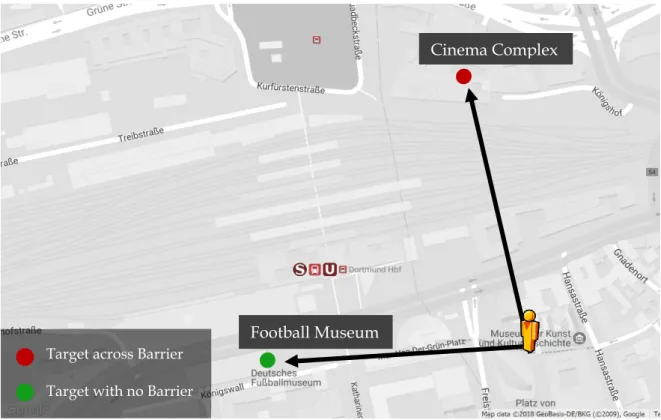
The two pointing targets chosen for this experiment are Dortmund Cinema complex and Dortmund Football Museum (Figure 1).
Figure 1: The pointing location and the pointing directions to the chosen targets (Location 1).
Target across Barrier Target with no Barrier
Cinema Complex
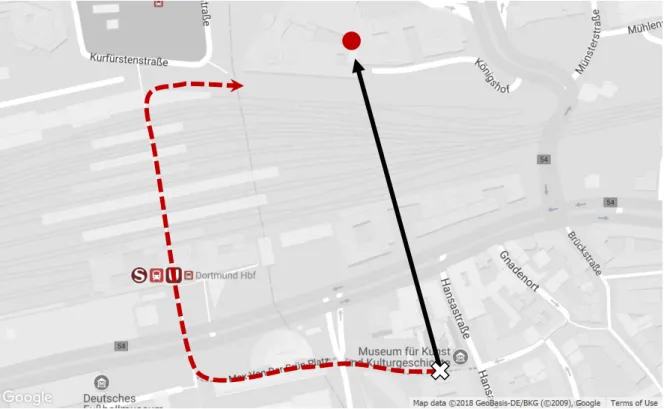
14 The well-known route used to cross the railway station and reach the cinema is through a tunnel that goes under the railways, illustrated in Figure 2. The pointing location was chosen so that the pointing direction would differ from the direction of walking towards the tunnel used to cross the railway station. Thus, it satisfies the criteria of the barrier condition and makes it a valid location to test my hypothesis.
Figure 2: Barrier Condition. Walking path from the origin to the cinema through the tunnel (Location 1).
On the contrary, in the case of no barrier the route to the football Museum corresponds with the pointing direction as illustrated in Figure 3.
Figure 3: No Barrier Condition. The walking path from the origin to the Football Museum (Location 1).
15
4.1.1 Procedure
Sixty participated were recruited in this study. The number of participants was divided equally into two groups. Using the dial, thirty subjects were asked to point to the location of the cinema on the other side of the station and the other thirty were asked to point to the museum where there is no barrier in the pointing direction.
4.1.2 Results
For all the recorded angles, a correction was made so that the zero direction coincides with the exact direction of the target. The pointing results of subjects were analysed within each condition separately, then compared across both conditions.
Barrier Condition
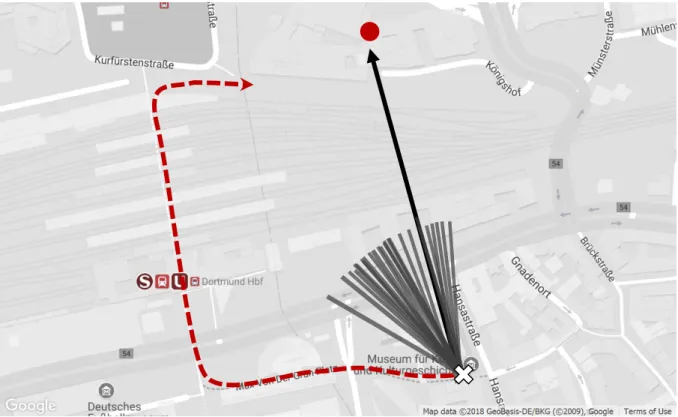
• Pointing errors around the target
The pointing vectors of the subjects, illustrated in Figure 4, show that the pointing is distributed on both sides of the direction to the target. Considering the zero as the exact pointing direction to the target, the data collected in the barrier condition shows that the error to the left side of the target is higher than in the right direction as shown in Figure 5.
16
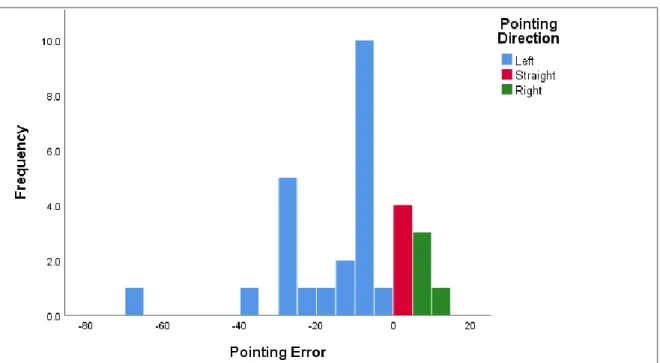
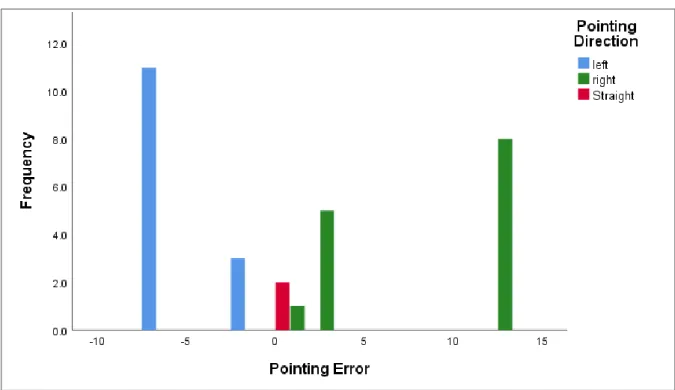
Figure 5: Barrier Condition. The distribution of pointing errors to the direction of the target (Location 1).
In Figure 5, the negative values are translated as the errors towards the left side of the pointing direction to the target, whereas the positive values are translated as the error towards the right side. The pointing vectors with no bias in any direction are referred to as straight. From Figure 5, we observe that the distribution of error is biased more towards the left direction. To compare the distortion between errors in both directions, a non-parametric T-test (Mann–Whitney U) was used. I am concerned with the magnitude of error on each direction, so I extracted the absolute value of pointing errors to perform the comparison. Table 2 summarizes the statistical properties of the absolute pointing error on each direction away from the location of the target.
Table 2: Descriptive Statistics of the distribution of pointing error in Barrier Condition (Location 1).
By excluding the straight vectors, and comparing the distribution of pointing error in the left and right directions, the result shows a significant difference between the distribution of pointing error on both sides towards the target (p = 0.007).
Absolute Error
Left Straight Right
Valid 22 4 4
Median 12.50 0.00 5.00
17 • Pointing Bias and Path Preference
In this part, I evaluate whether the bias of pointing error is correlated to the path preference. The results shown in Figure 4 are only classified according to the direction of the pointing error. This means, it is possible that some subjects might have pointed with an error to the left but chose to follow the route going in the right direction. Consequently, the results were reclassified, according to the match between the direction of their pointing bias and the path preference.
I ended up with two categories: “Towards path”, where the bias of pointing corresponds with the direction of the path chosen by the subject, and “Against path” where the bias of pointing contradicts the direction of the chosen path. Figure 6 illustrates the distribution of error based on the new classification.
Figure 6: Barrier Condition. Pointing error distribution of the two categories classified based on the match between the direction of pointing error and the path preference (Location 1).
24 subjects formed the “Towards” category whereas 2 subjects were in the “Against” category. The 4 subjects with no bias in pointing were excluded from the classification. From Figure 6, it can be observed that the distribution of error in the “Towards Path” category (M= 10°, SD= 14.91°) is higher than that in the “Against Path” category (M = 6.5°, SD = 2.12°). Using the significance test, the result shows a significant difference between the two categories (p = 0.028).
18 No Barrier Condition
• Pointing errors around the target
Pointing vectors in the direction of the target are illustrated in Figure 7.
Figure 7: Pointing vectors towards the direction of the target in the absence of a barrier (Location1).
Figure 8 clarifies the distribution of pointing errors of the collected vectors in the direction of the target.
19 In Table 3, the details of the pointing errors based on the direction of error from the target are illustrated, in absolute values.
Absolute Error
Left Straight Right
Valid 14 2 14
Median 7.00 0.00 13.00
Std. Deviation 2.13 0.00 5.33
Table 3: Descriptive Statistics of the distribution of pointing error in No Barrier Condition (Location 1).
After comparing the distribution of error on the left and right direction of the target, the significant test was applied, to show no significant difference between the pointing distribution on both sides of the direction to the target (p = 0.194).
20 Comparison Between Barrier and No Barrier
The pointing errors in barrier condition and no barrier condition were compared to each other. Figure 9 and Figure 10 illustrate the distribution of pointing error between the left directions and between the right directions of the targets respectively in each condition.
The distribution towards the left direction in B (M= 15.03°, SD = 12.50 °) is higher that NB (M= 2.13 °, SD = 7°). As for the error in the right direction, people performed less error in B (M = 5 °, SD = 2.5°) than in NB (M = 13 °, SD = 5.33 °). The t-test showed a significant difference between the pointing errors towards the left direction of the targets in both conditions (p < 0.001), whereas it did not show a significant difference in the pointing error towards the right direction (p = 0.721).
Figure 9: Distribution of pointing error towards the left of the pointing direction to the target in each condition (Location 1).
Figure 10: Distribution of pointing error towards the right of the pointing direction to the target in each condition (Location 1).
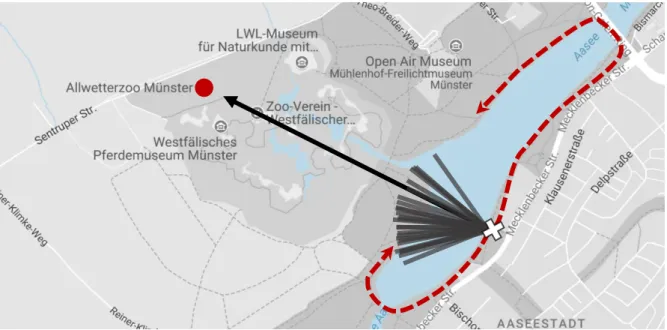
21 4.2 Location 2: Lake Aa in Muenster city
Lake Aa is one of the main attractions of Muenster city, Germany. Due to its large area, about half kilometre square, several bridges connect between its both sides. This makes it a good fit with the previously specified criteria for a spatial barrier.
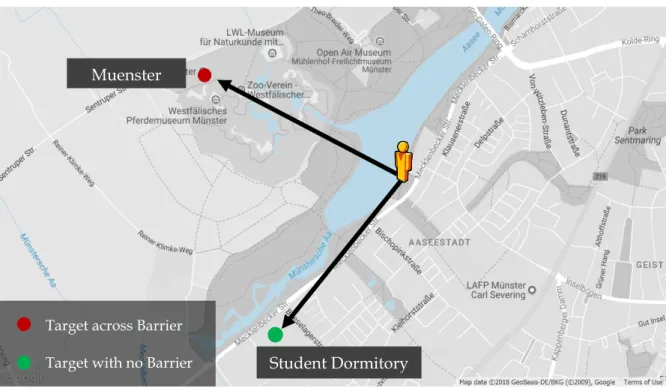
The pointing location was specified at one side of the lake. Two pointing targets were chosen: Muenster Zoo and a student dormitory. The dormitory was well-known due to its modern design and eye-catching colours. For those who had difficulty to recognise the name of the dormitory only from the name, an image was used as assistance during the experiment.
The zoo lies on the other side of the lake whereas the student dormitory is located on the same side of the pointing location as shown in Figure 11.
Figure 11: The pointing location and the pointing directions to the chosen targets (Location 2).
Target across Barrier Target with no Barrier
Muenster
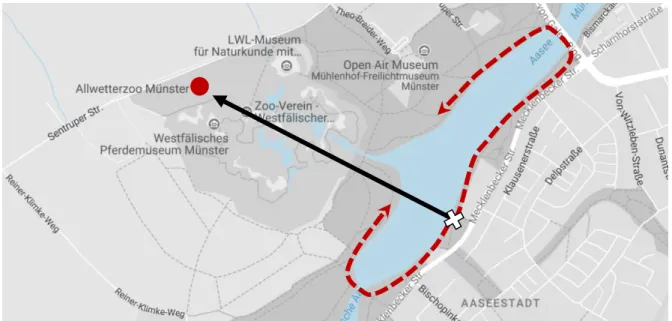
22 Unlike Location 1, where only one route was most commonly used, two walking routes are available to cross the lake and head to the zoo, one goes to the right direction and the other to the left direction, illustrated in Figure 12. In this case, the direction of pointing across the lake differs from both walking directions, thus validates this location to test the barrier condition.
Figure 12: Barrier Condition. Two routes crossing the lake from the pointing location towards the Zoo (Location 2).
Figure 13 shows the pointing location and the path towards the target. Because no barrier is present that can cause a change in direction, the angle between the pointing direction and the route is minimum.
Figure 13: No Barrier Condition. The walking path from the pointing location towards the student dormitory (Location 2).
23
4.2.1 Procedure
Sixty-four subjects participated in the field experiment. All the participants were citizens of the city of Muenster. After dividing the subjects into two equal groups, I applied the same procedure as in Location 1.
4.2.2 Results
Results are demonstrated in the same way as in Location 1. Data collected is analysed separately in each condition then compared to each other.
Barrier Condition
• Pointing errors around the target
The pointing vectors collected in the field pointing towards the direction of the zoo are shown in Figure 14. Distribution on both direction, left and right, away from the exact location of the target can be observed.
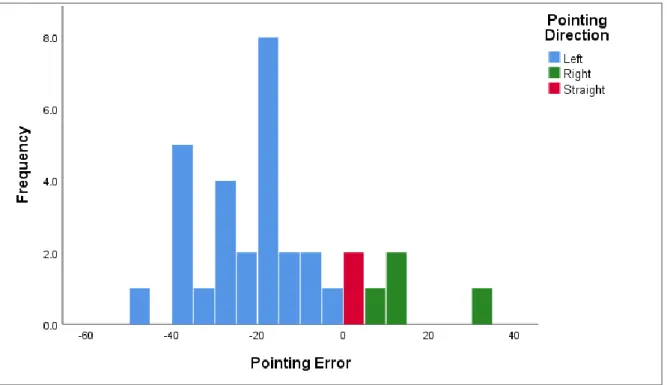
24 Figure 15 illustrates the distribution of pointing error towards the direction of the target. The errors are classified into three classes: left, right and straight, each one indicating the direction of pointing error away from the target. The distribution shows that subjects performed higher error towards the left direction of the target.
Figure 15: The distribution of pointing error towards the target in the barrier condition (Location 2).
The main statistical properties of the error distribution in absolute value are illustrated in Table 4.
Absolute Error
Left Straight Right
Valid 26 2 4
Median 22.50 0.00 10.00
Std. Deviation 11.33 0.00 11.09
Minimum 5.00 0.00 5.00
Maximum 50.00 0.00 30.00
Table 4: Descriptive Statistics of the distribution of pointing error in Barrier Condition (Location 2).
The straight vectors were excluded and the significance test was applied between the left and right error groups. The result of the test shows a significant difference between the pointing error on both directions of the location of the target (p=0.006).
25 • Pointing Bias and Path Preference
As explained in the results section of Location 1, errors were reclassified, based on the match between the direction of pointing bias and the path followed by each subject, into two categories: “Against Path” and “Towards path”.
According to the analysis of the collected data, the “Towards” category included 25 subjects while the “Against” category included 5 subjects. People who pointed in the straight direction were excluded from both categories.
The distribution in Figure 17 shows that distribution in the “Towards” category (SD = 12.01°, M = 25°) is higher than in “Against” category (SD = 5°, M = 15°).
Figure 16: Barrier Condition. Pointing error distribution of the two categories classified based on the match between the direction of pointing error and the path preference (Location 2).
A non- parametric significance test was applied to check for a difference between both categories. The result of the test shows a difference between both categories (p = 0.009).
26 No Barrier Condition
• Pointing errors around the target
The collected pointing angles recorded from the subjects during the filed study are illustrated in Figure 18. They show a higher tendency towards the left direction.
Figure 17: Pointing vectors to the direction of the target in the absence of a barrier (Location2).
Illustrated in Figure 19, the distribution of pointing error is higher towards the left direction of the target.
Figure 18: No Barrier. The distribution of pointing errors towards the direction of the target (Location 2).
27 To perform the significance test, the absolute value of errors was calculated. Table 5 shows a description of the statistical properties of the error distribution, in absolute values.
Absolute Error
Left Straight Right
Valid 25 1 6
Median 10.00 0.00 10.00
Std. Deviation 9.32 - 2.58
Minimum 5.00 0.00 10.00
Maximum 35.00 0.00 15.00
Table 5: Descriptive Statistics of the distribution of pointing error in No Barrier Condition (Location 2).
To evaluate the difference of pointing on the left and right directions of the target, a significance test was done, and the result did not show a significant difference between the distribution of error in both directions (p = 0.865).
Comparison Between Barrier and No Barrier
After comparing the results within each case separately, in this part I will compare the distortion of pointing between the barrier condition and the no barrier condition. First, the pointing error in the left direction of target are compared to each other in both conditions.
The distribution of the error towards the left in barrier and no barrier is illustrated in Figure 20. The same was applied for the pointing error to the right direction of the target in each condition. Distribution to the right in barrier condition (SD = 11.33°, M= 22.50°) shows a bias, illustrated in Figure 21.
To evaluate the distribution between both conditions, a significance text was done. The result of the test shows a significant difference between pointing errors to the left (p <0.001). However, the result of the test did not show a significant difference upon comparing the error of pointing towards the right of the target in both conditions (p = 0.762).
28
Figure 19: Distribution of pointing error towards the left of the pointing direction to the target in each condition (Location 2).
Figure 20: Distribution of pointing errors towards the right of the pointing direction to the target in each condition (Location 2).
29 4.3 Location 3: Muenster Main Railway Station
The third pointing location lies on one side of Muenster Main Railway Station. To get to the other side of the station, one should pass through one of the tunnels connecting between both sides of the station.
One advantage of this location is being on the main street, in front of a church and close to a public park which increases the probability of recruiting participants. Nevertheless, from this location, it was possible to find two targets, one across a barrier and one with no barrier, as shown in Figure 21. The first target is the Cinema which lies on the other side of the railway station and acts as a barrier in this case. The other target is the Highschool of Music located by the end of the street. The Highschool of Music has a unique design that makes it easy for participants to identify and recall its location.
Figure 21: The pointing location and the pointing directions to the chosen targets. (Location 3).
To reach the cinema from the pointing location, three route options are available. Two routes suggest walking to the left or right directions that contradict with the pointing direction, whereas the third route coincides with the pointing direction.
Target across Barrier Target with no Barrier
Highschool of Music
30 The walking routes are illustrated in Figure 22.
Figure 22: Barrier Condition. Three route options that can lead to the location of the cinema. (Location 3).
The route to the School of Music corresponds with the pointing direction, as illustrated in Figure 23.
Figure 23: No Barrier Condition. The walking path from the pointing location towards the Highschool of Music (Location 3).
31
4.3.1 Procedure
Eighty subjects were recruited to participate in the study. Forty of the subjects were asked to point to the location of the cinema, and the other forty were asked to point to the location of the university.
4.3.2 Results
Barrier Condition
• Pointing error around the target
Figure 24 shows that the pointing vectors cover a wide range on both sides of the direction of pointing to the target.
Figure 24: Pointing vectors to the direction of the target across the barrier (Location 3).
Although the error of pointing is not normally distributed, the distribution of pointing error shows a nearly equal distribution of error on both direction of the target. The distribution is illustrated in Figure 25.
32
Figure 25:Barrier Condition. Distribution of pointing error in the directions of the target (Location 3).
Table 6 summarizes the main statistical properties of the distribution of pointing error in absolute values.
Absolute Error
Left Straight Right
Valid 18 1 11
Median 22.50 0.00 20.00
Std. Deviation 12.51 - 9.24
Minimum 5.00 0.00 5.00
Maximum 45.00 0.00 30.00
Table 6: Descriptive Statistics of the distribution of pointing error in Barrier Condition (Location 3).
Although the distribution shows that frequency of the absolute pointing error towards the left was slightly higher, the difference between the distribution of error in the left and right directions was not significant (p = 0.190).
33 • Pointing Bias and Path Preference
In this study location, three paths can be followed and would eventually lead to one of the tunnels that cross to the other side of the station. Due to the availability of several options, path preferences were different. This led to having 24 subjects in the “Towards” category where the bias of their pointing matched their path preference, whereas the pointing bias did not correspond to the route for only 5 subjects represented in the “Against” category.
Figure 26 shows the distribution of error after the reclassification. Although the distribution of error in the “Towards” category is higher (M = 25°, SD = 12.23°) than “Against” category (M = 12.23°, SD =6.12°), the difference between both categories is statistically not significant (p = 0.244).
Due to the existence of a third route, this caused the subjects to use as a route towards the direction. The number of subjects with correspondence to the direction of the route preference is: Left = 18, Right = 5, Straight = 6.
Figure 26:Barrier Condition. Pointing error distribution of the two categories classified based on the match between the direction of pointing error and the path preference (Location 3).
34 No Barrier Condition
Figure 27 illustrates that the pointing vectors around the target are distributed where no bias in a specific direction can be noticed.
Figure 27: Pointing vectors to the direction of the target in the absence of a barrier (Location 3).
From the distribution in Figure 28, it can be observed that the pointing error extends with nearly same distribution in the left and the right directions towards the target.
Figure 28: No Barrier Condition. Distribution of pointing error in the directions of the target (Location 3).
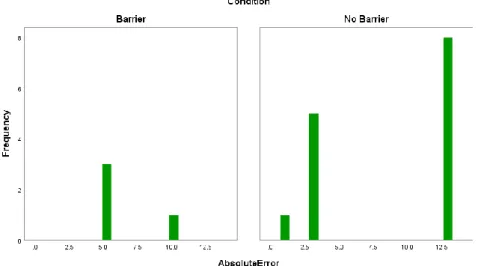
35 The number of subjects who pointed with error towards the left direction is two subjects more than the number of subjects who pointed with an error to the right direction, as shown in Table 7. It can be observed that there is a no difference between the average distribution of error, represented by the value of the median.
Absolute Error
Left Straight Right
Valid 14 4 12
Median 5.00 0.00 5.00
Std. Deviation 5.51 0.00 6.90
Minimum 3.00 0.00 5.00
Maximum 20.00 0.00 25.00
Table 7: Descriptive Statistics of absolute value of errors in No Barrier Condition (Location 3).
To confirm this, I applied the significance test which showed that there is no significant different between the error distribution in the two groups (p = 0.886).
36 Comparison Between Barrier and No Barrier
Again, the pointing errors between barrier condition and no barrier condition on each side of the target were compared. Figure 29 shows that the distribution of error towards the left direction of the target in barrier condition (M = 12.51°, SD = 22.5°) is higher than no barrier condition (M=5°, SD = 5.51°).
Figure 29 and Figure 30 illustrate the distribution of pointing error between the left directions and between the right directions of the targets respectively in each condition.
The t-test did shows a significant difference between the pointing errors towards the left direction of the targets in both conditions (p < 0.001), as well as between the pointing error towards the right direction in both conditions (p = 0.032).
Figure 29: Distribution of pointing errors towards the left of the pointing direction to the target in each condition (Location 3).
Figure 30: Distribution of pointing errors towards the right of the pointing direction to the target in each condition (Location 3).
37
5. Discussion
The experiment tested the two study hypotheses. The first hypothesis assumes that pointing across a barrier is biased towards the direction of the path followed to cross the barrier and reach the target.
The second hypothesis assumes that the distortion in pointing is higher in the condition of a barrier than in the absence of a barrier.
The first study hypothesis was statistically confirmed in Location 1 and Location 2 whereas it was not confirmed in Location 3. Table 8 provides a summary of the results testing the first hypothesis in each of the study locations and Table 9 demonstrates the results of the test used to verify the second hypothesis.
Location Significance Value Hypothesis 1
Location 1 0.028 Confirmed
Location 2 0.009 Confirmed
Location 3 0.244 Not Confirmed
38
Location Direction Condition Significance Value (p-Value) Hypothesis 2
Location 1
Left Barrier 0.001 Confirmed
No Barrier
Right Barrier 0.721 Not Confirmed
No Barrier
Location 2
Left Barrier <0.001 Confirmed
No Barrier
Right Barrier 0.762 Not Confirmed
No Barrier
Location 3
Left Barrier <0.001 Confirmed
No Barrier
Right Barrier 0.032 Confirmed
No Barrier
Table 9: Summary of the significance test results used to verify hypothesis 2.
5.1 Location 1
The results of the experiment confirm the first study hypothesis, as the bias of pointing corresponds with the path that people prefer to follow to reach the destination.
In the barrier condition, the distribution of pointing results shows a wide degree of distortion on both direction of the pointing direction to the target. Although those results were not classified based on the path preference for each subject, there was a higher bias of pointing towards the left direction (M = 12.50, SD = 15.03).
As explained earlier, the results of comparing the distribution of pointing errors to the left and to the right directions from the target to each other does not indicate that the bias is related to the direction of the path, therefore, a new classification was needed.
39 After the reclassification into “Towards” and “Against” was done, the bias remained towards the left direction but with a slightly lower average pointing error in “Towards” category (M= 10°, SD= 14.91°). One explanation for this decrease might be the neglection of the results for the subjects who pointed with no bias, yet chose a walking direction.
Looking into the “Against” category, the results show that although they chose a walking route contradicting with the direction of the pointing error, their degree of distortion was low (M = 6.5°, SD = 2.12°). This means, that the pointing error of most of the tested subjects is biased towards the selected route.
As for the No Barrier condition, the results show a higher tendency of pointing towards the right direction of the target. The route to that barrier can be the reason for this tendency as it is slightly deviated in the right direction as shown in Figure 2. However, the distribution of the left pointing error compared to the right error was statistically insignificant. This means that in the absence of a barrier, it is possible to have a degree of distortion, however, it does not mean that this effect is dominant. There is no need for such a classification in the no barrier condition, since the experiment itself was designed so that the pointing direction corresponds with the walking direction.
Upon comparing the pointing errors across barrier and no barrier, as expected, the results showed a significant difference in the pointing error between the left direction in both conditions, which supports the idea of higher distortion in no barrier condition compared to the barrier condition.
On the contrary, the distortion towards the right direction of the target did not show a significant difference between both conditions. This might be because of the low number of samples on that direction and thus affected the results.
The result indicates that the distortion exists in both conditions, however, the frequency of pointing in the barrier condition with a right error was low which implies that the bias was more towards the left direction from the target.
40 5.2 Location 2
The case in Location 2 is different form Location 1. In this location, two paths exist, one goes to the left direction and the other to the right direction from the pointing location. Although in such a case I would expect the pointing error to be normally distributed on the two sides of the direction to the target, the results showed a bias towards the left direction.
one might assume that the pointing location is the reason for the bias because it is closer to the left path than to the right so people’s pointing was biased towards that route. This can be a valid point if there was only a path to the left, but as shown in Figure 12, there is another route to the right direction that can be also followed. Moreover, the reclassified data confirmed the correlation between the pointing bias and the route followed, which means that subjects with error towards the left followed the route to the left, and same applies for subjects who pointed to the right. After checking the “Towards” category, it was observed that the number of subjects who achieved a match towards the left was 25 while the subjects who achieved a match towards the right direction were only 5. This provides a clear explanation for the high bias towards the left direction and not to the right.
In the no barrier condition, the significance test did not show a difference between pointing in the left and the right direction towards the target. However, it can be observed that the tendency of pointing towards the left (M = 10°, SD = 9.32°) is higher than in the right direction (M = 5°, SD = 2.58°). Possibly, this is again due to the pointing location. Figure 13 shows that Lake Aa lies on one side of the pointing direction to the target. This might have influenced the pointing direction as subject would logically assume that the target does not lie inside the Lake, so this made them exaggerate their estimation of the direction to the target far from the barrier, and more towards the left direction.
Despite that degree of distortion towards the left direction in the no barrier condition, there was significant difference found upon comparing the pointing error distribution towards the left direction, where the distribution of the pointing error in
41 the no barrier condition was higher. This can be an evidence on the effect of barriers on the pointing accuracy.
5.3 Location 3
In the barrier condition, three routes are available from the pointing location to the target. This makes it difficult to detect a bias in a specific direction, especially if the comparison will be based on the path preference.
The wide distribution of pointing error on the left direction (M= 22.50°, SD = 12.51°) and the right direction (M= 20°, SD = 12.51°) to the target, with a slight difference, implies that it is not likely to find a bias in any direction. This was approved, as the significant test did not suggest any noticeable difference between the two directions and thus, this result rejects the first study hypothesis.
The check for correlation between the bias of pointing and the path preference was performed as in Location 1 and 2. Subjects with no bias in pointing were excluded and the comparison was made between the “Towards” and the “Against” categories. Unsurprising, the significance test did not show a correlation between the pointing bias and the selected route (p = 0.244), which rejects the study hypothesis.
One explanation for this is the presence of a third route, which is a convenient option for subjects to choose as a walking path, caused the splitting of the path preference among three options rather than just two. Since the direction of this route in corresponds to the pointing location, it neglects the barrier effect under study that suggests a difference between walking and pointing direction. Consequently, the data of subjects pointing in this direction was excluded from the analysis and thus affected the final results of the significance test.
The pointing error distribution in no barrier condition showed an interesting finding. Although no significant difference was found between the pointing error distribution in both direction away from the target, the distribution on the left direction of the target (M = 5°, SD = 5.51 °) was close to that in the right direction to the target (M = 5°, SD = 6.9 °).
42 This raised a question of the reason why subjects would point with an error in the left direction although a roundabout (Figure 27) exists by the end of the street. The study done by Hölscher, Tenbrink and Wiener (2011) suggested an explanation for such cases. They explained that when giving route instructions to a stranger, people tend to give the direction where people should walk rather than the location. Their study mentioned that the expressions that people use are derived from directional terms. That can explain why in this study, when subjects were asked about the location of the target, their answer was “straight forward”.
Based on our experiment, we reach the result that the people are most likely to be distorted in estimating directions in environments that have spatial barriers. We could provide evidence that barriers have a noticeable effect on how people develop survey knowledge.
When comparing the distortion in pointing between the barrier and the no barrier condition, the test shows a significant difference between the distribution of error in both conditions in the left direction and the right direction to the target.
Although the experiment in this location did not show a correlation between the bias of pointing to a target across a barrier and the route followed to cross the barrier, it still suggests that degree of distortion in pointing is higher.
43
6. Conclusion
Barriers represent one of the fundamental elements of space, whether in an indoor or an outdoor environment. Existing in different forms and scales, barrier influence the way people acquire and retrieve their knowledge about the location of places in the surrounding environment.
6.1 Contribution
Although existing research applied various methods to measure the effect of barriers on spatial knowledge acquisition, the scope of this study is focused on the effect of barriers when their presence in a place makes the survey knowledge and route knowledge suggest contradicting directions.
The study argued that upon pointing to a target across a barrier, pointing accuracy is distorted away from the pointing direction to the target, and is more biased towards the direction of the route followed to cross the barrier. The study also assumed that pointing accuracy to the direction of a target across a barrier is distorted with a higher degree than in pointing to a target where no barrier exists.
The outcome of the pointing task performed to test the hypothesis was confirmed in two out of the three study locations. The results of the pointing experiment also showed that in the case of pointing across a barrier the pointing is biased more towards the direction of the path used to cross the barrier. Besides, after comparing the results between the pointing error, towards the right direction or the left direction of the target, in the presence of a barrier and when there is no barrier, the results demonstrated that in only two cases the distortion of pointing was no considerably higher in pointing across a barrier.
6.2 Study Limitation
Despite the noticeable effect of barriers on survey knowledge that was confirmed in two of the study locations, there might be a few drawbacks for the study that could be considered to provide a higher evidence on the presence of that effect.
One limitation of the study that I assume affected the results is the criteria of choosing the locations to perform the experiment. The pointing error might have been biased