Evaluating response strategies to
deal with Negative Word-of-Mouth
on Facebook pages of
Telecommunications Operators in
Portugal
Raquel Carneiro da Silva
152116200
Dissertation written under the supervision of
Professor: Daniela Langaro
Dissertation submitted in partial fulfilment of the requirements for the MSc
in Management with Specialization in Strategic Marketing, at the
Universidade Católica Portuguesa, January 2019.
II
ABSTRACT
Title: Evaluating response strategies to deal with Negative Word-of-Mouth on
Facebook pages of Telecommunications Operators in Portugal
Author: Raquel Carneiro da Silva
The Telecommunications represent one of the leading industries in Portugal when it comes to complaints and Negative Word-Of-Mouth (NWOM), including online NWOM. Providing efficient answers, basing them on an adequate response strategy, is one possible form of complaint management.
The goal is then to understand if an alternative response strategy could be applied, in order to deal with NWOM posted online by costumers, so that it could impact the intentions and opinions of other customers – who are exposed to this type of content. An extensive comparison between the current response strategy applied and what the existing literature suggests was made, so that an actual alternative response strategy could be proposed.
Later, an online questionnaire was created, as it was essential to develop an experimental in-between groups design. One group (A) was exposed to the current response strategy; while the other (B) was exposed to the alternative one proposed. Questions concerning customers’ opinions and intentions based on the three constructs proposed – Brand Attitude, Repatronage and Repurchase Intentions and NWOM Intention – were included.
The main conclusion obtained was that no improvements concerning customers’ intentions were reached, by applying the alternative response strategy proposed. The three formulated hypotheses – associated with the three proposed constructs – were rejected, as no statistically significant difference (between the two groups) was found. By exploring and proposing a concrete alternative response strategy, the current research adds not only academic but also managerial value.
To conclude, relevant limitations are discussed and future research orientations are proposed.
Keywords: eNWOM, service recovery, response strategy, brand attitude, repurchase
III
SUMÁRIO
Título: Análise de estratégias de resposta de forma a lidar com NWOM presente nas
páginas de Facebook das empresas de Telecomunicações em Portugal
Autor: Raquel Carneiro da Silva
As Telecomunicações representam uma das indústrias líderes no que diz respeito a reclamações e Word-Of-Mouth Negativo (NWOM), incluindo NWOM online. Responder eficientemente ao NWOM, baseando-se numa estratégia de resposta adequada, é uma forma possível de gestão de reclamações.
O principal objetivo é entender se uma estratégia de resposta alternativa poderia ser aplicada, para combater o NWOM publicado online por clientes, para que se pudesse influenciar as intenções e opiniões de outros clientes - que estão expostos a esse tipo de conteúdo.
Foi realizada uma extensa comparação entre a estratégia de resposta actualmente aplicada e o que a literatura existente sugere, para que uma estratégia de resposta alternativa pudesse ser proposta.
Posteriormente, um questionário online foi criado, visto que era essencial desenvolver um “design” experimental entre grupos. Um grupo (A) foi exposto à estratégia de resposta actual; o outro (B) foi exposto à estratégia alternativa proposta. Questões relativas à opinião e intenções dos consumidores, baseadas nos três constructos propostos – atitude face à marca, intenção de recompra e intenção de NWOM – foram incluídas.
A principal conclusão obtida foi que nenhuma melhoria nas intenções dos clientes foi alcançada, aplicando a estratégia de resposta alternativa proposta. As três hipóteses formuladas – associadas aos três constructos propostos – foram rejeitadas, pois não foi provada a existência de uma diferença estatisticamente significativa (entre os dois grupos).
Ao explorar e propor uma estratégia de resposta alternativa concreta, este estudo não acrescenta apenas valor académico mas também prático.
Para concluir, limitações relevantes são discutidas e futuras pesquisas são propostas.
Palavras-Chave: eNWOM, recuperação do serviço, estratégia de resposta, atitude face
IV
ACKNOWLEDGEMENTS
Firstly, I would like to thank to my parents for having given me the incredible opportunity of studying in one of the most prestigious universities of Europe. Thank them for the extraordinary support throughout these last months. The development of this dissertation would not be possible without their constant and unconditional support.
Additionally, I would like to thank and express my deep gratitude to my supervisor, Professor Daniela Langaro, for all the guidance, advices and relevant feedback given during the entire process. I wish her all success in professional and personal life.
My special thanks are extended to my family and friends, who always supported and encouraged me to continue and give my best, even in the most difficult moments.
To Lucas, I would like to express my gratitude for being patient and listening to all my concerns. Thanks for the amazing ability of cheering me up in the most stressful and difficult moments.
Last but not least, I would like to thank and show my appreciation to all the participants of my questionnaire, who spent some of their personal time to help me.
V TABLE OF CONTENTS ABSTRACT ... II SUMÁRIO ... III ACKNOWLEDGEMENTS ... IV TABLE OF CONTENTS ... V TABLE OF TABLES... VII LIST OF ACRONYMS ... VIII
CHAPTER 1: INTRODUCTION ... 1
1.1 Problem Definition and Relevance ... 1
1.2 Research Objectives ... 2
1.3 Research Questions ... 2
1.4 Dissertation Structure ... 3
CHAPTER 2: LITERATURE REVIEW ... 4
2.1 The Industry of Telecommunications in Portugal ... 4
2.2 WOM: Word-of-Mouth ... 6
2.2.1 From WOM to eWOM ... 7
2.2.2 Valence of WOM ... 8
2.3 NWOM: Negative Word-of-Mouth ... 8
2.3.1 eNWOM: Electronic Negative Word-of-Mouth ... 9
2.3.2 eNWOM in the Telecommunications Industry ... 9
2.4 Complaint Management - Service Failure & Recovery ... 11
2.4.1 Response Strategy ... 11
2.5 Research Model: Proposed Hypotheses ... 13
CHAPTER 3: METHODOLOGY ... 15
3.1 Study 1 (Related to RQ1) ... 15
3.2 Study 2 (Related to RQ2) ... 16
3.3 Study 3 (Related to RQ3) ... 16
3.3.1 Data Collection ... 17
CHAPTER 4: RESULTS AND ANALYSIS ... 20
4.1 Study 1 (Related to RQ1) ... 20
4.2 Study 2 (Related to RQ2) ... 23
VI
4.3.1 Sample Description ... 25
4.3.2 Reliability and Validity ... 33
4.3.3 Normality Tests ... 36
4.3.4 Groups ... 38
4.3.5 Research Hypotheses ... 40
CHAPTER 5: CONCLUSION ... 43
5.1 Main Findings & Conclusions ... 43
5.2 Implications ... 44
5.3 Limitations and Future Research Orientations ... 45
CHAPTER 6: REFERENCES ... 48
APPENDICES ... 54
Appendix 1. Items of each construct... 54
Appendix 2: Online Questionnaire (English version) ... 54
Apppendix 3: Online Questionnaire (Portuguese version - original) ... 65
Appendix 4. Real example of the current response strategy given ... 75
Appendix 5: Posts’ characterization and % by sections ... 76
Appendix 6: Principal Component Analysis (PCA) ... 77
Appendix 7: Demographics – Mann-Whitney U Test ... 77
Appendix 8: Variables – Mann-Whitney U Test ... 78
VII
TABLE OF TABLES
Table 1: Posts - % by sections ... 21
Table 3: Demographics - Gender... 26
Table 4: Demographics - Age ... 27
Table 5: Demographics – Education Level ... 27
Table 6: Demographics – Current Occupation ... 28
Table 7: Main Telecommunications operator ... 28
Table 8: Client’s duration ... 29
Table 9: Client’s Satisfaction level ... 30
Table 10: Binding contract ... 30
Table 11: Switch operator... 31
Table 12: Facebook usage ... 31
Table 13: Follow Telecommunications operator Facebook page ... 32
Table 14: Comment ... 32
Table 15: Complaint ... 33
Table 16: Items for each construct ... 33
Table 17: Cronbach’s Alpha ... 34
Table 18: Principal Component Analysis (PCA) ... 36
Table 19: Normality Tests (K-S) ... 37
Table 20: Apology ... 39
Table 21: Remedy ... 40
Table 22: Hypothesis 1 ... 41
Table 23: Hypothesis 2 ... 42
VIII
LIST OF ACRONYMS
ANACOM – Autoridade Nacional de Comunicações BA – Brand Attitude
DJ – Distributive Justice
eNWOM – Electronic Negative Word-of-Mouth eWOM – Electronic Word-of-Mouth
IJ – Interactional Justice
NWOM – Negative Word-of-Mouth PCA – Principal Component Analysis PJ – Procedural Justice
RQ – Research Question WOM – Word-of-Mouth
CHAPTER 1: INTRODUCTION
1.1 Problem Definition and Relevance
The advent of Internet gave people the opportunity and possibility to share their experiences about products and services online. Studies on the effects of positive Word-Of-Mouth (WOM) are extensive. However, the amount of published research on the effects of Negative Word-Of-Mouth (NWOM) is rather limited. The goal of this dissertation is then to somehow fill that gap concerning the effects of NWOM on people who are exposed to this type of content; specifically Negative Electronic Word-Of-Mouth (eNWOM).
As it is going to be further explained, eWOM is represented by any (positive or negative) description made by costumers about their experience with organizations, products or services (Hennig-Thurau et al., 2004), made online through review websites, discussion forums, blogs and social media platforms.
The scope of this study is then referring to Negative eWOM, restrained to written negative reviews (i.e. complaints) published online, especially on companies’ social media pages. The aim is to suggest an alternative response strategy, mainly based on literature review, for companies to apply as a response to complaints and NWOM online, so that consequently consumers’ opinion and intentions improve.
By exploring alternative response strategies, the current research intends not only to add academic value but also managerial one, as it provides managers with possible and concrete improvements.
The current research will only focus the analysis on one specific industry: the Telecommunications. This choice took into account the importance of the industry itself as the products and services provided are crucial and critical for people’s life around the entire world. Having the focus in Portugal, the present study specifically concerns Portuguese people’s life. Along with the extreme importance of this industry, another factor taken into consideration for the choice of the Telecommunications industry, is the known reputation that it has for collecting a considerable amount of complaints concerning the products and services provided by the operators – proven later throughout the present dissertation. In fact, on social media platforms, such as
2
Facebook, the Telecommunications’ pages are also full with negative comments and complaints that lead to even more eNWOM. Hence, as previously mentioned, the choice of the industry was mainly due to that. Telecommunications are one of the leading industries when it comes to eNWOM, in Portugal.
1.2 Research Objectives
The objective is to understand how different response strategies can be applied by Telecommunications operators, in order to deal with NWOM and complaints posted online by costumers, and if they could impact other customers who are exposed to this type of content (meaning negative comments and complaints).
It is important to stress that this exposure to eNWOM - that is going to be tested throughout the current dissertation - is concerning the people who read negative comments, posts or complaints made by other users, in social media company’s pages – in this case, on Facebook. As people by reading posts also read the companies’ answers given to them, the main goal of the current study is then to evaluate what are the current companies’ response strategies in place and, from that, develop and propose a different response strategy, named alternative response strategy. Ultimately, it is to propose an alternative answer that could be able to improve the effects on those customers’ opinions and intentions.
1.3 Research Questions
The objectives presented above led to three Research Questions (RQs). The first Research Question intends to understand what is the current response strategy given by Telecommunications operators, in order to face negative posts/comments that costumers leave online. The second one seeks to reach a proposed answer, namely alternative response strategy, by identifying the gap between practice (what is currently in place) and the extensive literature already existing concerning service recovery. Finally, the third Research Question, which has into consideration the alternative response strategy proposed (on RQ2), aims to evaluate the impact of that strategy, by analyzing
3
consumers’ opinion and intentions. The hypotheses associated with this last RQ will be further presented and explained.
Thus, the three Research Questions (RQs) concerning this dissertation are the following:
RQ1: What is the current response strategy that Telecommunications operators apply to lead with NWOM that costumers leave online on their Facebook pages? RQ2: What could be an alternative response strategy proposal (so that Telecommunications operators could apply it)?
RQ3: What would be the impact on customers’ opinion and intentions if Telecommunications operators started to apply the alternative response strategy proposed?
1.4 Dissertation Structure
The current dissertation is divided into a total of six chapters. The introduction represents the first one. Chapter 2 then provides the literature review needed for a better understanding of the subjects and topics linked with the present research. It also contains an explanation of the proposed hypotheses associated with the presented Research Questions.
The third chapter introduces the methodology, thus including a description of the different measures and methods used for throughout this study. The research design is also explained in this chapter. Following, an analysis of the data collected and the main results are presented in chapter 4. Throughout this chapter, the results obtained are analysed and discussed in line with the proposed Research Questions (RQ) and therefore the hypotheses’ validity is tested.
Chapter 5 presents the main findings and conclusions. Managerial and academic implications are also presented within this part. The fifth chapter ends providing some relevant limitations of the present study as well as an outlook on some future research directions. Chapter 6 contains all the references used throughout the present research.
4
CHAPTER 2: LITERATURE REVIEW
The following literature review is based on the current knowledge about the subjects related to the present dissertation. For that, an extensive analysis of previous studies and researches was needed. The goal of this chapter is then to provide information for a better understanding of the topics associated with this research. In addition, the hypotheses associated with the third RQ are presented at the end of this chapter.
2.1 The Industry of Telecommunications in Portugal
Telecommunications represent a very developed industry in Portugal as operators try to excel for quality and continuous technological innovation.
Some facts, concerning the history of Telecommunications in Portugal are presented below, so that a simplistic and general timeline (of what has happened since the creation of the first Portuguese operator until the present day) can be understood.
Back in 1877 the first telephone experiments were done in Portugal1. In 1992, TMN won Portugal’s first public bid for mobile services through Global System for Mobile Communications (GMS). And in 1994 TMN was incorporated into Portugal Telecom. Although Portugal Telecom (PT) is only dated to be created in this year (1994), it emerged from a merger of TLP (Telefones de Lisboa e Porto), TDP (Portuguese TV broadcaster) and Telecom Portugal (ex-communications of CTT – the Portuguese post). Hence, as it resulted from the fusion of the existing communications’ companies in Portugal, PT is considered the oldest telecommunications’ operator in Portugal. Telecel won the bid for Portugal's second operator (after TMN) also through GMS and it started its telecommunications’ activity that year. Back then Telecel was the stronger - and during some years the only - competitor of TMN1.
In 1998, to face the two already existing operators (TMN and Telecel), a third telecommunications’ operator was created: Optimus2. Later, at the beginning of 2001,
Telecel somehow partnered with Vodafone and become Telecel Vodafone during some months. After this period its name changed definitely to Vodafone Portugal3.
1Uma empresa histórica [online].
2História da Optimus: Conheça a história da empresa [online].
5
In 2007 Portugal Telecom launched its triple play service: MEO. By then MEO belonged to the group of Portugal Telecom. In 2014 Portugal Telecom announced that the brand TMN no longer existed: the brand MEO, as it resulted from the merger of TMN with part of Portugal Telecom (“PT Comunicações”), was then TMN’s replacement. In addition, in 2008, Portugal Telecom lost one of its segments and ZON Multimédia appeared in the market as an independent brand. In 2013 Optimus and ZON merged, originating ZON Optimus4, and by 2014 it started to be called by NOS.
On May 2017, it was announced that both brands MEO and Portugal Telecom – that were previously bought - would disappear until the second trimester of 2018. So that only one name is spread around the countries where the company is present, the brand’s name was going to be Altice. By now, Portuguese people do recall Altice; however, by the time that data for the present dissertation was collected, the company still was in progress of introducing this new name into Portuguese’s minds.
Besides, these three major Telecommunications companies (Vodafone, NOS and MEO/Altice), there is one more operator in the Portuguese market. NOWO was launched on September of 2016, as a result of rebranding of the old Portuguese brand named Cabovisão. This newest brand intended to break the market status quo. It distinguishes itself from its competitors by trying to get closer with its customers, offering them more flexibility. Hence, in Portugal there are currently four Telecommunications’ operators: Altice (MEO), NOS, NOWO and Vodafone Portugal. The Portuguese Communications’ National Authority is called Autoridade Nacional de Comunicações (ANACOM) and one of its functions is to make public (through press conferences, media and also on in its website) various information concerning Portuguese Telecommunications industry. By analysing data provided online by this entity, related to the third trimester of 2017, we can gather the following insights. The subscribers’ shares, in 3Q17, are mainly distributed between MEO and NOS, scoring 39.9% and 38.5% respectively. Followed by Vodafone Portugal, with 16.7%, and also NOWO, with 4.8%. When it comes to the retailers’ revenue shares, in 3Q17, similar results are gathered. MEO lead with 41.4% along with 40.6% from NOS, following Vodafone scored 14.7% and NOWO 3.3% (ANACOM, 2017). It is then clear that the competition among the different Portuguese Telecom operators is real and fierce.
6
In this sense, in the present dissertation the analysis is going to be focused on the three leading Telecommunications companies: MEO (Altice), NOS and Vodafone Portugal. Furthermore, as far as mobile services are concerned, there are 13 million active subscriptions. While fixed traffic decreased by 11.3% compared to 3Q2016, mobile traffic increased by 4.1% over the same period. The rate in the 3T of 2016 was 100 mobile phones per 100 inhabitants. However, the more recent data (from the 3T of 2017) show that there was an increase since now there are about 114 mobile phones per 100 inhabitants (ANACOM, 2017).
Concerning mobile services, there are 7.0M mobile broadband users, meaning users of “banda larga móvel” (BLM) in Portuguese. Of which 91% use it through a mobile phone. 3GB (more 0.9 GB) is the average traffic per month for each broadband user. MEO leads in the share of BLM users, with 38.3%. However, NOS leads in the share of BLM users (PC/tablet), with 35.6%. In total, 993M represent the accumulated retail revenues from mobile services. Vodafone Portugal clearly leads in this type of service reaching 48.0% of these revenues (ANACOM, 2017).
In addition, we can confirm that the number of subscribers of Telecommunications packages has been increasing. From the 3T of 2016 to 2017 there were more 7.4% of services packages subscribers. ANACOM revealed that, at the end of the first trimester of 2017, 8.7 out of 10 Portuguese families owned a package of telecommunications’ services. The results from the third trimester of 2017 are even higher revealing that 9.1 out of 10 families had/owned a package of services. In total, there are 3.7 million package’s subscribers. MEO leads the share of subscribers with 39.9% (ANACOM, 2017).
Further, additional data concerning the Telecommunications industry is presented.
2.2 WOM: Word-of-Mouth
According to Dichter (1996), Word-of-Mouth (WOM) is the most powerful element in the marketing mix as it influences the decision making in the majority of the purchases. Actually, Sheth (1971) defended that WOM has even more importance than advertising in terms of raising awareness of a certain innovation and in ensuring the decision to try
7
a new product. Back then, WOM represented a face-to-face conversation about experiences between people who knew each other.
Due to its importance, various definitions were made throughout the years. Traditional WOM can then be defined as person-to-person communication in which the receiver perceives the communicator as non-commercial regarding a brand (Arndt, 1967). Alternatively, WOM can be defined as a process of sharing opinions and information between customers (Jalilvand, 2012).
2.2.1 From WOM to eWOM
Since internet has emerged, the world changed. People started to not only communicate by talking face to face, chatting over the phone and texting back and forth, but also through a whole range of online platforms. From blogs to websites to social media, such as Facebook, Twitter and Instagram, inevitably Electronic Word-of-Mouth (eWOM) arose.
The advent of social media made possible for people who did not know each other to start being able to share information between them. From that point on, everyone could easily share their stories, opinions and evaluations online.
For costumers, internet is a source and an outlet for Electronic Word-of-Mouth communication (Hennig-Thurau et al., 2004). eWOM is derived from WOM. The distinction between WOM is that eWOM statements are made online, being therefore available to a wide range of people (Hennig-Thurau et al., 2004). Consequently, eWOM can remain (online) for a very long period of time. eWOM is then characterized by its informality and, thus, free format (Do-Hyung and Kim, 2008), meaning that costumers can freely give their opinion by writing it and/or by evaluating it numerically. Its absence of face-to-face pressure, convenience and speed make it even easier to spread. Inherently communication was and still is facilitated by the internet (Saenger, Thomas & Johnson, 2013). As eWOM is a complex and broad concept, literature focusing on the effectiveness of eWOM communication (Chevalier and Mayzlin, 2004) and also concerning its impact on customer’s attitude is continuously emerging over the last years.
8
2.2.2 Valence of WOM
As WOM describes the process of giving any statement, information or opinion, it can be rated as positive, negative or neutral. If only descriptive information about the product or service is made, it represents neutral WOM, as any evaluative review is made. Whenever consumers express their opinions positively, WOM can be categorized as positive. Giving recommendations and relating pleasant experiences are two possible examples of Positive Mouth. By contrast, it is considered Negative Word-of-Mouth (NWOM) when unfavorable evaluations are done (Purnawirawan, De Pelsmacker and Dens, 2012), such as denigrating a product or service, complaining and relating unpleasant experiences. In other words, positive WOM expresses favorable experiences and/or evaluations, while negative WOM refers to disappointing experiences.
Previous studies proved to be an asymmetrical influence of WOM.
2.3 NWOM: Negative Word-of-Mouth
A few decades ago, only few studies from the published literature were concerning Negative Word-of-Mouth (NWOM). Due to that, back then no concrete definition of NWOM appeared to exist. According to Richins (1984), a definition of Negative World-of-Mouth could be reached by conjugating and slightly modifying both definitions of negative information and Word-of-Mouth advertising. This way, according to Richins (1984), NWOM was characterized as an interpersonal communication between customers about a marketing product and/or organization in which the object of the communication is denigrated.
In the more recent days, not only one definition for NWOM arose, but several possible ones. Negative Word-of-Mouth can be characterized by a customer’s effort to communicate negative or unfavorable feedback and/or sharing his opinions with friends, family and others (Balaji et al., 2016). Or, in a more managerial perspective, it can be described as the likelihood of costumers to spread unfavorable information about a company, including advising against the company and its products or services (Blodgett et al., 1997).
9
There is a predisposition that consumers have to pay more attention to negative information and feedback rather than positive (Cheung and Thadani, 2012)(Pan and Zhang, 2011). This predisposition has been analyzed in previous studies, as well as NWOM’s higher impact on customers’ purchase decisions. NWOM has a stronger effect on consumers’ brand evaluations and their Purchase Intentions (Park and Lee, 2009).
2.3.1 eNWOM: Electronic Negative Word-of-Mouth
As stated before, eWOM is WOM communication through the internet (Hu, Liu and Zhang, 2008). Hence, eNWOM is Electronic Negative Word-of-Mouth. Within the existing literature concerning Negative Word-of-Mouth, when it comes to eNWOM concretely it has received little attention. Given its characteristics (in parallel with eWOM), eNWOM could have stronger impacts on customers’ opinion than simply Negative Word-Of-Mouth, since eNWOM reaches a wider range of people within a very short period of time.
However, eNWOM also differs from NWOM in the sense that eNWOM intends to influence the potential customers (Tao and Jin, 2017) and not the marketer. eNWOM is seen by customers as more credible and trustworthy – than eWOM – when having the intention to make a purchase decision (Tao and Jin, 2017).
2.3.2 eNWOM in the Telecommunications Industry
Customers have the indisputable right to express themselves and, thus, to complain. In Portugal that right is clearly used. With the advent of the Internet, the exercise of this right has become even more common, as it become even more easy and quick to do it. As presented previously, ANACOM stands for “Autoridade Nacional de Comunicações” and it represents the Portuguese Communications’ National Authority. It is the second Portuguese entity with the most complaints - considering the total complaints made on both physical and electronic books (“Livro de Reclamações”) and also the entity with the major number of online complaints made.
There is also an online complaint portal (named “Portal da Queixa” in Portuguese) where people can and should express their negative experiences and explain the
10
situation/problem. This portal, besides obviously allowing customers to write down their complaints, shows the status (waiting for answer, being taking care of, solved or concluded) of your complaint. A portal visitor can see not only his post but also all the previous complaints made so far made by other consumers (and their status as well). Furthermore, it is possible to analyze and check out the overall statistics of companies, based on the data provided on “Portal da Queixa”.
All the three major Telecommunications companies – MEO (Altice), NOS and Vodafone Portugal - have created forums, called “MEO Fórum”, “Fórum NOS” and “Fórum Vodafone” respectively. These are reachable through their official websites but also through their social media platform Facebook. These forums were created in order to encourage people to ask questions and find tips with other people/clients. It is basically where customers can count on the help of other clients and share their knowledge and experiences. All the forums mentioned have approximately the same purpose and functionalities. This might be a way these telecommunications’ companies found to try to improve their images, into more innovative and cooperative ones. But also to somehow try to minimize the spread of the Negative WOM about the products and services they provide. Meaning that customers, by sharing their evaluations and opinions in those companies’ forums, they probably will not do it again on other channels (by making negative comments on companies’ posts on social media platforms, for instance).
Last but not least, customers can share their opinions and experiences on the companies’ official social media pages, as already mentioned. And they do it mainly on Facebook.
It is clear that there is a variety of platforms in which customers can express their negative experiences and even complaint. Also there is a high amount of negative evaluations and reviews made about the major companies that represent the Telecommunications industry. Hence, recovery strategies to overcome these eNWOM situations are needed.
11
2.4 Complaint Management - Service Failure & Recovery
Over the years, service providers are facing more and more intensive customer service pressures. Service failure, as the name itself states, represents all possible failures, mistakes and/or problems that can occur during product or service delivery. Service failure may refer to failures in a company’s system that consumers do perceive (e.g., incorrect account balances, flight delays, etc.)(Folkes, 1984). This kind of breakdowns can turn out to be extremely costly for companies, as customers may switch providers after dealing with a less favorable and/or negative experience, according to Folkes (1984). Therefore, service failure is an important issue as it can influence customer-switching behavior (Hoffman, Kelley and Rotalsky, 1995).
Service recovery involves all actions that service providers can take as a response to a service failure (Gronroos, 1988), in order to overcome it. The service provider’s reaction to a service failure is critical as it can potentially affect the customer bond: in a positive way by reinforcing it or in a negative way by changing a seemingly minor distraction into a major incident. Different types of service failure inevitably occur depending on the type of retailing channels: traditional or online. According to some online service recovery literature, in order to face those differences, there is the need to establish the adequate recovery strategy - especially for online service failure (Holloway and Beatty, 2003). The opportunity cost of losing an existing customer is much more expensive than the cost of service failure recovery. Service recovery then provides the opportunity not only for the organizations to keep their customers satisfied but also to increase customer retention and loyalty (Hart, Heskett and Sasser, 1990). Therefore, effective service recovery is considered an important strategic tool for organizations and online retailers (Fan, Wu and Wu, 2010).
Service failure and recovery are both critical issues for service managers and, consequently, for researchers. Therefore, both issues need to be carefully taking into account.
2.4.1 Response Strategy
Early studies and research established that post-complaint satisfaction fosters positive customer behavior, as it increases Positive WOM Communication (TARP, 1981) and Repurchase Intention (Gilly, 1987). Post-complaint satisfaction can be achieved through
12
the adequate recovery strategy. Hence, providing efficient answers, basing them on feasible and adequate response strategies, to NWOM is one possible form of complaint management.
An equity theory framework was used by Goodwin and Ross (1992) in their experiment, in order to study consumer responses to service failures. Particularly when recovery outcomes are favorable, their findings suggest that perceptions of satisfaction and fairness are enhanced if consumers are offered an Apology or are provided with the opportunity to express their concerns to a service representative.
Later studies and research concerning justice perceptions show their influence on the relationship between organizational responses and consumers’ post-complaint satisfaction. The justice theory is a theoretical framework commonly used for assessing the effectiveness of service recovery procedures. In this context, there are three dimensions of justice.
First, Distributive Justice (DJ) refers to consumers’ perceived fairness of the Remedy offered. It can actually refer the perceived fairness of the amount of Compensation offered (Folger, 1977). More Distributive Justice (DJ) is perceived by customers in the case of receiving additional compensation (Smith et al., 1999). Researchers have shown that Remedy levels would positively affect customer’s intentions (Harris et al., 2006) and satisfaction towards complaint handling (Tax et al., 1998). Furthermore, it was proven that this effect was stronger in offline environment than in online media. In fact, a successful remedy would enhance consumer retention (Maxham, 2001). A significant negative relationship between DJ and NWOM was found by Blodgett et al. (1997). The same research concluded that Distributive Justice (DJ) has a positive effect on subjects’ Repatronage Intentions and a negative effect on their NWOM Intention. Repatronage Intention indicates the possibility for customers to patronage the same online retailer again in the nearly future; meaning that customers would chose the same company (again). Hence, the higher perceived fairness of the Remedy - related with Distributive Justice -, the higher Repatronage Intention the customer would have.
Second, Procedural Justice (PJ) focuses on consumers’ assessment of the recovery processes as it refers to consumers’ perceived fairness of the policies and procedures used in the process. Procedural Justice (PJ) then refers to the perceived fairness of the means used to determine the amount of compensation offered (Folger, 1977). Response speed, which positively relates to PJ, is important for complaint handling as it can increase customers’ satisfaction with the service providers (Smith et al., 1999; Bitner et
13
al., 1990). In addition, Wirtz and Mattila (2004) found a positive relationship between response speed and Repurchase Intention. Blodgett et al. (1997) noted the speed of recovery is especially relevant for the retailing context. Also, a negative relationship between PJ and NWOM was found by Wirtz and Mattila (2004).
In service recovery literature, recovery satisfaction represents content evaluation of customers concerning recovery efforts made by the online retailers (Fan, Wu and Wu, 2010). Maxham and Netemeyer (2003) found a positive relationship between recovery satisfaction and PJ (Procedural Justice). As mentioned above, there is a negative relationship between DJ and NWOM and also between PJ and NWOM. Hence, both distributive and procedural justices have positive influence on Positive WOM (Maxham and Netemeyer, 2003).
Last but not least, Interactional Justice (IJ) focuses on the polite or rude manner in which the complainant was treated. According to Blodgett et al. (1997), this kind of justice is the main determinant of complainants’ Repatronage and NWOM Intentions, as its (positive) effect on subjects’ Repatronage Intention and its (negative) effect on their NWOM Intention are strong. It is then clear that the three presented justice perceptions mediate the relationship between post-complaint satisfaction and organizational responses.
This chapter concerning response strategy is extremely important since it can ultimately influence customers’ opinions and intentions. Previous studies confirm that whenever a company handles complaints well it tends to increase the likelihood of Repurchase Intention and also minimize the incidence of NWOM and third party complaints (Blodgett et al., 1993; 1997).
2.5 Research Model: Proposed Hypotheses
In order to reach answers for the third Research Question (RQ) concerning the effects on customers’ opinion and intentions (by applying the proposed alternative response strategy), hypotheses’ formulation is needed. In this case, those effects are translated on the opinion of consumers who read negative posts/comments online made by others customers on their Telecommunication operators’ Facebook pages. Those effects are going analyzed by comparing customers’ responses between two groups: the ones who
14
read the current response strategy and the ones who read the alternative one (proposed in the current dissertation); as it is going to be better explained further.
The third Research Question is following presented, so it can be reminded.
RQ3: What would be the impact on customers’ opinion and intentions if
Telecommunications operators started to apply the alternative response strategy proposed?
It is necessary to consider some constructs in order to better understand the effects on consumers’ opinion and intentions. All in all, by reviewing the extensive literature (research and studies) presented in the previous section, it is possible to confirm that it is important to analyze the effects on consumers’ opinion and intentions about Telecommunication operators according to their impact on three crucial variables: Brand Attitude (BA), Repatronage & Repurchase Intentions and NWOM Intention. These three variables turned out to be the constructs that will be used in the present research.
To sum, three hypotheses concerning the third Research Question of this dissertation arose:
H1: The alternative response strategy has a significantly different impact from the current one on consumers’ perceived Brand Attitude (BA).
H2: The alternative response strategy has a significantly different impact from the current one on consumers’ Repatronage and Repurchase Intentions.
H3: The alternative response strategy has a significantly different impact from the current one on consumers’ NWOM Intention.
The three abovementioned hypotheses are going to be further tested and validated, in chapter 4.
15
CHAPTER 3: METHODOLOGY
The purpose of this chapter is to present the different methods adopted in the current dissertation, by describing how data was collected, measured and analyzed.
The initial part of the present dissertation concerns exploratory and descriptive researches. It begins by presenting the literature review needed for a better understanding of the subjects linked with the present research. All the information, collected from top journals, academic papers and recognized books, represents secondary data. In order to achieve that, intensive and deep search of studies and researches about the topic was needed. The purpose of that chapter (literature review) is not only to provide information for a clearer understanding of the topics associated in this research, but also to build support, as in evidences, for the answers and conclusions of this research. The information gathered also contained the insights required for the selection of the three essential constructs needed to formulate the three Research Questions (RQs) proposed in the current study.
As different methodologies were used in order to reach the answer to the three RQs, they are following presented and explained by sections.
3.1 Study 1 (Related to RQ1)
As the first study is, inherently, associated with the first Research Question, it (the RQ) is presented bellow in order to clearly remember it.
RQ1: What is the current response strategy that Telecommunications operators apply to
lead with NWOM that costumers leave online on their Facebook pages?
In order to better understand what and how the current response strategy to eNWOM given by companies is, a great amount of data collection was needed. The Facebook pages of the three main Telecommunications companies – MEO, NOS and Vodafone Portugal – were analyzed, so that posts which contained an answer (given by the company) to negative posts that costumers left were gathered.
Some relevant information concerning the 100 posts gathered, essentially including response categorization by sections, was saved into a table. It can be consulted, fully complete, in Appendix 5. The data from this table allowed to reach some critical conclusions.
16
By analyzing a substantial amount of posts, it was possible to check if there was a certain pattern between the current response strategies applied (or not). Indeed, as a pattern is indeed observed, a “patterned” response strategy is going to be further formulated and presented.
3.2 Study 2 (Related to RQ2)
Following and accordingly, the study 2 concerns the second Research Question (RQ) formulated. In order to recall it, it is cited below.
RQ2: What could be an alternative response strategy proposal (so that
Telecommunications operators could apply it)?
Information and data analysis of the posts collected from the previous study (1) are crucial for the implementation of the second one. An extensive comparison between the “patterned” response strategy currently given – the answer to RQ1 – and what the literature review (previously presented) suggests that it is relevant was made. All so that how the current response strategy to NWOM given by companies could be improved could be understood. From that cross-reference, some minor flaws were spotted and, therefore, some possible improvements to the “patterned” response strategy were found. This way, an alternative version of a possible response strategy that Telecommunications operators could apply, in order to lead with negative posts (that costumers leave online on their Facebook pages) is going to be formulated and proposed. It is important to note that it is this same alternative response strategy that is going to be furtherer used within the formulation of the online questionnaire.
3.3 Study 3 (Related to RQ3)
Finally, the third study is linked with the third Research Question (RQ) of the present dissertation; the one which also has associated hypotheses. Also in order to remember it, it is stated below.
17
RQ3: What would be the impact on customers’ opinion and intentions if
Telecommunications operators started to apply the alternative response strategy proposed?
An online questionnaire was created as it was crucial to develop an experimental in-between groups design.
From the answers of that survey, quantitative data was generated. Hence, the information gathered from that online questionnaire later provided the primary data of this research. This way it is going to be possible to infer if the alternative response strategy proposed is able to improve costumers’ opinion and intentions about Telecommunications operators, after a service failure. It will be then possible to understand if the suggested alternative response strategy is able to lead to higher perceived Brand Attitude (BA), higher Repatronage and Repurchase Intentions and lower NWOM Intention or not; which correspond the three formulated hypotheses. These hypotheses are going to be further analyzed and tested, on chapter 4, using a quantitative approach.
The following section contains the detailed explanation of how the online questionnaire was created.
3.3.1 Data Collection
The questionnaire was developed through the online platform Qualtrics. The survey was distributed on the social media platform Facebook, in order to quickly target the highest number of respondents possible.
The online questionnaire was divided in five main sections.
Firstly, questions concerning respondents’ main Telecommunications operator of were asked: which is their principal operator, for how long are they clients of that operator, their satisfaction level and if they currently have a binding contract. After, it was asked participants if they had a Facebook account or not. It is important to note that only participants that do have Facebook accounts could continue to answer the online questionnaire from this point forward. Following, questions concerning their Facebook usage/habits and also their relation (if any) with the Facebook pages of their main telecommunications’ operators were asked. Respondents were asked if they followed their operators’ Facebook pages, if they had ever expressed their opinion (regardless if it
18
was good or bad) and also if they had ever made a complaint online (through comments on those Facebook pages).
After this general section, the survey unfolds in two blocks/groups. As mentioned before, this study consists in an experimental in-between groups design. Hence, at this point of the survey, each participant was randomly allocated to one of the Groups (A and B) and they only answered to the questions of that specific block. The fact that both groups were homogenous was guaranteed, when the option “evenly present elements” was selected on Qualtrics; at least in terms of number of respondents. The respondents answered to the same questions, concerning the exact same posts but taking into consideration two different situations; in this case, two different types of response strategies (current vs. alternative response strategy). Thus, within the same block/group, two different posts were included but the same response strategy was given to both: for group A the current response strategy was applied and for group B the alternative response strategy proposed was applied.
After this block division, some questions about the posts were obviously done. Firstly in terms of what the respondent considered about the post itself (as favorable, not favorable, etc.) and what would they do after seeing them (like it, comment it or share it). Later, some questions specifically concerning the response given to those posts were presented. Furthermore, questions concerning participants’ opinion and intentions after seeing those posts were asked – which is the main goal of this research. Hence, some crucial questions took into account the three constructs: Brand Attitude (BA), Repatronage and Repurchase Intentions and NWOM Intention. In order to achieve that, a formulation of phrases (items) based on those constructs was needed. A table that shows this process of linking a question/item for each construct can be further analyzed in Appendix 1.
Lastly, four questions concerning respondents’ demographics were made, in order to gather information about their gender, age, highest education level concluded and current occupation. It is important to stress that respondents aged less than 18 years old were not included in the target of this research and, thus, could not answer the online questionnaire.
The transcription of the entire online questionnaire can be further analyzed in Appendix 2 (English version) and/or in Appendix 3 (Portuguese version - original).
In terms of measures, different scales were used in the online questionnaire: from existing scales operationalized on seven-point Likert scales to semantic differential
19
scales. However, multiple questions/items anchored on a 7-point Likert scale (ranging from “1 - strongly disagree’ to “2 - strongly agree”) were used for all constructs.
The data retrieved from the online questionnaire, will be furthered analyzed on SPSS (version 23.0). This statistical software enables to do some crucial analysis, like running descriptive statistics in general and analyzing the constructs in terms of reliability (using Cronbach’s Alpha) and validity (using Principal Component Analysis – PCA). Analyzing and checking if the data follows a normal distribution (or not) will be also done, as it is critical to understand the type of tests needed to be used further. The validation that the two groups are comparable will be included. Finally, as the distribution in question was proven not to follow a normal distribution, the hypotheses’ testing will be made, using non-parametric tests (Independent-Samples Mann-Whitney U Tests).
20
CHAPTER 4: RESULTS AND ANALYSIS
The purpose of this chapter is to, by using the different methodologies previously mentioned and explained, answer to each one of the three Research Questions (RQ) formulated in the present dissertation. Consequently, those answers are following presented by sections.
4.1 Study 1 (Related to RQ1)
In order to reach an answer to the first Research Question (RQ) of this dissertation, we should start by remembering it:
RQ1: What is the current response strategy that Telecommunications operators apply to
lead with NWOM that costumers leave online on their Facebook pages?
Hence, the purpose is to understand what the current response strategy given by Telecommunications operators, in order to face negative posts that costumers leave online, is.
As mentioned on the previous chapter, the evaluation of the current online response strategy given by Telecommunications companies was made by analyzing the Facebook pages of the three main Telecommunications operators in Portugal: MEO, NOS and Vodafone Portugal. An extensive analysis of 100 posts and comments made on Facebook was needed in order to be possible to only focus the attention on the negative and/or prejudicial ones but still have a considerable and feasible number of posts to analyze. A real example of the current response strategy applied can be consulted in Appendix 4.
Firstly, it was possible to reach the conclusion that all the three major Telecommunications operators (MEO, NOS and Vodafone Portugal) use the same response strategy scheme. Their answers to negative posts and comments made by costumers have so much in common that can be considered identical and, therefore, were considered to follow the same layout.
Furthermore, it is important to note that the response given to negative posts is almost the same every time, no matter the situation. Meaning that, regardless the type of problem/failure issued by the customers in the posts, the answer given from the operator is the same.
21
Hence, it is a standardized answer that obeys to an already stipulated layout, in which the person (representing the Telecommunications operator) that sends the message almost only changes the name of the customer that made the post or comment and also his/her own name at the end of the message (as a ‘signature’).
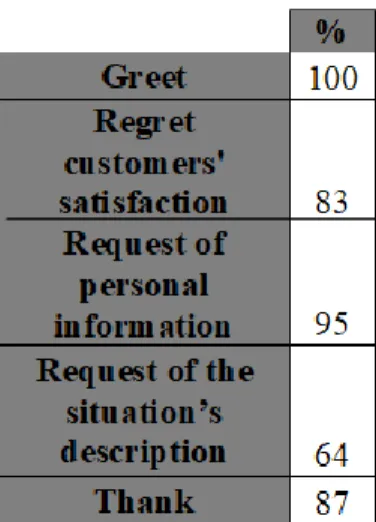
As stated before, some relevant information concerning the posts gathered, essentially, response categorization by sections, was saved into a table. It can be fully consulted in Appendix 5. Nevertheless, a resume of the total percentages of each section, correspondently to the main characteristics concerning the current response strategy given, can be consulted in the following table.
Table 1: Posts - % by sections
The data from this table allowed to reach some critical conclusions.
The current “patterned” response strategy used by Telecommunications operators to deal with negative posts and comments can be divided into 5 sections (since it does not follow the 8 characteristics from the table, presented and suggested previously) as follows:
1) Greet + name of the customer who did the post: 100%; 2) Regret customers’ dissatisfaction (Apology): 83%;
3) Request of personal information, such as client number and phone number, in order to ID the costumer, through private message: 95%;
4) Request of the situation’s clarification and/or description of the causes and/or consequences of the problem, if possible and necessary: 64%;
5) Thank + name of the person representing the Telecommunications operator (as a “signature”): 87%.
By analyzing the extensive research and studies presented in the previous section, it is possible to visualize that there are some key variables that clearly characterize and also
22
influence a response strategy. All in all, two variables mentioned before are going to be taken into consideration along the evaluation of the response strategy that the Telecommunications companies use, to lead with negative posts that costumers leave online on their Facebook pages: Apology and Remedy.
Starting by Apology, it is visible that, although the answers given almost always (83%) include regret for the customer’s dissatisfaction and that it can be perceived as an apology, it is not exactly the same as including an actual apology formulation.
Remedy is a difficult construct to assure in this kind of online situations, as it is almost impossible to instantaneously solve the situation. Managing to make customers to perceive high fairness of the remedy when (in some cases; 64%) it is requested a situation’s clarification and/or description of the causes and/or consequences of the problem (if possible) is hard. However, when it comes to Compensation degree (highly associated with remedy levels), any kind of compensation is currently offered. In fact, not even the possibility of receiving (or not) an additional compensation furtherer is mentioned.
Taking into account all the several posts and respective answers analyzed, the current response strategy used by Telecommunications operators in order to face eNWOM incorporates the following layout (translated version from Portuguese):
Hello + client’s name. We regret the inconvenience.
To proceed with the identification of your process, please indicate your customer number or your NIF or your mobile phone number, by private message. (In addition, try to describe the causes and / or consequences of the problem, if possible, also by private message.)
23
4.2 Study 2 (Related to RQ2)
In to remember the second proposed Research Question (RQ), it is presented below:
RQ2: What could be an alternative response strategy proposal (so that
Telecommunications operators could apply it)?
As stated before, the ultimate goal of this study is precisely to reach an alternative response strategy – by identifying the gap between what is currently in place (practice) and the extensive literature already existing from previous studies, concerning service recovery – that could improve customers’ opinion and intentions regarding their Telecommunications operators.
Hence, it involves even more analysis in the sense that between the current company’s response strategy and what the literature suggests, an attempt of an actual alternative response strategy is going to be proposed, based on what was spotted as missing and/or also on what could be improved.
Previous studies and researches concerning response strategies were analyzed in the literature review section and, from that, various information combined concluded that a response which includes an Apology (Goodwin and Ross, 1992) and that manages to make customers to perceive high fairness of the Remedy (Harris et al., 2006; Maxham, 2001) – also by including a compensation – can, direct and/or indirectly, influence customers’ intentions. Plus, according to Blodgett et al. (1997), the manner (polite or rude) in which the complaint is treated can improve Repatronage Intention and diminish NWOM Intention. In fact, bringing all those researches together, we could argue that the presence of these variables might positively improve customers’ opinion and intentions.
The responses given, as already proven, obey to an already stipulated layout and so that strategy should remain. The layout itself is the issue that needs to be improved. For that, the same two variables – Apology and Remedy, from response strategy literature (used in the analysis of the current response strategy given) needed to be used.
Taking then into consideration the analysis of the current response strategy made before in this dissertation, it was possible to detect some items that can be improved. When it comes to Apology, as the current answer does not include an actual apology (it only includes regret for the customer’s dissatisfaction), an apology formulation should be added to be proposed response. As mentioned before, Remedy is a variable difficult to assure in this kind of online situations. It is almost impossible to instantaneously solve
24
the situation when it is requested a situation’s clarification and/or description of the causes and/or consequences of the problem (whenever possible). This can be reached by making sure that customers know that the situation is going to be handled as soon as possible and as soon as the customers send all the information needed in order to proceed to the situation’s solution. In addition, as any kind of Compensation (highly associated with remedy levels) is offered in the current response strategy, it represents an important variable that can improve the answer and consequently customers’ opinion and intentions. Thus, the possibility of receiving an additional compensation (of any kind) furtherer, if possible, should be included and, hence, is going to be mentioned in the alternative response strategy. Finally, despite not being considered as a variable itself, the manner in which the complaint is handled should also be a factor taken into consideration. Thus, the alternative answer proposed should definitely be written in a polite way.
The alternative response strategy that could be applied by Telecommunications operators to deal with negative posts could then be divided (into 8 sections) as follows: 1) Greet + name of the customer who did the post;
2) Include an Apology;
3) Regret customers’ dissatisfaction (Apology);
4) Request of personal information, such as client number and phone number, in order to ID the costumer (through private message);
5) Request of the situation’s clarification and/or description of the causes and/or consequences of the problem, if possible and necessary;
6) Make sure the situation is going to be handled as soon as possible and solved (Remedy);
7) Offer a Compensation, only if possible (Remedy);
8) Thank + name of the person representing the Telecommunications operator (as a “signature”).
Taking into account the abovementioned suggestions of improvements, the alternative response strategy that could be used by Telecommunications operators in order to face negative posts by trying to improve customers’ opinion and intentions, should incorporate the following layout (translated version from Portuguese):
25
Furthermore, as Telecommunications companies already do, standardized answers (regardless the type of problem or situation) should continue to be given, at least in a initial phase.
The two different response strategies (answering two different posts) as well as the transcription of the entire online questionnaire can be further analyzed in Appendix 2 (English version) and/or in Appendix 3 (Portuguese version - original).
4.3 Study 3 (Related to RQ3)
The purpose of this section is to, by analyzing the data collected from the online questionnaire, understand the information obtained and analyze it. Consequently it would be possible to reach some answers to hypotheses associated with the third Research Question, presented previously. Thus, the hypotheses formulated are then going to be tested and consequently validated is this section.
4.3.1 Sample Description
The online survey was distributed through Facebook and remained activate during 10 days. The questionnaire gathered almost 300 answers. However, only a total of 207 answers (N=207) were determined as usable and valid, as responses not fully completed
Hello + client’s name.
We apologize and completely regret the inconvenience.
To proceed with the identification of your process, please indicate your customer number or your NIF or your mobile phone number, by private message. In addition, please try to describe the causes and / or consequences of the problem, if possible, also by private message.
Your situation will be solved as soon as possible, being target of our attention as soon as we receive your private message with your information.
Additionally, we will also try to find some way to make you up for the situation (if possible).
26
and also the ones with repeated IPs associated were eliminated. The sample size obtained was considered to be sufficient since, for structural equation modelling (SEM[43]), it is generally recommended a sample size of 200.
SPSS (version 23.0) was the statistical software used to analyze all the data gathered from the online survey.
From the data gathered from the online survey some insights could be reached. The following data concerning the sample description is going to be presented using valid percentages (as there is no missing data).
4.3.1.1 Demographics
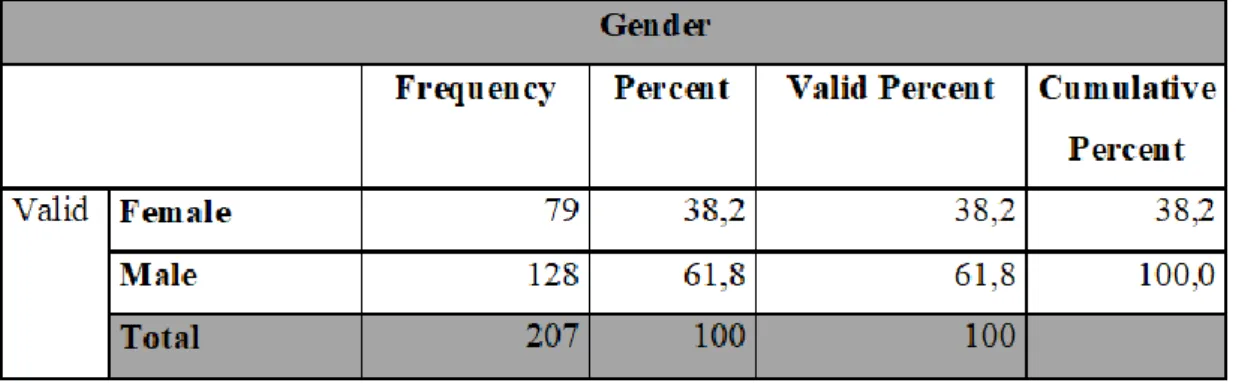
The online questionnaire reached 128 female respondents and 79 male, meaning that, from the total, the sample showed that 61.8% of the respondents were female and 38.2% were male, respectively. The following table shows the demographics for the Gender variable.
Table 2: Demographics - Gender
Regarding age, the majority of the respondents, with a percentage of 51.2%, were aged between 18 and 24 years old. Following, with a percentage of 31.4%, respondents were aged between 25 and 34 years old. 8.2% were aged between 35 and 44 years old; 4.8% between 45 and 54 years old; 3.4% between 55 and 64 and finally only 1.0% of the respondents were aged 65 years old or more. Respondents aged less than 18 years old were not reached since they did not represent the target of this research. The following table shows the demographics for the Age variable.
27
Table 3: Demographics - Age
In terms of highest education level, taking into consideration respondents’ last concluded degree, the two majorities concerned master and graduated respondents respectively, as in 44.0% represented respondents which the highest education level completed was a master degree and 36.7% represented respondents who completed a bachelor degree. Following, 17.4% had finished High School. Only 1.4% had finished Primary School and 0.5% of the respondents owned a Doctorate Degree. The following table shows the demographics for the Education Level variable.
Table 4: Demographics – Education Level
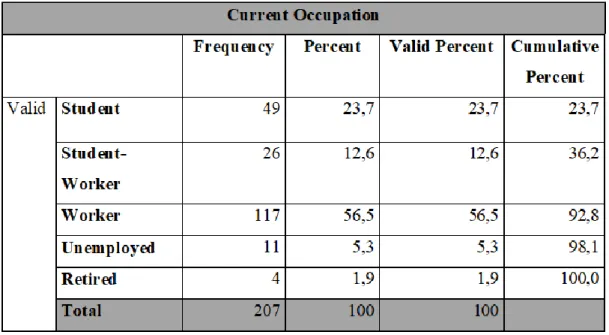
Finally, when analyzing the current occupation of the respondents, 56.5% were workers, 23.7% were students and 12.6% were currently both students and workers. Only 5.3%
28
were unemployed and 1.9% of the respondents were already retired. The following table shows the demographics for the Current Occupation variable.
Table 5: Demographics – Current Occupation
4.3.1.2 Telecommunications operators
Firstly, in terms of the main Telecommunications operators, the answers were somehow balanced and well distributed among the three main ones. Vodafone was the one with higher percentage among the respondents (with 39.6%), followed by NOS (with 32.9%) and MEO (with 26.1%). The following table shows the main Telecommunications operator of respondents.
29
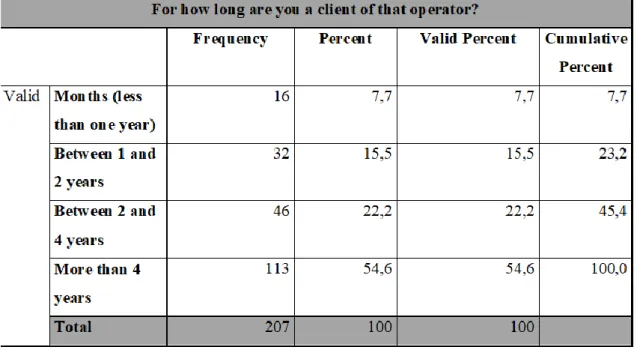
By contrast, when asking for how long the respondents were clients of that operator, the answers were not balanced at all. The majority the answers (54.6%) reported that respondents were clients of that operator for more than four years; while only 7.7% of the respondents were clients of their operator for less than one year. The following table shows for how long the respondents were clients of that operator.
Table 7: Client’s duration
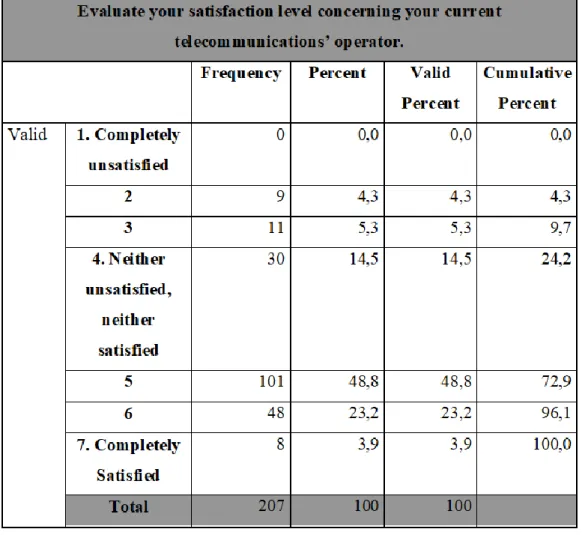
These results might be associated with the responses given in terms of their current satisfaction with their Telecommunications operator. In a 7-point scale (from “1 - completely dissatisfied to “7 - completely satisfied”), half (48.8%) of the participants claimed to be “satisfied” (5) with their current operator. Followed by 23.2% that are “very satisfied” (6) and 14.5% (4) who are neither unsatisfied neither satisfied. The following table shows the current satisfaction with their Telecommunications operator of respondents.
30
Table 8: Client’s Satisfaction level
In addition, 49.8% of the sample do know that they have a binding contract, 18.4% do not know and 31.9% of the respondents answered that do know that they do not have any contract. The following table shows if respondents have a binding contract.
Table 9: Binding contract
Concerning only the ones that do have a binding contract, when asked if they would change to another operator, if they did not have any associated cost, 15.0% answered
31
that they would change. However, 18.4% (which is more than the previous 15.0%) answered that they would not change and also 16.4% did not know. The following table shows if respondents (with binding contract) would change to another operator.
Table 10: Switch operator
4.3.1.3 Facebook usage
In terms of Facebook habits, the majority of the respondents (72.0%) answered that they open and ‘use’ Facebook more than one a day; while only 3.4% of the respondents claimed that they only open and ‘use’ their Facebook pages less than once per week. This data is good for this research, as the majority of sample is pretty well familiarized with Facebook and its functionalities. The following table shows Facebook habits of respondents.
32
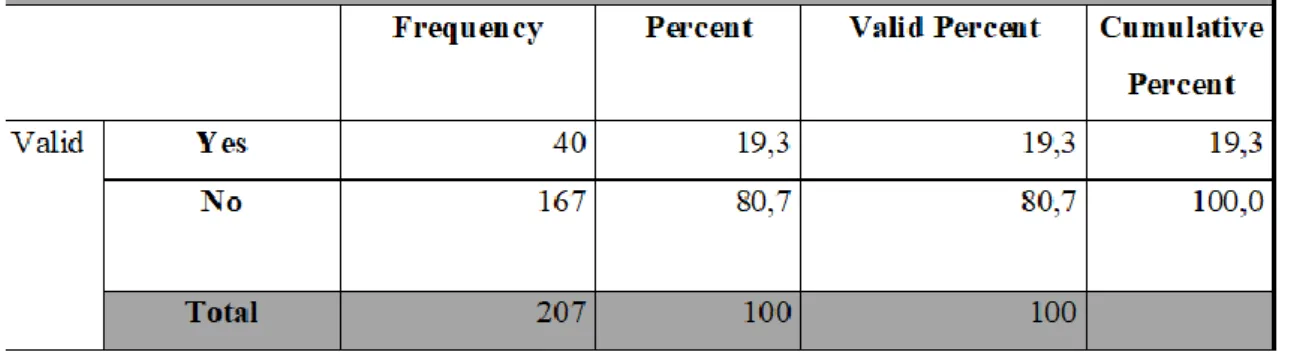
Despite surfing a lot on their Facebook pages, when it concerns specifically to the Telecommunications operators Facebook Portuguese official pages, the great majority (80.7%) of the participants claimed that did not followed their own operator on Facebook. The following table shows if respondents follow their Telecommunications operators Facebook Portuguese official pages.
Table 12: Follow Telecommunications operator Facebook page
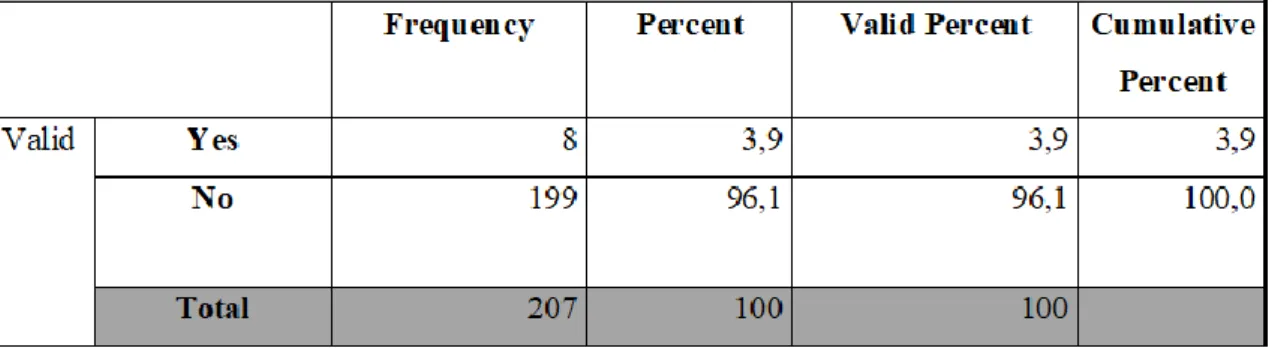
Furthermore, 95.2% of the respondents answered that they have never made any comment on their operators’ Facebook page in order to express their opinion. Similarly, 96.1% have never used their operators’ Facebook pages to make any kind of complaint. The following tables show if respondents have ever made any comment on their operators’ Facebook page in order to express their opinion or any kind of complaint.