UNIVERSIDADE DE LISBOA
Faculdade de Medicina
MUNIX
A new method of motor unit number estimation
José Filipe Oliveira Castro
Mestrado em Neurociências
A impressão desta dissertação foi aprovada pela Comissão
Coordenadora do Conselho Científico da Faculdade de Medicina de
Lisboa em reunião de 15 de Maio de 2012.
Faculdade de Medicina
MUNIX
A new method of motor unit number estimation
José Filipe Oliveira Castro
Orientador: Prof. Doutor Mamede de Carvalho, Faculdade de Medicina de Lisboa Co-Orientador: Prof. Doutor João Parracho da Costa, Faculdade de Medicina de Lisboa
Mestrado em Neurociências
2011Todas as afirmações contidas neste trabalho são da exclusiva responsabilidade do candidato, não cabendo à Faculdade de Medicina de Lisboa qualquer responsabilidade
Since 1971, when McComas described the first neurophysiological technique for the estimation of the number of motor units in a muscle (MUNE), several other methods have been developed over the following decades. Each technique has its own
advantages and disadvantages, but at the moment none of them has gathered enough consensus to arise as a predominant method.
In neurodegenerative diseases, such as Amyotrophic Lateral Sclerosis (ALS), the possibility of monitor the loss of motor units throughout the course of the disease would be of the outmost importance, in particular in the context of clinical trials. In present time, the neurophysiological methods that we have at our disposal are not the most adequate ones to follow the progression in this kind of diseases.
Motor unit number estimation techniques would be an excellent measure of the loss of motor units in these patients. However, all of the techniques described have limitations that prevented them to become a primary endpoint in clinical trials.
In this work, we describe a new technique for estimating the number of motor units in a muscle that it's called Motor Unit Number Index (MUNIX). We assess test-retest variability and evaluate the suitability of this technique as a potential marker of disease progression in ALS.
A group of 15 normal subjects was studied two times by two different raters to assess intra and inter rater variability. Overall reliability results were reasonably good (MUNIX megascore ICC=0.740).
A group of 11 ALS patients was studied over 9 to 12 months at regular intervals. We compared MUNIX to other known disease progression markers such as compound muscle action potential (CMAP), ALSFRS-R and muscle strength, and to another MUNE technique. MUNIX declined significantly with time (p < 0.001) and had higher progression rates than ALSFRS-R and muscle strength (p = 0.005).
We also compared MUNIX with multiple point stimulation MUNE in the abductor digiti minimi of ALS patients. MUNIX showed a significantly higher
Desde 1971, quando McComas descreveu o primeiro método neurofisiológico para estimar o número de unidades motoras num músculo (MUNE), vários outros métodos foram desenvolvidos. Cada técnica possui as suas vantagens e desvantagens mas, até agora, nenhuma reuniu aceitação generalizada de forma a se assumir como o método predominante.
Em doenças neurodegenerativas, como a Esclerose Lateral Amiotrófica (ELA), a possibilidade de avaliar a perda de unidades motoras durante o curso da doença é de extrema importância, particularmente em ensaios clínicos. Actualmente, os métodos neurofisiológicos de que dispomos não são os mais adequados para quantificar a progressão deste tipo de doenças.
As técnicas de estimativa de unidades motoras assumem-se como uma excelente medida de avaliação de perda de unidades motoras nestes doentes. No entanto, todas estas técnicas apresentam limitações que as impedem de serem consideradas como um
endpoint primário em ensaios clínicos.
Neste trabalho, descrevemos um novo método para estimar o número de unidades motoras num músculo, denominado Motor unit number index (MUNIX). Fomos avaliar a variabilidade intra- e inter-utilizador, bem como a sua adequação como um potencial marcador de progressão de doença na ELA.
Um grupo de 15 indivíduos saudáveis foi avaliado duas vezes por dois avaliadores independentes de forma a avaliar a reprodutibilidade do método.
Globalmente, a reprodutibilidade do método foi bastante satisfatória (ICC Megascore MUNIX=0.740).
Um grupo de 11 doentes com ELA, foi avaliado durante 9 a 12 meses em intervalos regulares. Comparámos o MUNIX com outras medidas de progressão da doença já descritas, tais como o potencial de acção muscular composto (CMAP), a escala ALFRS-R e o grau de força muscular, assim como com outro método de estimativa de unidades motoras. O MUNIX progrediu significativamente ao longo do tempo (p < 0.001) e teve uma maior taxa de progressão comparativamente à ALSFRS-R e ao grau de força muscular (p = 0.005).
taxa de progressão significativamente maior, com um declínio mais linear do que este outro método de MUNE, demonstrando que é uma técnica adequada para estimar o número de unidades motoras e avaliar a sua perda ao longo do curso de doenças neurodegenerativas.
Introduction 9-45 Objectives 46 Study population 47 Methods 48-52 Results 53-75 Discussion 76-81 Conclusions and Study limitations 82 References 83-95 Attachments
1. INTRODUCTION
1.1 Motor unit
History and anatomical studies
The first time the concept of “motor unit” was mentioned in the literature was in 1925, by Sir Charles Sherrington (Liddell and Sherrington, 1925). He defined motor unit as the “axon-motoneuron and its adjunct muscle fibers” and drew attention for its all-or-none responsiveness. Four years later, Sherrington (1929) redefined motor unit as “the axon and the group of muscle fibers it activates. Each such "motor unit" has
centrally, of course, a nerve-cell of which a group or "pool" represents the muscle in the spinal cord”. In fact, over 80 years have passed since the dawn of this groundbreaking concept, and we still define motor unit as the aggregate of an axon and the muscle fibers it innervates.
Eccles and Sherrington (1930), with their optical recording system, were the first to investigate the number of motor units in muscles of the cat hindlimb. The dorsal nerve root ganglia were excised and, after the time needed for the sensory fibers to degenerate has passed, the surviving myelinated fibers were added up and assumed to be motor. They obtained values around 640 for the semitendinosus, 430 for the medial gastrocnemius and 250 for the soleus. Albeit this pioneer study, and even taken in consideration the recognition of the distribution of myelinated nerve fibers in two groups, the authors failed to distinguish between the thinner (γ) axons that supply the small muscle fibers in the muscle spindles, and the thicker (α) axons that innervate skeletal muscle fibers. Only a few years later (Leksell, 1945) this problem was acknowledged.
The first anatomical studies of human motor units were by Feinstein (Feinstein et al., 1955). Although it was a tedious task to count stained cross-sections of large myelinated fibers from cadavers‟ nerves, the greatest difficulty was to decide the proportion of α-motor and sensory axons. After comparing the counts made with a cross-section of a patient who died after having a severe case of poliomyelitis, the authors proposed the ratio of 60:40 (α-motor/sensory axons)
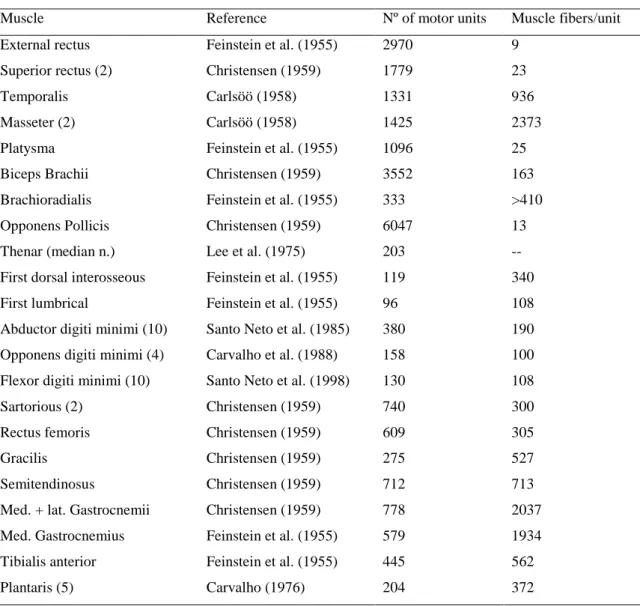
This ratio was used in the vast majority of anatomical studies that were reported in the following decades. In table 1 (Sica and McComas, 2003) we can see an overall of anatomic studies in various human muscles
Table 1: Anatomical estimation of numbers and sizes of motor units in various human muscles
(Sica and McComas, 2003)
Muscle Reference Nº of motor units Muscle fibers/unit External rectus Feinstein et al. (1955) 2970 9
Superior rectus (2) Christensen (1959) 1779 23
Temporalis Carlsöö (1958) 1331 936
Masseter (2) Carlsöö (1958) 1425 2373
Platysma Feinstein et al. (1955) 1096 25 Biceps Brachii Christensen (1959) 3552 163 Brachioradialis Feinstein et al. (1955) 333 >410 Opponens Pollicis Christensen (1959) 6047 13 Thenar (median n.) Lee et al. (1975) 203 -- First dorsal interosseous Feinstein et al. (1955) 119 340 First lumbrical Feinstein et al. (1955) 96 108 Abductor digiti minimi (10) Santo Neto et al. (1985) 380 190 Opponens digiti minimi (4) Carvalho et al. (1988) 158 100 Flexor digiti minimi (10) Santo Neto et al. (1998) 130 108 Sartorious (2) Christensen (1959) 740 300 Rectus femoris Christensen (1959) 609 305
Gracilis Christensen (1959) 275 527
Semitendinosus Christensen (1959) 712 713 Med. + lat. Gastrocnemii Christensen (1959) 778 2037 Med. Gastrocnemius Feinstein et al. (1955) 579 1934 Tibialis anterior Feinstein et al. (1955) 445 562
Plantaris (5) Carvalho (1976) 204 372
Note: Unless otherwise indicated, values derived from single muscle
Although the results of these studies are more or less similar, they are different enough to prevent the designation of a true standard value for the number of motor units in human muscles. On top of that, is now clear from other anatomical studies (Boyd and Davey, 1968), that the ratio of motor to sensory axons varies greatly between muscles. Therefore, the 60:40 ratio proposed by Feinstein is, at the best, uncertain.
Nevertheless, these histological studies can serve as baseline comparison for the physiological motor unit number estimation (MUNE) techniques that have been
developed.
Physiology of the motor units
Skeletal muscle fibers are innervated by large myelinated nerve fibers derived from alpha motor neurons (α-MNs) of the spinal cord and brainstem. The cell bodies of the α-MNs are localized in the anterior gray horns in the spinal cord or in the motor nuclei in the brainstem. The axon of each motor neuron exits the spinal cord through a ventral root (or through a cranial nerve from the brainstem) and traverses progressively smaller branches of peripheral nerves until it enters the muscle it controls. As each myelinated fiber enters a skeletal muscle, it branches many times, each branch terminating on a muscle fiber at a site named neuromuscular junction.
Each motor unit innervates exclusively muscle fibers of the same type. The number of branches depends on the size of the motor unit and can go from 100 up to 1000 muscle fibers scattered over the muscle, depending mostly on the function of this muscle. In muscles with more refined motions, less muscle fibers each unit innervates, and vice-versa.
Near the motor end-plate, the nerve branch ends as a naked axon (presynaptic membrane), with no myelin surrounding it, since the Schwann cells serve only as a cap, never projecting into the synaptic cleft. At this point, the axon is slightly expanded, and has many mitochondria and acetylcholine (ACh) vesicles.
At this site, the surface of the muscle fiber is slightly elevated due to the accumulation of granular sarcoplasm and the presence of numerous mitochondria and nuclei.
Figure 1
A - Photomicrograph of a motor end plate showing terminal branching of a nerve fiber. B - Electron micrograph of a terminal axon at a motor end-plate
When an action potential travels through the nerve and arrives at the presynaptic membrane, Ca2+ enter the axon, via Ca2+ voltage dependent channels, and begins a cascade that leads to the release of ACh to the synaptic cleft.
The ACh then binds to postsynaptic-nicotinic-type ACh-gated channels and Na+ ions flow into the muscle cell giving origin to an action potential that spreads along the sarcolemma into the contractile myofibrils. This leads to the release of Ca2+ ions from the sarcoplasmic reticulum, which, in turn, causes the muscle to contract.
Figure 2:
A - A skeletal neuromuscular junction
B - Enlarged view of a muscle fiber showing the terminal naked axon
Since a single action potential in an α-motor neuron can activate dozens, or even hundreds, of muscle fibers synchronously, the resulting currents sum to generate an electrical signal that is easily recorded outside the muscle itself. The superficial recording of this large electrical field, generated by the activation of the muscle fibers, is the basis of Electromyography (EMG), Nerve conductions studies (NCS) and MUNE techniques.
1.2 Amyotrophic Lateral Sclerosis
Despite the fact that MUNE techniques could be useful in many
neurodegenerative diseases like Amyotrophic Lateral Sclerosis (ALS), Spinal muscular atrophy (SMA), Poliomyelitis or even different types of Peripheral neuropathies, the focus of this work will be on ALS.
Definition
ALS, also known as Motor neuron disease (MND) or Lou Gehrig's disease, is a fatal neurodegenerative disorder of the motor system, characterized by progressive muscular paralysis reflecting degeneration of motor neurons is the primary motor cortex, brainstem and spinal cord (Wijesekera and Leigh, 2009). The term
"Amyotrophy" represents the loss of muscle fibers due to denervation caused by
degeneration of the anterior horn cells. "Lateral sclerosis" represents the replacement of the corticospinal tract by gliosis as the result of cortical motoneurons degeneration (Rowland and Shneider, 2001).
Diagnostic and classification criteria
The diagnosis of ALS can be challenging. Not only there are a number of potentially mimicking diseases (e.g. Cervical radiculomyelopathy), but also there is no specific biomarker. Therefore, the diagnosis is based on a collection of some very characteristic clinical findings in combination with examinations to document signs of lower and/or upper motor neuron signs and to rule out other conditions.
The first set of clinical criteria for the diagnosis of ALS was developed in 1994 by the World Federation of Neurology (Brooks, 1994), the "El Escorial" diagnostic criteria. These criteria were revised a few years later (Brooks et al., 2000), the "Airlie House" criteria. According to this last set of criteria, patients can be classified as summarized in table 2 (Brooks et al., 2000).
Table 2: Summary of Revised El Escorial Research Diagnostic Criteria for ALS (Wijesekera and Leigh, 2009)
The diagnosis of ALS requires:
1 Evidence of LMN degeneration by clinical, electrophysiological or neuropathological examination; 2 Evidence of UMN degeneration by clinical examination, and
3 Progressive spread of symptoms or signs within a region or to other regions, as determined by history or examination,
Together with the absence of:
[1] Electrophysiological and pathological evidence of other disease that might explain the signs of LMN and/or UMN degeneration, and
[2] Neuroimaging evidence of other disease processes that might explain the observed clinical and electrophysiological signs
Categories of clinical diagnostic certainty on clinical criteria alone Definite ALS
• UMN signs and LMN signs in 3 regions Probable ALS
• UMN signs and LMN signs in 2 regions with at least some UMN signs rostral to LMN signs Probable ALS – Laboratory supported
• UMN signs in 1 or more regions and LMN signs defined by EMG in at least 2 regions Possible ALS
• UMN signs and LMN signs in 1 region (together), or • UMN signs in 2 or more regions
• UMN and LMN signs in 2 regions with no UMN signs rostral to LMN signs
UMN (Upper Motor Neuron) signs: clonus, Babinski sign, absent abdominal skin reflexes, hypertonia, loss of dexterity.
LMN (Lower Motor Neuron) signs: atrophy, weakness. If only fasciculation: search with EMG for active denervation. Regions reflect neuronal pools: bulbar, cervical, thoracic and lumbosacral.
In 2008, a consensus meeting was held by a group of experts and a new set of rules to define the electrophysiological diagnosis of ALS was recommended, the Awaji criteria (de Carvalho, 2008). These criteria simplified the previous ones and highlighted the importance of the fasciculation potentials in the diagnosis of ALS. Table 3
Table. 3 – Comparison between the revised El Escorial criteria and the Awaji set of recommendations
1. Principles of the Revised El Escorial Criteria
The diagnosis of ALS requires
A: evidence of lower motor neuron (LMN) loss (reduced interferential pattern on full contraction and increased firing rate)
B: evidence of reinnervation (motor units of large amplitude and longer duration) C: fibrillation and sharp-waves
2. Principles of the Awaji-shima Consensus Recommendations
The diagnosis of ALS requires
A: evidence of lower motor neuron (LMN) loss (reduced interferential pattern on full contraction and increased firing rate)
B: evidence of reinnervation (motor units of large amplitude and longer duration)
C: fibrillation and sharp-waves OR fasciculation potentials (fibrillation and sharp-waves are required in weak limb muscles).
3. Number of muscles affected by region
Cervical and Lumbar-sacral region
A minimum of two muscles innervated by different roots and nerves Bulbar and Thoracic region
A minimum of one muscle
Clinical features
The first author to clearly recognize ALS as a clinico-pathological entity was the renowned French neurologist Jean Martin Charcot in 1869 (Charcot, 1869).
Roughly, two thirds of typical ALS patients present with a spinal form of the disease. The initials symptoms are typically focal muscular weakness of insidious onset, either proximally or distally in upper and/or lower limbs. Muscle wasting may precede focal weakness, and sometimes fasciculations or cramps may appear months before any weakness. These symptoms are usually asymmetrical (monomelic) at start, but
eventually progress to the other limbs, and most patients go on developing bulbar and respiratory symptoms.
Bulbar onset patients usually notice difficulty speaking clearly or swallowing, which eventually evolves to severe dysarthria or dysphagia. Limb symptoms eventually occur within some months of the first complaints.
A smaller proportion of patients (≈ 3%) present with respiratory weakness without significant limb or bulbar symptoms.
Clinically, all of these patients present some of the following symptoms or signs:
Focal muscle atrophy
Fasciculations
Spasticity
Pathologically brisk tendon reflexes
Hoffmann's sign
Babinski's sign
Dysarthria
Dysphagia
Fasciculations and wasting of the tongue
Respiratory failure and other pulmonary complications are usually the cause of death in ALS patients.
Epidemiology
The majority of ALS cases are sporadic. Only about 5-10% of cases have any kind of familiar history of ALS (Anderson, 2003).
The incidence of sporadic ALS is, in average, 1.9-2.1 per 100000/year in Europe and North America without significant differences between the different countries (Worms, 2001; Logroscino et al, 2010). A constant finding in studies is the higher number of men affected, with a M/F ratio of around 1.5:1 (Abhinav et al., 2007; Logroscino et al., 2008; Worms, 2001).
The mean age of onset for sporadic ALS varies between 55-65 years with a median age of onset of 64 years (Haverkamp et al., 1995; Leigh, 2007). Only around 5% of cases have an onset before 30 years of age (Haverkamp et al., 1995), although
juvenile sporadic ALS cases are being progressively more recognized (Gouveia e de Carvalho, 2007). Bulbar onset is commoner in women and in older age groups of patients (Haverkamp et al. 1995).
Although the incidence of ALS is thought to be regionally uniform, there are some clusters in some regions in the Western Pacific where the prevalence may be 50-100 times higher than elsewhere. The Guam island, the West Papua and the Kii
peninsula in Japan are the three largest areas of increased incidence. These patients have ALS associated with Parkinsonism and Dementia (Armon 2003). Despite the decrease in incidence of ALS in these areas over the past 40 years, the cause of these clusters are still unveiled (Steele and McGeer, 2008; McGeer and Steele, 2011).
Etiology
The actual cause of ALS is still unidentified, despite some genetic risk factors have been acknowledged. At present time, most authors believe that a complex interaction between genetic and environmental aspects is the causal factor for motor neuron degeneration (Shaw, 2005)
Pathogenesis
The precise molecular pathway leading to degeneration of motor neurons in ALS is still unknown. But, taking as example other neurodegenerative disorders, most likely this will be an intricate interaction among multiple pathogenic cellular mechanisms.
Since the purpose of this work is not to review exhaustively ALS, we will only list some cellular mechanisms that have been shown to be deregulated in tissues of ALS patients:
Protein aggregation and endoplasmic reticulum stress Excitotoxicity
Oxidative stress
Proteasome Inhibition and Autophagy Mitochondrial dysfunction and Apoptosis
Neuroinflammation
Impaired axonal transport
Deficits in neurotrophic factors and dysfunction of signalling pathways Transcriptional dysfunction
Genetic factors
Histopathological features
Regarding pathologic features, the hallmarks in ALS include the degeneration and loss of motor neurons with astrocytic gliosis and the presence of intraneuronal inclusions in degenerating neurons and glia.
In the upper motor neurons, there is a depopulation of the Betz cells in the motor cortex, variable astrocytic gliosis, and axonal loss within the descending pyramidal motor pathway connected with myelin pallor and corticospinal tract gliosis.
In lower motor neuron pathology, there is degeneration of the ventral horns and brainstem motor neurons leading to the death of these cells. The remaining neurons are atrophic and may contain intraneuronal inclusions such as Ubiquitinated (TDP-43) inclusions (Neumann et al., 2006), Bunina bodies (Okamoto et al., 2008), and Hyaline conglomerates (Wood et al., 2003).
Diagnosis and monitoring of disease progression
There are a variety of investigations that can help in the diagnosis of ALS either by documenting neurogenic or active denervation signs, or by excluding other
conditions that can mimic ALS. Electrophysiological studies
Electrophysiological studies are the most important investigation to rule out other mimicking conditions and to confirm the diagnosis of ALS. Neurogenic changes and/or signs of active denervation such as fibrillation potentials, positive sharp waves and fasciculations potentials have a fundamental role in the current criteria for ALS diagnosis (de Carvalho et al. 2008).
Nerve conduction studies
NCS allow the exclusion of peripheral nerve pathologies such as Multifocal motor neuropathy, that can mimic ALS presentation. These studies are generally normal or near normal, except for the amplitude of the compound muscle action potential that can be diminished (Brooks et al., 2000).
Conventional electromyography
Needle EMG is the most selective tool for demonstrate signs of lower motor neuron dysfunction. It can identify widespread loss of motor units even before it is clinically detectable.
Active denervation signs such as fibrillation potentials and positive sharp waves, and chronic denervation signs such as large motor unit potentials with increased
duration, reduced interference pattern with higher firing rates and unstable motor unit potentials, are only demonstrable through needle EMG.
Fasciculation potentials are a significant feature of ALS. Not only they have an upgraded value in the diagnosis (de Carvalho et al., 2008), but they can offer some understanding of the pathophysiology of ALS.
Transcranial magnetic stimulation (TMS)
TMS offers a non-invasive and reliable method of assessing upper motor neuron function. Changes in cortical motor threshold and cortical silent period can be
documented with this technique and have shown to be correlated with disease progression (de Carvalho and Swash, 2010).
Quantitative electromyography
MUNE techniques are special neurophysiological methods that estimate the number of functional motor units on a giving muscle (Bromberg, 1993; Daube, 2006).
The neurophysiological index is a mathematical derivation of three standardised neurophysiological measurements, representing aspects of the effects of denervation and reinnervation and of the excitability of anterior horn cells (Swash and de Carvalho, 2004, Cheah et al., 2011).
These methods, while not perfect, are sensitive to quantify disease progression and have both been applied in clinical trials (de Carvalho and Swash, 2005; de Carvalho et al. 2005).
Neuroimaging studies
The main role of neuroimaging in ALS is to exclude structural lesions that may mimic ALS symptoms.
Magnetic resonance imaging (MRI) may identify changes in the corticospinal tracts of ALS patients (Luis et al., 1990), but the role of this or other more advanced neuroimaging modalities in very limited in clinical practice. Nevertheless, there are recent studies regarding the use of neuroimaging in identifying potential biomarkers of disease progression (Turner et al., 2009) and in detection of changes before disease onset (Ng et al., 2008).
Clinical scales
There are many clinical rating instruments to evaluate ALS patients that can assess disease status, follow progression and serve as endpoints in clinical trials.
At the time, the commonly used and available instruments for the assessment of disease status and progression in ALS include the Norris scale (Norris et al., 1984), the Appel scale (Apple et al., 1987) and ALSFRS (ALS CNTF Treatment Study Phase I–II Group, 1996).
The ALSFRS is a functional scale, proposed in 1996, designed to assess patients' abilities to carry out activities of daily living (ADL) grouped in four categories: bulbar, upper extremity, lower extremity function and gross body function. Although this scale was demonstrated to be robust and reliable (Cedarbaum and Stambler, 1997) it granted disproportionate weighting to limb and bulbar, as compared to respiratory dysfunction (Cedarbaum et al. 1999). Therefore, the ALSFRS-R, which incorporates additional assessments of dyspnea, orthopnea, and the need for ventilatory support, was proposed three years later (Cedarbaum et al. 1999).
This scale is a sensitive and reliable score that has been largely used in clinical trials (Cedarbaum and Stambler, 1997) and has been proved to be predictive of survival (Kaufmann et al., 2005).
Management
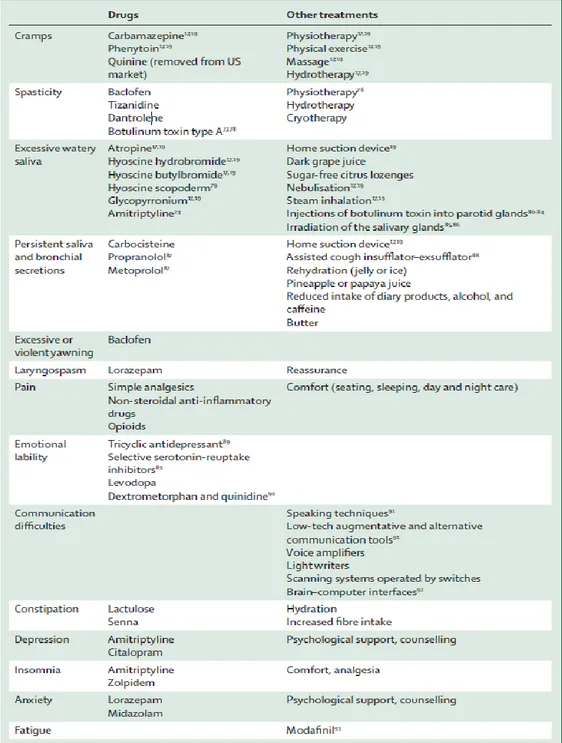
ALS is considered an incurable disease, so treatment is mostly symptomatic. The majority of symptoms that arise during its natural course are treatable, and patients should be managed by a multidisciplinary team focusing on improving quality of life and patient's autonomy. Table 4 resumes the most common symptomatic treatments in ALS (Radunovic et al., 2007).
Nutritional management is of major significance in ALS. Since dysphagia is a common symptom, leading to increased risk of malnutrition, dehydration and weight loss, special care should be given to nutritional status. Eventually, enteral feeding most be considered, with percutaneous endoscopic gastrotosmy (PEG) being the standard of care (Leigh et al., 2003). PEG has been suggested to maintain a good nutritional status and prolong survival in ALS patients (Mazzini et al., 1995).
Weakness of respiratory muscles develops as the disease progresses and is a significant indicator of survival. It ultimately leads to respiratory complications, being the main cause of death in ALS (Gil et al., 2008). Erect forced vital capacity and vital capacity along with percutaneous nocturnal oximetry are the most commonly used tests to assess respiratory function. The latter can be useful to determine the need for non-invasive positive-pressure ventilation (NIPPV) (Pinto et al., 2003). NIPPV has been shown to improve survival and quality of life (Pinto et al., 1995; Bourke et al., 2006) and is the preferred therapy to alleviate symptoms of respiratory insufficiency.
A vast number of clinical trials with various therapeutic targets have been reported in the literature. There are, currently, more than 150 trials registered with ALS as a target condition (http://clinicaltrials.gov). Despite this large number of studies, only riluzole has proven a modest effect on survivability (Bensimon et al., 1994; Lacomblez et al., 1996; Miller et al., 2007). One of the possible reasons for the lower success rate in ALS clinical trials may be the may be with the outcome measures chosen for these studies. Up until now, survival time and functional outcome have been chosen as the primary endpoints. Although these measures are of indisputable importance, they may be insensitive for screening new drugs (Costa et al., 2010). Consequently the need for sensitive biomarkers, like neurophysiological measurements or molecular biomarkers, is growing day by day.
1.3 Motor unit number estimation
Ascertaining the number of axons innervating a specific muscle is of primordial importance in clinical neurophysiology. MUNE allows for a quantitative measure of the function of motor axons and it may be sensitive to mild degrees of axonal loss. Further than that, MUNE techniques are not influenced by the compensatory reinnervation process following denervation due to lower motor neuron degeneration, as opposed to motor amplitude.
MUNE can provide significant information about the structure, organization and function of the brainstem and spinal cord motor system. Moreover, MUNE offers the chance to study the effects of age and muscle denervating diseases on motoneuron populations. It also can be used to establish the natural history of these disorders and to assess therapeutic efficacy of clinical interventions.
Although theoretically MUNE allows various exciting possibilities, the lack of a standard anatomical determination of the number of motor units in a muscle has
hampered the use and development of MUNE techniques. As previously mentioned in this work, anatomical studies of motor units are also, at best, estimates of the true number of motor units.
The advent of physiological MUNE techniques happened in 1971 when McComas described his incremental stimulation method (McComas et al., 1971a). Despite being proposed over 40 years ago, the MUNE field was hindered during nearly 20 years because of the initial application of the incremental stimulation technique in muscle diseases such as myotonic, Duchene or limbgirdle dystrophies (McComas et al., 1971b; McComas et al., 1971c; Sica and McComas, 1971). Because much was yet to be learned regarding motor unit properties, the low values of MUNE recorded in these patients muscles were attributed to some type of dysfunction in their motoneurons. This hypothesis for the pathogenesis of muscle diseases was proven wrong, and the MUNE field lost the attention it deserved.
In the next two decades, other techniques were described (Brown and Milner-Brown, 1976; Lee et al., 1975; Brown et al., 1988; Stashuk et al., 1994; Daube, 1988, 1995) but the crucial step was given in 1993 when Bromberg (Bromberg, 1993) studied the reliability of MUNE and considered its application for evaluating ALS patients.
These techniques will be explained in the next pages along with their advantages and limitations.
Before we look at each individual method, we have to understand several basic assumptions about electrical characteristics that are made by MUNE techniques.
All of these methods measure the average size (amplitude and/or area) of single motor unit potentials (SMUP), as well as the size (amplitude and/or area) of compound muscle action potential (CMAP) obtained by supra-maximal stimulation of a motor nerve. The MUNE is calculated by dividing the size of the maximal CMAP by the average size of the SMUP. These methods assume that each motor unit has a similar size and that it is the same size each time it is activated. It is preferable to use negative peak area or amplitude instead of peak-to-peak amplitude due to the effects of temporal dispersion in phase cancellation. If peak-to-peak amplitude is used, it may lead to an inflation of the average value and, consequently, to an underestimation of MUNE.
What distinguishes these 5 techniques is the method used to obtain the SMUPs used to calculate the average SMUP.
The first assumption is that the electrical activity recorded is derived from a single muscle. If a single motor unit potential is actually generated by a muscle at a distance from the recording electrodes its amplitude will be misleadingly small, leading to an overestimate of the motor unit number. For that reason, SMUPs with waveforms mostly positive in polarity, or with area<25 µV/ms or amplitude<10 µV are considered to arise from distant muscles and discarded (Bromberg, 2007).
The second assumption is that the SMUP responses are, in fact, derived from a single motor unit. It is reasonable that two or more axons have similar thresholds causing a single response. This of course, can lead to erroneous MUNE values. As the number of stimulus increases though, this joint response will tend to decrease, giving different SMUP morphologies with each stimulus. This alternation phenomenon
increases as the current stimulus increases due to higher probability of stimulating more and more axons. This is one of the reasons why is difficult to directly identify more than 10 motor units in a muscle when stimulating a single point along the nerve.
The third assumption is that a sample of 10 or 20 SMUP that are used to determine the average size of the SMUP are representative of the entire population of
SMUPs. Taking into account the classical studies regarding electrical stimulation of peripheral nerves (Erlanger and Gasser, 1937), we know that the largest fibers with higher conduction velocities have the lowest threshold. This can present a bias on the selection of the motor units used to calculate the average SMUP size. However, the clinical data reported in various studies using various techniques (McComas et al., 1971; Doherty and Brown, 1993; Doherty et al., 1994) suggested that percutaneous electrical stimulation of motor axons provided an unbiased sample of SMUP.
Incremental stimulation
Incremental stimulation MUNE was the first physiological technique to be described (McComas et al., 1971). Despite its limitations, it was a major breakthrough in neurophysiology.
It was applied to the extensor digitorum brevis (EDB), with a surface strip electrode placed so as to completely cover the end-plate zone of the muscle, and a reference electrode placed over the sole, considered to be an "inactive" spot.
Consecutive, manually adjusted electrical stimuli (duration - 50 µsec; repetition rate - 0.25 Hz) were applied to the deep peroneal nerve at a site just above the ankle through a bipolar surface electrode (cathode distal to the anode).
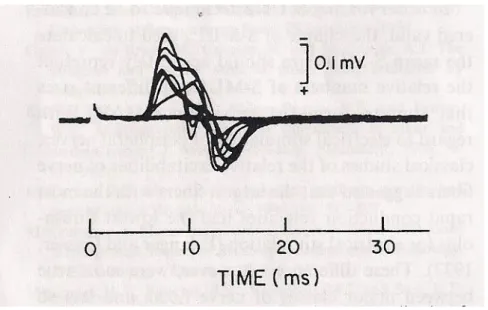
With progressive increases in stimulus intensity, incremental increases of the CMAP size were perceived. Each consecutive increment of the CMAP was considered to represent the addition of a SMUP as its threshold was reached. About 10 quantal increments were obtained in order to get a somewhat representative sample of SMUPs.
Figure 3: Incremental stimulation MUNE (McComas et al., 1971a)
The average amplitude of SMUP was then calculated and maximal amplitude of the CMAP divided by it in order to estimate the number of motor units.
This is a rather simple and elegant method that can be most effective when there is a reduction in the number of motor units in the studied muscle. In this case, the individual steps with stimulus current changes can be quite easily identified. On the contrary, in a young and healthy subject with a large number of motor units, the
thresholds of motor axons quite often overlap, making quantal increments very difficult to identify.
When the thresholds of two or more axons overlap at a given stimulus intensity a set of stimuli can evoke 2n-1 increments to the CMAP, where n is the number of axons with that threshold overlap. These steps (alternations) represent the possible
arrangements of SMUPs, which in turn represent the variation, from stimulus to stimulus, of the motor units responding. This can lead to an underestimation of the SMUP size and, consequently, to an overestimation of the number of motor units.
Another pitfall is the operator bias in the choice of the increments that actually represent an addition of a SMUP to the CMAP.
Figure 4: Alternation phenomena in a series of 100 constant intensity stimuli
Multiple point stimulation
In order to surpass the problem of alternation, stimulation of multiple points along the peripheral nerve path was suggested, originating the multiple point
stimulation technique (Brown and Milner-Brown, 1976; Kadrie et al., 1976). These two first papers gave somewhat different results in obtaining a more representative SMUP sample and this method was not considered suitably for MUNE. However, these studies shed some light into the recruitment pattern of motor units.
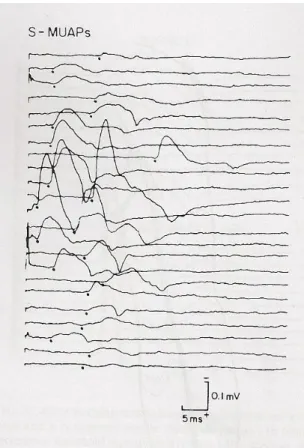
The modification introduced by Brown and Milner-Brown, was to stimulate the motor nerve in various (10 to 20) sites along the length of the nerve and record only the first all-or-nothing motor unit potential. The stimulus is given at 1 Hz with 50 to 100 µs duration with the cathode distal. Starting from a site just proximal to the motor point, the first single reproducible, all-or-nothing, free of alternation SMUP is found. After the first SMUP is found, the cathode is moved a short distance distally and the process is repeated until at least 10 SMUPs are recorded.
Figure 5: SMUPs obtained by multiple point stimulation MUNE
This simple change in methodology avoided completely the problem of
alternation and seemed to be a great advance in the MUNE field. Despite thse promising features, multiple point stimulation was left aside until 1993 when Doherty and Brown used this method to study the number and size of motor units in adults (Doherty and Brown, 1993). This technique was used by Felice in ALS patients and controls, in an elegant study that proved the utility of MUNE in the assessment of ALS (Felice, 1995).
An adaptation of this technique was described by Wang (Wang and Delwaide, 1995), which consists in recording only two or three clearly identifiable SMUPs in each point of stimulation in order to avoid alternation, and at the same time allowing for the increase of the SMUP sample. However, with this alternative method, there may be an increased probability of recruiting the same motor unit in different stimulation sites.
Advantages
The advantages of multiple point stimulation technique are: the average SMUP size is based on real motor units and not a statistical estimate or an estimate derived by algorithms intended to correct for alternation; there is no alternation; near motor thresholds stimuli are well tolerated by the subjects.
Disadvantages
The possibility of recording the same SMUP when stimulating at different sites along the nerve, is one of the most striking issues in multiple point stimulation MUNE. A formal method to detect duplicate SMUP is the collision technique, as described by Aoyagi (Aoyagi et al., 2000). However, collision studies are not viable in a clinical setting, so the primary means of identifying duplicate SMUPs is the comparison of waveforms signatures. Another drawback of this method is that in only applicable to distal muscles as it is required at least 50-100 mm of the motor nerve to allow collection of at least 10 SMUPs.
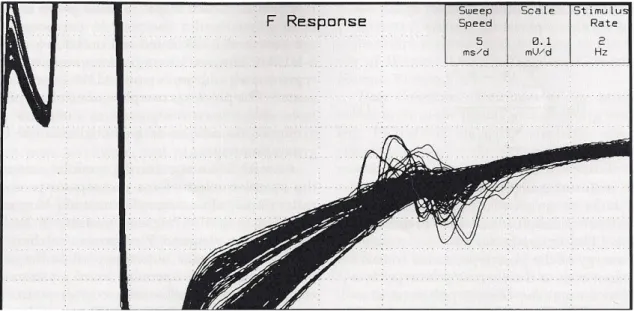
F-Response method
Following some studies on F-responses elicited by submaximal stimuli (Komori et al., 1991; Doherty et al., 1994) and the interpretation of these responses as a single motor unit potential, Stashuk and colleagues (Stashuk et al., 1994) proposed a method
of estimating the number of motor units based on the automated analysis of the F-responses.
This technique applies series of 200-300 successive submaximal stimuli (10-50% of maximal CMAP) to a motor nerve at a rate of 2 Hz, recording 100 ms of surface EMG signal on a muscle innervated by that nerve. An F-response is considered to be representative of a discharge of a single motor unit, when 2 or more responses with identical shape, size and latency are recorded within the set of 200-300 stimuli.
The recorded traces are then analyzed either automatically or manually in order to identify the SMUPs. The manual method can take up to 3h for scanning the entire set of responses, thus making it impractical in the clinical setting. An algorithm was then developed (Stashuk et al., 1994) in order to automatically select the F-responses considered being SMUPs.
When a representative sample of SMUPs is collected (at least 10), the average size is calculated, and used to estimate the number of motor units by dividing the size of the CMAP by the size of the average SMUP.
Figure 6: Superimposition of 300 CMAPs and related F-Waves, used for the calculation of F-Wave MUNE
Advantages
This technique is carried out with a minimum of operator intervention, reducing a possible operator bias in choosing SMUPs. The low intensity of the stimulus applied is well tolerated by the subject.
Disadvantages
The F-responses may be derived by the activation of more than one motor unit, leading to an overestimation of the average size of the SMUP. Alternation phenomena cannot be fully excluded despite the robustness of the algorithm. This method requires special software that may not be available in every EMG machine. Finally, in some pathological condition, such as ALS, the physiology of the F-responses may be altered (e.g. hiperexcitability of the anterior horn cells, reduced number of responses) leading to an increased difficulty in recording the SMUP sample.
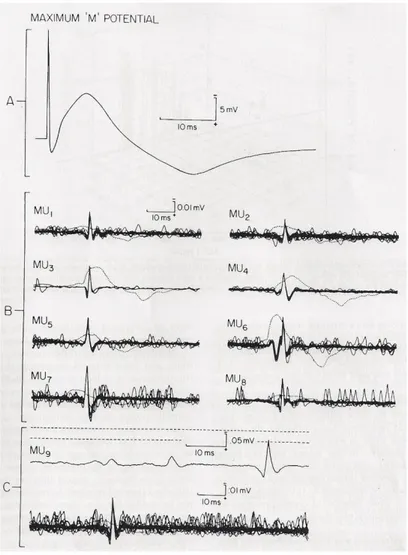
Spike-Triggered Averaging
One of the first major studies with spike-triggered averaging technique was by Brown and colleagues who applied this method to the biceps brachii muscle in healthy subjects (Brown et al., 1988).
This method involves recording electrical activity from two channels. Using voluntary isometric contraction, motor units are recorded in one of the channels with a combination of an amplitude window discriminator and a needle electrode, isolating one motor unit from the rest of the electrical activity. The motor unit spike is then used as a trigger to record the surface SMUP time-locked with the chosen motor unit, extracting this signal from the asynchronous surface detected EMG activity. The surface
recordings where then averaged (200 to 500 traces) until no further changes in the shape of the SMUP occurred. Filter settings were 500Hz-5KHz for the intramuscular
10 SMUPs where recorded and used to calculate the average SMUP size. The maximal CMAP, obtained by supramaximal stimulation of the musculocutaneous nerve at or just distally to the posterior axillary fold, was divided by the average SMUP, giving the estimate of the number of motor units.
Advantages
This method does not suffer from alternation problems and it can be applied to most muscles, including proximal ones that are not accessible by other techniques. The use of intramuscular needle recordings may provide information regarding motor unit firing patterns, fiber density, jitter, blocking or other pathopysiological phenomena of reinnervation or instability of neuromuscular transmission.
Figure 7: Spike-Triggered Averaging MUNE in Biceps brachii muscle
Disadvantages
This method can be very lengthy for collecting a representative sample of SMUPs. It is somewhat uncomfortable for the subject as intramuscular needles are not painless. It requires the collaboration of the subject, by maintaining a steady
contraction. The measurements of the negative area of the SMUPs can be tough because of the difficulties in establishing the onset and baseline of the SMUPs. It involves special software. Finally, there may be a bias in the selection of the SMUPs towards low threshold motor units because of the physiological order of motor unit activation, giving lower values of SMUP size.
Decomposition-Enhanced Spike-Triggered Averaging
In order to overcome some of the problems with the Spike-triggered averaging method, an algorithm was developed for combining EMG signal decomposition with Spike-triggered averaging (Stashuk and Brown, 1994).
The goal of this improvement is to analyze segments of 20 to 60 s of EMG signal during moderate isometric contraction and extract the motor units signal recorded from intramuscular needles. In this manner, the operator is not required to manually select each intramuscular motor unit potential as a trigger for the surface SMUP, decreasing the time needed for each assessment, and providing a larger sample of SMUPs, and at higher levels of contraction.
The original algorithm used for this method was designed for use with concentric needle electrodes and during isometric constant or slowly changing force contractions. The EMG signal was first filtered by a first-order differential filter (McGill et al., 1985) in order to attenuate most of the distant volume conducted EMG signal. This enhances the detection of motor unit action potentials (MUAP). The
following step is the application of a multipass clustering algorithm to the set of MUAP recorded in a 5 s interval corresponding with the maximal level of motor unit
recruitment. This allows for the estimation of the number of MUAP trains in the composite signal and the computation of the prototypical MUAP shape for each train. The Spike-triggering averaging technique is then applied, in order to collect SMUP from the surface electrodes.
Advantages
This method can greatly enhance the Spike-triggering averaging technique by increasing the number of SMUPs obtained from each intramuscular detection, reducing the time required for the collection of the entire set needed for MUNE calculation. It reduces the level of subject cooperation that is needed for the test. It allows for the study of higher threshold motor units, reducing the bias of the Spike-triggering averaging technique towards the selection of low threshold motor units.
Disadvantages
Regardless of how capable the decomposition algorithm may be, the complex interference pattern recorded by the surface electrode often makes it quite difficult to clearly identify SMUPs. This prevents the use of negative peak area, obliging the use of peak-to-peak or negative amplitude that may lead to an erroneous estimation of the number of motor units. Intramuscular needles are still used, causing some discomfort to the subjects. Finally, special software is required for these analyses, which may not be available in every EMG machine.
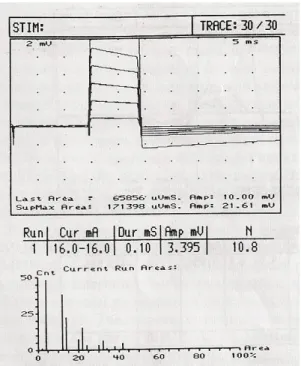
Statistical method
The first time the statistical MUNE technique was reported in the literature was in 1988 (Daube, 1988), but it was only in 1995 that Jasper Daube described formally is method (Daube, 1995).
The statistical method relies on the know relation between the variance of multiple measures of step functions and the size of the individual steps when these steps have a Poisson distribution. In a pure Poisson distribution the measures decrease at higher values and the variance of these measurements is equal to the size of the individual components making up each measurement.
In a set of 30 constant submaximal stimuli there will be variability in the CMAP response related to the inherent differences of thresholds of individual axons. Given that the differences on the CMAP follow a Poisson distribution, the variance of this
Firstly, a scan of 30 stimuli with increasing equal increments is done in order to identify unusually large steps in the CMAP.
Figure 8: Series of motor responses to increasing stimuli, following a Poisson distribution
(Daube et al., 1995)
Figure 9: Normal (left) and abnormal (right) CMAP scanning curves
If all steps on the scan are small, as it is in normal subjects, stimulus intensity eliciting response windows 10-20%, 25-35%, 40-50% and 55-65 % of maximal
response are chosen, and 4 to 10 trials of 30 stimuli with that intensity are applied. The results of the different trials are then averaged, thus obtaining the estimation of number of motor units.
On the other hand, in subjects with denervation and reinnervation such as ALS, if the CMAP scan detects true gaps (>10 % of total range), these gaps are attributed to a single SMUP, and a series of operational guidelines is needed in order to account for these large motor units (see Bromberg, 2007).
There is still a large debate regarding technical details around this method. Not only the window size (5 or 10 %) and the placement of the windows along the scan curve are a matter of discussion, but there is no agreement in using Poisson or binomial distribution on the statistical method (Blok et al., 2005; Bromberg, 2007).
Advantages
It is a relative fast technique (around 15 minutes per muscle), without significant discomfort for the patient as it only uses submaximal electrical stimulation. It is
applicable to almost every muscle where a CMAP is obtainable. Alternation is not a problem in this method. Also, as it uses a wide range of stimulus intensities, motor axons with different thresholds are recruited, thus providing with a representative sample of the SMUPs.
Disadvantages
There are a wide number of operator variables on this method. Up until today, there is a lack of a broad consensus on these variables and its implications on MUNE calculations. Special software is required for this technique, which is not available in every EMG machine.
High density MUNE
Van Dijk and collaborators proposed a new method of MUNE mixing elements from the Incremental stimulation and Multiple point stimulation techniques, with 120
resolve the problem of alternation to a large extent, allowing a collection of a larger SMUP sample, hence increasing the MUNE accuracy.
The HD-EMG allows the decomposition of recorded submaximal CMAPs into the contributions of single motor units by adding spatial information to the obtained waveforms, thus distinguish individual SMUPs.
Despite the advantage of increasing the SMUP sample, this method has several drawbacks. When the number of SMUPs contributing to a given submaximal CMAP is high (more then 4), the accuracy and reliability of the SMUPs detection decreases significantly. It requires special electrodes and software that may not be easily available. Finally, each assessment can take more than 60 minutes, making it not viable in a
clinical setting.
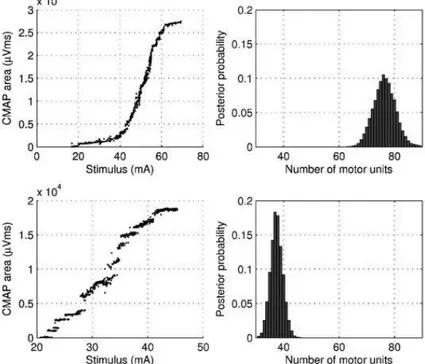
Bayesian statistical method
One of the most intricate, yet promising, techniques recently proposed is the Bayesian approach to the statistical MUNE (Ridall et al., 2006; Henderson et al., 2007).
This method uses data from the entire stimulus–response curve of a particular nerve collected by gradually increasing the stimulus intensity over at least 500 stimuli.
A Bayesian model is then applied to this data, as described by Ridall (Ridall et al., 2006) in order to obtain a probability that a certain number of motor units in that muscle is true.
The use of Bayesian statistics allow for the incorporation of a number of variables into the equation, avoiding the assumptions made by the Statistical method - the single MUAPs have the same size and that the units firing probabilistically, for a given stimulus, have the Poisson distribution. Instead, the Bayesian method incorporates probabilistic motor unit firing and motor unit size variability into the model.
This method also has some assumptions:
Motor units fire independently of each other in an all or nothing response and the response to each stimulus is independent of the response to previous stimuli. Motor unit firing only occurs if the stimulus intensity exceeds a variable threshold. The
threshold for each unit is distributed as a Gaussian variable with its own mean threshold and precision parameter. The mean threshold is defined as the stimulus at which a unit has a 50% probability of firing. The precision parameter defines the range over which the unit exhibits probabilistic firing. The probability of a unit firing as a function of the stimulus can therefore be represented by a sigmoidal curve known as an “excitability curve” (Brown and Milner-Brown, 1976).
Each motor unit upon firing emits an action potential in the muscle characterized by an area or amplitude which is independent of the stimulus and normally distributed about a mean particular to that unit with a variance common to all units. (These means can then be allocated a suitable distribution to describe their between-unit variability.)
The measured CMAP area is the superposition of the muscle action potentials (described by Assumption2) of those units that respond to a stimulus (as described in
Figure 10. Stimulus–response curves (left) and the calculated motor unit number and distribution of motor units (right) in a normal subject (top) and an ALS subject (bottom). In the posterior distribution the most likely number in the normal subject was 79 (71–89) and in the ALS subject 29 (25–34).
Assumption 1) together with a component from the baseline noise, which itself is normally distributed with its own mean and variance.
Although this assumptions are well debated in the original paper (Ridall et al., 2006), more studies are needed in order to verify if these are undisputable. Correlation of data obtained by this method with MUNE values calculated with other methods is also desired.
1.4 MUNIX
MUNIX stands for "Motor unit number index" and it is a new method for estimating the number of motor units in a muscle. It was described in 2004 (Nandedkar et al., 2004), and it is being tested in a multicenter study, in which our laboratory is included, not only in control subjects (Neuwirth et al., 2011a; Neuwirth et al., 2011b), but also in ALS patients (Unpublished data). This method uses a mathematical model based on the CMAP and the surface EMG interference pattern (SIP) to derive an index related to the number of motor units, and not the actual number. However, in a previous study (Neuwirth et al., 2010) MUNIX values from the abductor pollicis brevis (APB) were correlated with previously published data using other MUNE techniques.
This method is a three-step process. Firstly, the CMAP of the desired muscle is recorded by stimulating supramaximally the appropriate motor nerve with standard nerve conduction techniques. As MUNIX calculations relies on the CMAP amplitude and area, it is important to ensure that the maximum CMAP amplitude is recorded. Non optimal electrode placement can give low CMAP values and underestimate MUNIX. The negative phase of the CMAP is used to compute amplitude, area and power (the area and power are calculated by summating the absolute and square of the sample values, respectively, and multiplying it by the sampling interval for the measurement).
The second step consists on the recording of the SIP, with each epoch containing 300 ms of surface EMG signal.
The patient is instructed to maintain an isometric contraction at 9 rising levels of force, starting on minimum and ending on full contraction. The force per se is not measured, as it would be impracticable, but the operator offers manual resistance to the patients movement, thus helping the recruitment of different levels of force. Each level of force will roughly correspond to 10% increments, from 10 to 100%, giving the patient a short rest before the maximal contraction. Either the CMAP and the SIP are recorded using a filter setting of 3-3000 Hz.
The SIP epochs are analyzed in order to identify artifacts such as high frequency noise, power line frequency interference, baseline shift. Also tremor may occur, causing a nearly synchronous firing of motor units with high amplitude bursts. These situations
can lead to erroneous MUNIX calculations and recordings containing these artifacts should be rejected.
There are some criteria for a SIP epoch to be accepted:
SIP area > 20 mV/ms
Ideal Case of Motor Unit Count < 100
SIP area / CMAP area > 1
For the final step, all of the signals are imported to an independent analysis software for the MUNIX calculation. The mathematical model used for MUNIX computation is described next.
MUNIX Mathematical model
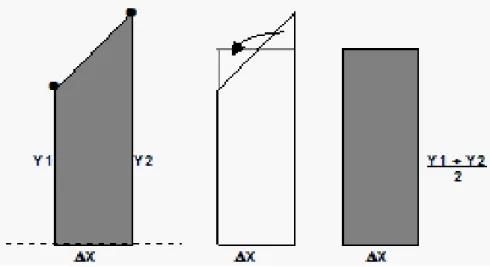
Let us assume an ideal case in a given muscle where all motor units are identical, with the same SMUP waveform, amplitude, area and power, where N= number of motor units; Mp= power of a single SMUP; and Mr= area of a single SMUP. Since the CMAP is the sum of all SMUPs, assuming there is no temporal dispersion, the CMAP waveform will be a magnified image of the SMUP.
Giving these postulations, the CMAP area will be given by: 𝐶𝑀𝐴𝑃 𝑎𝑟𝑒𝑎 𝐶𝑟 = 𝑁 𝑥 𝑀𝑟
and the CMAP power will be (note that the power is proportional to the square): 𝐶𝑀𝐴𝑃 𝑝𝑜𝑤𝑒𝑟 𝐶𝑝 = 𝑁 𝑥 𝑁 𝑥 𝑀𝑝
Considering a slight voluntary contraction, when the subject activates few motor units, and assuming that the SMUPs do not superimpose, the SIP measurements will be given by:
𝑆𝐼𝑃 𝑎𝑟𝑒𝑎 𝑆𝑎 = 𝐷 𝑥 𝑀𝑟 𝑆𝐼𝑃 𝑝𝑜𝑤𝑒𝑟 𝑆𝑝 = 𝐷 𝑥 𝑀𝑝 where D represents the number of SMUP discharges.
With some algebraic manipulation of the aforementioned relationships, one can easily verify that:
𝑁 = 𝐶𝑀𝐴𝑃 𝑃𝑜𝑤𝑒𝑟 𝑥 𝑆𝐼𝑃 𝐴𝑟𝑒𝑎
𝐶𝑀𝐴𝑃 𝐴𝑟𝑒𝑎 𝑥 𝑆𝐼𝑃 𝑃𝑜𝑤𝑒𝑟
This formula is called an Ideal case motor unit count (ICMUC) to reflect the ideal conditions used for its calculation. However, these assumptions can be reasonable met when the SIP is recorded at a low force contraction, with few motor units
discharging at a low rate.
When the force of contraction increases, larger motor units will be recruited and superimposition of SMUPs will also occur, giving higher amplitude signals. This will lead to a decrease in the ICMUC. So, to compare ICMUC values between subjects, standardization of force would be necessary. However, this can be a very laborious and tedious task, impracticable in the clinical setting. Instead, one can use the SIP area as reflection of force.
A plot of the ICMUC vs. SIP area would reflect the number and size of the motor units recruited at the each force level. The following equation models the relationship between these variables in order to facilitate comparison and quantitation:
𝐼𝐶𝑀𝑈𝐶 = 𝐴 𝑥 (𝑆𝐼𝑃 𝐴𝑟𝑒𝑎)𝛼
The values of A and α are obtained through a linear regression between the recorded ICMUC and SIP area values.
For the purpose of comparisons between laboratories, one as to define at what SIP area MUNIX calculation is made. The value of 20 mV/ms was then proposed by the authors (Nandedkar et al., 2004). Despite this value may seem a bit arbitrary, there are some practical reasons for it to be chosen. This SIP area is achieved with slight
contraction, where the motor units recruited are small, with somewhat similar size and without significant superimposition, thus approaching as much as possible the ideal conditions of the model. If different SIP areas are used for the calculation, MUNIX values will differ, making it obvious that this computation is in fact an index and not a direct estimate of the number of motor units.
MUSIX
A measure that can be easily obtained after the MUNIX calculations is the average size of a motor unit on the studied muscle. This value is called motor unit size index (MUSIX), is measured µV in and it is obtained according to the formula:
𝑀𝑈𝑆𝐼𝑋 = 𝐶𝑀𝐴𝑃 𝐴𝑚𝑝𝑙𝑖𝑡𝑢𝑑𝑒 𝑀𝑈𝑁𝐼𝑋
In contrast with most MUNE techniques that estimate the average size of the SMUP first and then the MUNE, this method calculates MUNE first and then SMUP average size.
Advantages
MUNIX is a non-invasive method that allows for a quick estimation of the number of motor units in a given muscle. In average only 5 minutes are needed for a muscle to be assessed. Also, it is not a very challenging method regarding technical difficulties. It is not discomfort for the subject as it only requires one CMAP to be obtained by electrical stimulation. It can be applied to any muscle, distal or proximal, where a CMAP can be obtained. Finally, it can be easily done in most EMG machines, since the software used to analyze the data is independent from the EMG software and can be executed in any computer.
Disadvantages / Limitations
For MUNIX measurements some degree of patient cooperation is required, which is not always achieved due to tremor , spasticity or cognitive dysfunction. The index given by this method is not an estimate of the true number of motor units, hindering the comparison with other MUNE techniques.
When the motor units have a bimodal distribution it is not possible to achieve a full range of force levels. In this situation, the SIP will have low amplitudes at slight efforts and very large-amplitude at moderate and high efforts. This combination yields a higher MUNIX that would be expected for that muscle. When this bimodal distribution appears, changing the "SIP area > 20 mV/ms criteria" to 50 mV/ms will reduce
When the CMAP amplitude is very small the recording of SIPs can contain volume-conducted activity from nearby muscles (Nandedkar and Barkhaus, 2007). For this reason, when the CMAP in a muscle is < 0.5 mV, that muscle is considered not suitably for MUNIX measurements.
2. OBJECTIVES
Primary:
To assess the test-retest variability of a novel neurophysiological technique (MUNIX) for the estimation of the number of motor units in healthy subjects.
Secondary:
To evaluate the suitability of this technique as a potential marker of disease progression in ALS.
3. STUDY POPULATION
The study population was be divided in two groups: a group of healthy subjects and a patient group (patients with ALS).
Healthy subjects group
This group comprised 15 healthy individuals older than 20 years without any medical or neurological disorders that might influence MUNIX measurements (e.g. peripheral nerve dysfunction, neuromuscular disorders, diabetes, oncological diseases or drug treatment with neurotoxic drugs).
Informed consent was obtained from all subjects.
The subjects were subdivided into two age groups, between 20 and 59 years and 60 years or older in order to take into account the physiological loss of motoneurons associated with aging (Doherty et al., 1993).
Patients group
This group included patients with ALS/MND. These patients fulfilled the
category for possible, probable lab-supported, probable or definite ALS regarding to the revised El Escorial criteria. All were diagnosed as ALS according to Awaji guidelines. The patients had a minimum follow-up of 9 months, with visits approximately every 3 months.
Symptom onset, defined as onset of weakness, muscle wasting, fasciculations, cramps (not present before), dysarthria, dysphagia, dyspnea, falls or disturbance of fine movements must be less than 18 months of baseline visit.
Patients with any history of medical or neurological disorders that might influence MUNIX measurements (e.g. peripheral nerve dysfunction, neuromuscular disorders, diabetes, oncological diseases or drug treatment with neurotoxic drugs), were excluded.
4. METHODS
For the purpose of studying inter and intra rater variability, the healthy subjects group were evaluated twice by two separate investigators in an alternating fashion with a break of 30 minutes minimum between each assessment. Electrodes and marks were completely removed so that any traces of electrode placement were erased. This group was composed by 9 subjects with less than 60 years old, and 6 subjects with more than 60 years old. The division into two age groups takes into account physiological loss of motoneurons at a higher age and that the onset of ALS peaks in the 6th decade (Doherty et al., 1993).
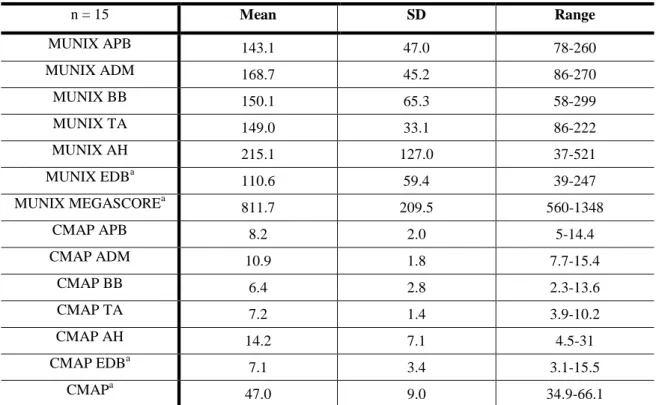
In both ALS patients and healthy subjects, the following muscles were assessed: abductor pollicis brevis (APB), abductor digiti minimi (ADM), biceps brachii (BB), tibialis anterior (TA), abductor hallucis (AH) and extensor digitorum brevis (EDB) after supramaximal distal stimulation of the median, ulnar, musculocutaneus, tibial and peroneal nerves, respectively. In ALS patients the clinically less affected side was examined. If both sides were affected symmetrically, the right side was chosen. Since the loss of motoneurons is often focal in ALS, measurements in multiple muscles (proximal and distal; upper and lower limbs) will probably reflect the amount of functioning motor units more accurately. For that purpose, the MUNIX and CMAP megascores were calculated by aggregating the results of individual muscles in a subject.
In ALS patients the following clinical data was collected: gender, age, region of onset and disease duration The ALSFRS-R scale (Cedarbaum et al. 1999) was applied at the time of MUNIX calculation. Before performing MUNIX measurement, manual muscle testing according to the Expanded Medical Research Council Scale for Manual Muscle Testing (MRC) was performed in each investigated muscle.
ALS patients were evaluated approximately every 3 months (± 4 weeks) for a period of 9 to 12 months. Multiple point stimulation MUNE (Brown and Milner-Brown, 1976; Kadrie et al., 1976) in ADM was also performed in every visit for the purpose of comparison between the two techniques.
The same surface electrodes (Cardinal Health, Madison, WI, USA, disposal ground and 2 disc electrodes, 15mm diameter, Ref 019-415200) were used throughout the study. Measurements were performed using a Keypoint® EMG machine.
For the measurements, subjects were positioned in a comfortable, supine position. MUNIX measurements were performed according to the manner previously described in this work (see 1.4 MUNIX).
Particular attention was paid to electrode placement and limb position, in order to ensure consistency between repeated measures. The tested muscle was fully relaxed and in neutral position. Skin surface was always cleaned properly before applying electrodes. Positioning of the stimulation and recording electrodes and distances between the active and reference electrode were standardized.
Abductor pollicis brevis
The active electrode was positioned in the thenar eminence; the reference electrode was positioned on the distal phalanx of the thumb; ground electrode was placed over the back of the hand. Electrical stimulation was applied on the median nerve just above the wrist, at 7 cm from the active electrode.
Abductor digiti minimi
The active electrode was positioned on the hypothenar muscle; the reference electrode was positioned on the distal phalanx of the 5th finger; ground electrode was placed over the back of the hand. Electrical stimulation was applied on the ulnar nerve just above the wrist, at 7 cm from the active electrode.
Biceps Brachii
The active electrode was positioned on the middle of the long head of the BB; the reference electrode was positioned on the medial epicondyle; ground electrode was positioned on the interior surface of the arm. Electrical stimulation was applied on the musculocutaneous nerve in the axillary fold.
Tibialis anterior
the interior surface of the leg. Electrical stimulation was applied on the peroneal nerve, posterior to the head of the fibula.
Abductor hallucis
The active electrode was positioned over the middle portion of the abductor hallucis; the reference electrode was positioned on the first toe; ground electrode was positioned on the internal malleolus. Electrical stimulation was applied to the tibial nerve posterior to the internal malleolus.
Extensor digitorum brevis
The active electrode was positioned over the extensor digitorum brevis; the reference electrode was positioned on the 5th toe; ground electrode was positioned on the dorsum of the foot. Electrical stimulation was applied to the peroneal nerve just above the ankle.
The recording electrode position was always adjusted in order to achieve
maximal amplitude with minimum rise time and a sharp negative takeoff of the CMAP. In reproducibility investigations (healthy subjects group) the amplitude of the CMAP was maximized in each occasion, without referring to previous values. In serial investigations (ALS group) the amplitude of the previous assessment was used as the target amplitude. If CMAP amplitude was less than 0.5 mV, this muscle was excluded. For the SIP recordings, the activation of each muscle was carefully assessed, in order to avoid the recruitment of neighboring muscles, in particular in weak ALS patients. Special attention was paid to temperature (always higher than 29 degrees on the dorsum of hands and 27 degrees on the dorsum of feet).
All the electrophysiological tests (MUNIX, MUNE and CMAP) were performed by the author.
Statistical analysis
For statistical analysis of variability (intra and inter-rater test–retest reliability), a two-way random, single measure intraclass correlation coefficient (ICC) was calculated. The ICC represents the variability over measurements of every subject divided by the