The "Iberian Tigers" versus The "Celtic Tiger": Economic Growth Paths in an Economic History perspective
Tiago Neves Sequeira*
ABSTRACT
The years following the Second World War are those of greatest economic growth in Europe. If the countries of the Iberian Peninsula, neutral in the conflict and ruled by dictatorial regimes, enjoyed that growth and had participated in the convergence phenomenon, Ireland, also neutral but democratic, was not able to converge to the developed world. Since 1973, with petroleum crashes, the process of growth has slowed in Europe, but it was only after 1985 that Ireland began to grow at impressive rates. We review, in an economic history perspective, the implications of the institutional environment and the economic policy decisions. We also address the consequences and plausible explanations for the different growth paths of those countries and revisit the puzzle of slow Irish growth until the middle eighties.
Key-Words: Second World War, Economic Growth, Convergence, Periphery, Europe, Ireland, Portugal, Spain.
JEL Classification: N10, N14, O11.
* Graduate student in the doctoral program of Faculdade de Economia, Universidade Nova de Lisboa and teaching assistant at Departamento de Gestão e Economia of Universidade da Beira Interior. I am grateful to the Fundação para a Ciência e Tecnologia (PRAXIS XXI/BD/21485/99) for financial support during the second year of my Ph.D. program. I am grateful to Luciano Amaral for extensive discussion and suggestions and to John Huffstot for text revision. I also gratefully acknowledge Ana Balcão Reis, Alvaro Ferreira da Silva, José Tavares, Ricardo Alves and Carlos Osório for discussion and many comments and suggestions. The usual disclaimer applies.
1. Introduction
Ireland, Portugal and Spain provide a good case to study economic growth because they all had a low per capita income in the 1930s, followed by quite different growth paths: Portugal and Spain experienced fast growth until 1973, slowing after that date, while Ireland’s fastest growth period was after 1985. In this paper we will examine these paths side by side, while citing the range of literature addressing the subject.
We review, in an economic history perspective, the implications of the institutional environment and the economic policy decisions: political regimes and institutions, industrial policy, trade policy and fiscal and monetary policy. We also address the consequences and plausible explanations for the different growth paths of those countries and revisit the puzzle of slow Irish growth until the middle eighties, suggesting some explanations for the fact.
In Section 2 we describe, on a comparative basis, the different periods of economic growth in the three countries, paying special attention to the possible relationship between policies, institutions and economic growth. Then, in Section 3, we review the main growth accounting studies that compare these countries, trying to distinguish the main sources of different growth rates. Next, in Section 4, we re-address the well-known puzzle about Irish growth. Finally, in Section 5 we conclude. With this, we wish to create a comparable body of reference regarding growth paths over the greater part of the twentieth century in these countries.
2. The economic history of three peripheral countries in Europe: Ireland, Portugal and Spain
2.1 Political and Economic instability (1930s and 40s)
The late twenties and early thirties were years of disruption in all these countries. Portugal and Spain faced a political transition to dictatorial regimes, although this transition was much more pronounced in Spain, with its Civil War (1933-39). But the new regimes in the Iberian countries had the same economic motivation: to solve the economic and financial
problems of the countries and their governments. Ireland had a democratic regime but gained political independence from the United Kingdom during the twenties, going through difficult social traumas in the process (César das Neves (1996), Ó Gráda e K. O’Rourke (1996), Prados de Escosura and Sanz (1996)).
Portugal and Spain adopted a new form of labor organization aimed at avoiding social conflict. The new Corporations were organizations that tried to reconcile employees’ and employers’ needs and ambitions. In Spain the Ley basica de trabajo (Basic Labor Law ) (1939) forbade labor unions and enforced affiliation in the state organizations. In Portugal the Ordem Corporativa1 (Corporative Order) forbade strikes and lockout and fomented the direct negotiation between employers and employees. Ireland had free labor organizations. A summary of the main policies followed during the period in analysis is made in Table 1. Table 1 – Summary of Policies during the whole period
Political regime
and institutions Industrial Policy Trade Policy Fiscal/Monetary Policy
IRELAND
Democracy. Free labor unions and centralized wage negotiation.
Industrial Conditioning (started in 1932). Restrictions to FDI. Large State-owned sector. Large incentives to FDI in the 80’s.
Protectionist until late 40’s. Anglo-Irish Agreement (1948). Free-Trade Agreement with England (1966). EEC (1973).
Keynesian Policy in social issues: housing, health and education. 1970’s: reform of the education sector.
Fiscal consolidation in middle 80’s.
PORTUGAL
Autocracy (until 1974). Non-free labor unions and decentralized wage negotiations.
Industrial Conditioning (started in 1931, ended in 1974). Restrictions to FDI. Minor intervention until 1945; intervention on a development plans basis, after 1945. Few state owned enterprises until 1974. Nationalizations after the Revolution. Incentives to FDI after 80’s. Import Substitution from middle 40’s to late 50’s. Protectionist until late 50’s. Colonial Act (1930). EFTA (1958). EEC (1986).
Neoclassical Policy: low inflation and Budget equilibrium. After Revolution (1974), macroeconomic instability took place: inflation, public and external deficit. IMF
interventions. Structural Reforms after middle 80’s.
SPAIN
Autocracy (until 1975). Non-free labor unions and centralized wage negotiations.
Industrial Conditioning (started in 1939, ended in 1975). Restrictions to FDI. Large state owned sector. Incentive policies and privatisations in the 60’s. Incentives to FDI after 80’s.
Import Substitution from late 30’s to late 50’s. Protectionist until late 50’s or later.
EEC (1986).
Nominal desiquilibrium: High inflation and external deficits. Stabilization Plan (1959). After transición inflation and deficit returned. Structural Reforms after middle 80’s.
1 The Corporative Order was based on the Constitution (1933), Main Law of labor (1933) (Estatuto do
The Great Depression and Free Trade collapse: How Ireland, Spain and Portugal dealt with these changes.
It can be said that the consequences of the Great Depression were more harmful to Ireland (the smallest and the most open economy of the three) than to Spain, and worse in Spain than in Portugal. The Spanish government implemented a fiscal contraction at the time of the crisis that is thought to have worsened the situation. In Portugal, Salazar’s government had maintained the belief in budget equilibrium, which led to a slight decrease in public expenditures. However, simultaneously, it lowered interest rates, which benefited investment and public deficit (Prados de Escosura and Sanz (1996), Valério (1982)).
In response to the world trade crisis, these countries adopted protective measures that included industrial conditioning2, high tariffs, quotas and restriction to foreign direct investment (FDI)3. The industrial conditioning laws restricted the entry and localization of
enterprises to those authorized by the government. On one hand, this avoided the usual mergers and acquisitions in a free entry economy. On the other hand, it did not favor technological progress, which is often linked with the competitive environment. Nevertheless, some theses point out that industrial conditioning might have had an important role in markets where excessive entry occurred, possibly promoting mergers and acquisitions. Authors who promote this view also argue that the contestability of concentrated markets took place. Nevertheless, the incumbent firms usually did not promote innovation and development in order to deter new entrants, but argued with excessive capacity (Confraria (1992)), although some cases of innovation and process or quality improvement might have occurred.
Aside from the domestic protectionism, firms in all three countries were protected by high tariffs, and in the Portuguese case also by the Colonial Act (Acto Colonial, 1930), aimed at keeping the colonial market free of foreign firms. The Lei de Nacionalização do Capital (Capital Nationalization Law) in Portugal, the Ley de Ordenación e Defensa de la
2 The Portuguese industrial conditioning regime began in 1931, the Irish in 1932 and the Spanish in 1939. 3 Note that some protective measures were taken elsewhere around the world at this time. As a
consequence, value of trade worldwide fell more than 50% between 1920 and 1932 (Feinstein, Temin and Toniolo, 1997), with the greatest decline being between 1929 and 1933. According to Kindleberger (1973), the volume of trade in 1933 was only 33% of that in 1929. About protective measures taken after the Great Depression, see also Aldcroft (1987, pp.33 and 45).
Industria Nacional (Law for the organization and defense of national Industry), in Spain and the Manufactures Acts, in Ireland, strongly limited foreign investment.
There is, however, a remarkable distinction between the strategy of Spain and Ireland, on the one hand, and Portugal on the other: the government intervention. In Portugal the government did not intervene in the industrialization process until 1945 (Lains, 1994). On the contrary, in the other two countries the government intervened in the process. In Spain, for example, the Ley de Protección de las Nuevas Industrias de Interés Nacional (Law for protection of the new strategic industries) (1939) gave incentives to the creation of new industries and Instituto Nacional de Industria (the National Industry Institute) (1941) created a diversified group of new state-owned enterprises4. In Ireland, a large number of state-owned industries were created mainly in selected sectors: communications, transports, tourism and industry. This institutional and legal environment created small privately owned firms, which could not benefit from scale economies (Braña et al. (1984), César das Neves (1994, 1996), Harrison (1978), Leddin and Walsh (1998), Prados de la Escosura and Sanz (1996), Marques (1988)).
The Second World War: Consequences and Development Strategies
This is a period of supply problems in these countries, a situation which drove the governments to strive for self-sufficiency. With the end of the conflict, Spain ended up with no supplier of modern technology, not only because of the collapse of its former supplier (Nazi Germany), but also because of the UN embargo (1946). This fact, coupled with a depreciation of the national currency (Peseta), prevented Spain from importing intermediate goods that were needed to implement the import substitution strategy. In Ireland, the problem was not so different. The main supplier of technology (the United Kingdom) was now a destroyed country. Besides this, the controlled prices of agricultural goods in the UK had reduced the income of Irish peasants and their production, as well. Portugal had quite a different story to tell: although its economy felt some technology needs, its exports (mainly minerals and textiles) rose considerably during the war, increasing the accumulation of capital in the economy (Braña, Buesa and Molero (1984),
4 This began early in thirties as a substitution of imports strategy as part of the war effort by the
César das Neves (1994, 1996), Harrison (1978), Leddin and Walsh (1998), Prados de la Escosura and Sanz (1996), Marques (1988), Ó Gráda and O’Rourke (1996)).
The three countries felt inflationary pressures toward the end of the forties, caused by the restrictions on the supply side. While Portugal used its gold and foreign currency reserves accumulated during the war to reach equilibrium in markets with excessive demand in order to decrease inflation, Spain and Ireland liberalized international trade, permitting a gradual increase in imports in the former and a more significant increase in imports in the latter. However, some thought that the Anglo-Irish Commercial Agreement (1948), which opened the English market to the Irish agricultural goods, was the answer to all Irish problems. On the contrary, the agreement proved disastrous to Ireland, through the evolution of terms of trade (César das Neves (1996), Ó Gráda and O’Rourke (1996) and Prados de la Escosura and Sanz (1996)).
Responses to domestic stress also differed. The Spanish government abandoned its autarky strategy and tried to implement an export-oriented model of industrialization (Delgado (1987), Harrison (1978), Prados de Escosura and Sanz (1996)). On the contrary, Portugal and Ireland did not promote exports. Portugal embarked on an import-substitution model of industrialization, based on the accumulated gold and currency reserves(Mateus (1998), Rosas (1990)). Ireland believed that the core of its problems resided in the agricultural sector, leading the government to raise tariffs and implement other protectionist measures (Ó Gráda and O’Rourke (1996)).
A remarkable difference between the Iberian countries and Ireland was that this country promoted explicit Keynesian policies, giving rise to social investment in schools, hospitals and subsidized housing policies. In fact, Ireland maintained a rate of social investment quite high for that time, while the Portuguese government promoted nominal equilibrium, as it thought that it was the best environment for investment(César das Neves (1996), Ó Gráda and O’Rourke (1996), Prados de Escosura and Sanz (1996)). We can also say that
Spain occupied a middle ground between classical and Keynesian policies, as it intervened in the industrialization process but did not promote explicit classical policies.
European reconstruction following the Second World War demonstrated the need for some planning of the economic activity. Portugal, with a new industrial policy, needed to plan its
development, as well as to regulate the state intervention. In 1945 the government had passed the Lei para o Fomento e Reorganização industrial (Law for Development and Industrial Reorganization), aimed at financing infrastructures. The Primeiro Plano de Fomento (1953-58) (First Development Plan) promoted infrastructures and the creation of firms in the industrial sector (Lains (1994)). While in Portugal the main motivation to Planning was the need to implement the new industrial policy, in Ireland it was the need to manage the funds from the Marshall Plan. The first planning experience was not entirely effective but did advance the move against the protectionist policies and toward the adoption of export-oriented policies (Ó Gráda and O’Rourke (1996)). Spain, which had begun its industrial program earlier, did not need to implement planning because it did not benefit from the Marshall Plan.
Between 1950 and 1960 there were more significant structural changes in the Iberian countries than in Ireland. The most significant indicators were the acceleration of GDP and productivity growth, the increase in investment and decreased inflation (which fell below the two-digit threshold), the decreasing share of agricultural production, and employment in the total stocks. Ireland suffered from massive emigration, and this decade was a disaster in terms of economic growth (César das Neves, (1996), Harrison, (1978), Leddin and Walsh, (1998), Merigo, (1982), Prados de La Escosura and Sanz, (1996)).
The two Iberian countries had restructured their industrial conditioning systems (Portugal in 1952 and Spain in 1963). The efforts were to streamline the bureaucratic process and urge the decision maker to focus on the technical aspects to guarantee a minimum scale. Spain created a more effective incentive policy with the implementation of preferential localization zones, industrial polygons, fiscal and economic benefits, restricted discretionary administrative decisions, and privatization of its state-owned sector (Braña, Buesa and Molero (1984), César das Neves (1996)).
The sixties were the years of openness to trade and of integration in international markets, while the most respectable economic institutions (World Bank, OECD and NBER) criticized the import-substitution policies (Mateus (1998)).
2.2 Growth and Integration: The Iberian “tigers”
Spain, Portugal and Ireland joined some important international organizations. Spain joined the IMF and World Bank in 1958 and the OEEC in 1959. Portugal joined the OECD in 1948, EFTA in 1958, IMF and World Bank in 1960 and GATT in 1962. Ireland signed a free-trade association with England in 1966 and joined the EEC in 1973. It can be observed that Portugal and Ireland went deeper into the process of integration than did Spain, as only EFTA and EEC are free trade associations.
The result was an increase in exports and in FDI, as well as in the openness of these three economies. For instance, the openness ratio increased approximately 11% between 1960 and 1970 in Portugal and Spain and more than 40% between 1945 and the mid-sixties in Ireland5 (César das Neves (1996), Prados de La Escosura and Sanz (1996), Leddin and Walsh (1998)).
There were some remarkable structural differences between Portugal and Spain. While Portugal promoted nominal and real equilibrium (in part helped by emigration and emigrants’ remittances), Spain had serious problems with its inflation rate and its external deficit. To solve its problems this country sought help from the USA and promoted a Stabilization Plan (1959), which was quite effective (César das Neves (1996), Prados de La Escosura and Sanz (1996)).
Portugal witnessed high emigration for social and political reasons and had to contend with the Colonial War (1961-74), which was a great financial burden (César das Neves (1994)). The openness of the economies, the FDI, and some structural reforms permitted annual average per capita growth rates of 7% in Spain and Portugal and 4% in Ireland. What is puzzling is why Ireland did not experience faster growth when the conditions were theoretically favorable and quite similar to its Iberian counterparts.
2.3. Crisis and Integration: the Celtic “tiger”
In the seventies the world was affected by oil shocks, which seriously damaged non-producers. In the same period Iberian countries faced the political transition to democratic regimes, which exacerbated the difficulties.
After a non-violent transition, the structural debilities of the Spanish economy were the same as before because lobby pressures had stopped the liberalization. In the mid-seventies Spain had a centralized economy. Although the transition in Portugal was also peaceful, the revolution period had profound consequences on the economic structure of the country. In fact, a great share of the productive sector was nationalized in 1975. In addition, the rapid decolonization caused massive immigration: nearly half a million people returned to Portugal, placing tremendous pressures on the society (César das Neves (1996), Prados de la Escosura and Sanz (1996), Merigo (1982)). These factors are thought to have influenced a higher volatility in economic growth rates in Portugal than in Spain during this period (Amaral (1996)).
The economic adjustment to democratic regimes triggered a change in industrial and earnings structures, through the beginning of the state social security system and through the introduction of the minimum wage and controlled prices. These reforms and the first oil shock worsened the public and external deficits in the two countries.
Weak governments following the Portuguese Revolução dos Cravos and during the Spanish transición agreed on the creation of very rigid labor laws. Nevertheless, labor market rigidities led to different outcomes in Portugal and Spain. Wage levels had decreased in Portugal and unemployment increased in the latter. The wage formation system and the definition of working conditions and collective bargaining are often pointed to as the reasons for this divergence, as they were centralized in Spain and extremely decentralized in Portugal (Amaral (1996)).
While Portugal and Spain saw hard times during the regime transitions, Ireland deepened its economic integration and liberalization. However, the Irish government’s response to the oil shock included a fiscal expansion, which increased the public debt (Ó Gráda and O’Rourke (1996)).
We describe in the next two paragraphs the economic measures taken to deal with the crisis.
In Spain the main political measures were an interventionist revenue policy (moderate wage growth, Peseta's depreciation, progressive taxation), an accommodative fiscal policy and restrictive monetary policy. The authorities implemented the reform of the declining sectors and the financial sector was liberalized. Although monetary policy was thought to be essential in controlling inflation, fiscal policy had been expansionary, increasing the deficit. The reforms were able to reduce inflation and to ease the external debt, but were not successful in relieving high unemployment and public deficit (Prados de la Escosura and Sanz (1996)).
Portugal sought IMF intervention in its enormous imbalance in external and public accounts. The success of the first stabilization program was modest because high inflation had outstripped the nominal depreciation. A crawling-peg system, which had been effective in the exchange rate stabilization, was implemented. Nevertheless, the second oil shock caused serious damage to the external deficits. A second IMF stabilization program, however, proved to be quite effective and prepared the economy to join the EEC in 1986 (César das Neves (1996) and Mateus, (1998)).
By the mid-eighties, the Irish government had recognized that the expansionary fiscal policy was not helping the private sector and switched to contention in public budgets. This was quite effective in reducing the interest rate and inflation, but it had some short-term costs in short-terms of employment and growth(Fuente and X. Vives (1997), Ó Gráda and O’Rourke (1996)).
Between 1974 and 1985, Ireland clearly overtook Portugal and Spain in economic growth rates, with an annual average of 3.8% against 2.2% and 1.8% respectively. In the following years the difference between growth performances increased, although all three countries experienced faster growth.
The adhesion of the Iberian countries to the EEC coincided with a global expansionary period. This favorable international environment and the macroeconomic stability turned
out to be the best environment for investment. In Spain the effects in the labor market were clear: an employment creation rate of 3% per year that reduced the unemployment rate of about 22% in 1975 to 16% by 1990. Nevertheless, a combination of restrictive monetary and returns policies coupled with an expansionary fiscal policy put pressure on interest and inflation rates, which worsened the public and external deficits. In Portugal the macroeconomic stability was accompanied by a great push for public investment in infrastructures and by administration reforms, increasing the confidence of economic agents (César das Neves (1994, 1996), Mateus (1998), Prados de Escosura and Sanz (1996)).
Regarding nominal adjustment, Portugal and Ireland reduced their inflation rates to near 2%, and Spain to near 5% during the nineties, but the employment costs were enormous in Ireland (7.5% rise in the unemployment rate) and Spain (5% rise in the unemployment rate) but quite moderate in Portugal (2% rise) (Mateus (1998))6. Nevertheless we can see some competitive effects: despite the increase in productivity, the attractiveness of Iberian products suffered from the appreciation of the Peseta and Escudo. The gradual wage increase and currency appreciation changed the competitive strengths of these two countries (Mateus (1998), Prados de Escosura and Sanz (1996)). One of the major problems of the Portuguese economy was the low qualification of its labor force and a specialization in low technology industries. For instance, OECD figures shows that the high-tech share in Portuguese exports was 3%, the lowest in Europe, against 28% in Ireland, the highest number in Europe (Mateus (1998)).
Ireland has became an attractive destination for FDI and domestic investment, mainly because of the introduction of a credible fiscal policy and huge fiscal benefits for profits (not only profits from exports but also from all production). In addition, it accumulated over the past decades a stock of technically prepared human capital. However, Ireland faces some inefficiencies in its fiscal policies that may not conform to European competition Law (Fuente and X. Vives (1997), Walsh (1999), The Economist (1997)). Some authors also argue that the massive entry of multinationals in its economy comes at the expense of some potential domestic entrants (H. Görg and E. Strobrl (2000)).
6 The explanations for these differences are often based on different labor market rigidities or wage
During the period 1986-2001 Ireland benefited from one of the highest economic growth rates in the OECD, with an annual average of 6.1% against 3.5% and 3.2% for Portugal and Spain, respectively. The Golden Age has come to Ireland, 20 years after its Iberian counterparts.
In Table 2 we summarize the growth rates of these countries in different periods. In Table 3 we present the relative GDP between these countries and the USA in different years.
Table 2 – GDP per capita Growth Rates (%)
1950-73 1961-73 1974-85 1986-2001
EU-15 -- 4.40 2.00 1.70
IRELAND 3.1 4.40 3.80 6.10
PORTUGAL 5.6 7.00 2.20 3.50
SPAIN 5.8 7.20 1.80 3.20
Source: Maddison (1995), European Commision (2001)
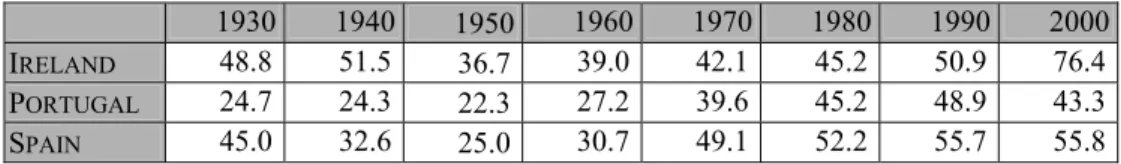
Table 3 – Relative GDP per capita (in % of USA GDP per capita)
1930 1940 1950 1960 1970 1980 1990 2000
IRELAND 48.8 51.5 36.7 39.0 42.1 45.2 50.9 76.4
PORTUGAL 24.7 24.3 22.3 27.2 39.6 45.2 48.9 43.3
SPAIN 45.0 32.6 25.0 30.7 49.1 52.2 55.7 55.8
Source: Maddison (1995), Penn World Table 5.6 for 2000.
In the next section we review growth accounting studies and try to summarize the sources of different growth paths between these three countries.
3. Growth and Convergence Sources
Traditional growth-accounting7 studies suggest that Spanish growth had a greater productivity increase component than did Portuguese growth, which was more capital intensive. Labor rarely contributed in a significant way to growth, except in the period 1974-79 in Portugal, and in the period 1986-90 in Spain (J. César das Neves (1994), L. Prados de la Escosura and J.C. Sanz (1996)).
7 Growth Accounting means some accounting techniques which permit the expression of GDP growth rate as
a function of the productive factors’ growth rates. This always has some hypothesis about the functional form of the Production function. See Methodological Appendix for some details.
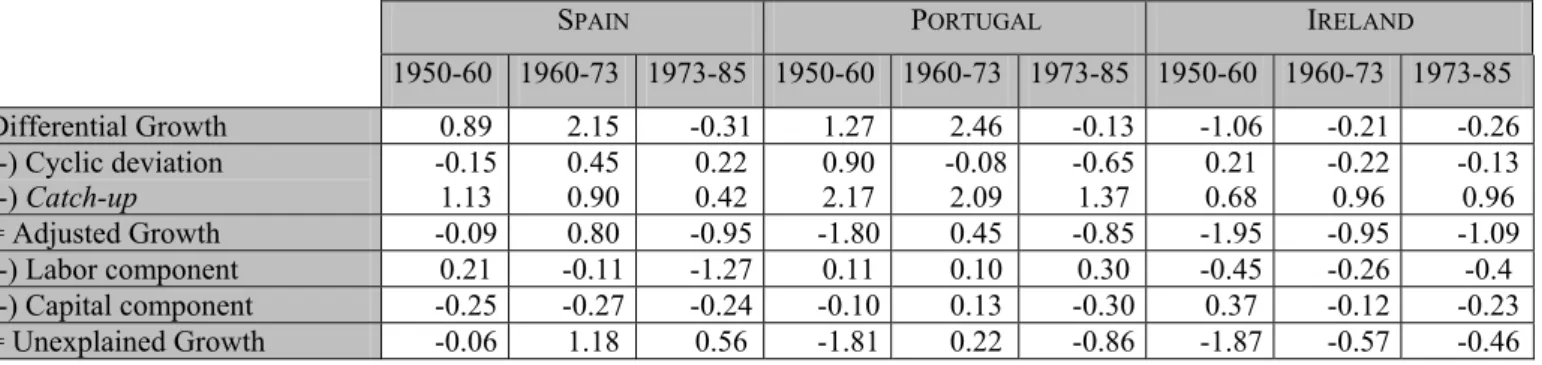
Dowrick and Nguyen (1989) studied relative growth in OECD countries and concluded that the catching-up process (the tendency for less developed countries to experience faster growth due to technology transfer from developed countries) was the main source of convergence in all three countries (Table 4).
Table 4 – Relative GDP per capita Growth Rates decomposition
SPAIN PORTUGAL IRELAND
1950-60 1960-73 1973-85 1950-60 1960-73 1973-85 1950-60 1960-73 1973-85 Differential Growth 0.89 2.15 -0.31 1.27 2.46 -0.13 -1.06 -0.21 -0.26 (-) Cyclic deviation (-) Catch-up -0.15 1.13 0.45 0.90 0.22 0.42 0.90 2.17 -0.082.09 -0.65 1.37 0.21 0.68 -0.220.96 -0.130.96 = Adjusted Growth -0.09 0.80 -0.95 -1.80 0.45 -0.85 -1.95 -0.95 -1.09 (-) Labor component 0.21 -0.11 -1.27 0.11 0.10 0.30 -0.45 -0.26 -0.4 (-) Capital component -0.25 -0.27 -0.24 -0.10 0.13 -0.30 0.37 -0.12 -0.23 = Unexplained Growth -0.06 1.18 0.56 -1.81 0.22 -0.86 -1.87 -0.57 -0.46
Source: Dowrick and Nguyen (1989).
Note: All variables are measured in log deviations from OECD mean. The adjusted growth rate is the long-run tendency adjusted for differences in the catching-up process. The labor component is measured by the difference between employment and population growth. The capital component is measured by the difference between capital/GDP growth and population growth. Unexplained growth is measured as residual. See Methodological Appendix.
Until 1985 Ireland had markedly diverged from OECD growth rates, while Portugal and Spain had markedly converged. The contribution of production factors was minimal, but capital had some importance in Portugal during the period 1960 to 1973 and in Ireland in the first period. Labor had some importance in Ireland during the period but less in the Iberian countries, not only because it had a smaller share of total variation of relative GDP but also because in some periods it had an opposite direction to differential growth. If the unexplained growth could be associated with exclusive domestic total factor productivity, it would have contributed moderately to convergence in Spain after 1960 and to divergence in Portugal between 1950 and 1960 and between 1973 and 1985 and in Ireland during all the period.
Andrés et al.’s (1992) study8 suggested that convergence, investment and human capital had a strong effect in Spain and Portugal, while the exports growth rate had an important effect in Ireland. The inflation rate is not particularly important in explaining convergence in these countries.
Fuente’s (1995) model9 explains the sources of growth and convergence in OECD countries, using an extension of Dowrick and Nguyen’s model (1989), in which the innovation rate is endogenously determined by the research and development (R&D) level and by the catching-up process, while explicitly incorporating the possibility for increasing returns. This model’s aim is to distinguish two kinds of convergence: neoclassical convergence, linked to the existence of decreasing returns to initial endowment; and catching-up convergence, linked to the adoption of new foreign-developed technologies. For Ireland, Portugal and Spain the results show a weak effect of R&D and factor accumulation between 1960 and 1988, and confirm the importance of the two convergence effects, especially the catching-up process.
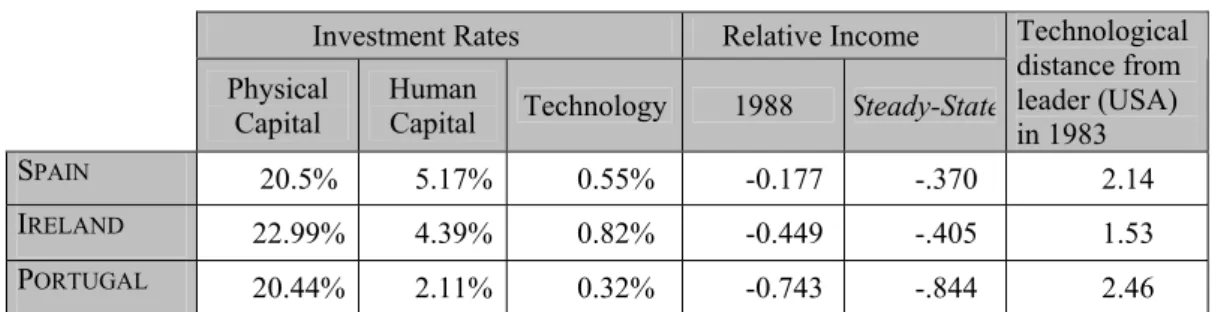
The existence of decreasing returns and technological diffusion are consistent with persistent differentials on income and production, if the investment rates are smaller in poorer countries (Op. cit.). Table 5 shows long-run values for each of the studied countries, which are based on actual investment rates for the period 1983-88.
Table 5 – Investment rates and relative income in the long run Investment Rates Relative Income Physical
Capital Human Capital Technology 1988 Steady-State
Technological distance from leader (USA) in 1983 SPAIN 20.5% 5.17% 0.55% -0.177 -.370 2.14 IRELAND 22.99% 4.39% 0.82% -0.449 -.405 1.53 PORTUGAL 20.44% 2.11% 0.32% -0.743 -.844 2.46 Source: Fuente (1995).
Note: Relative Income is the deviation from OECD mean in logs; Relative income in Steady-State is calculated using the model parameters.
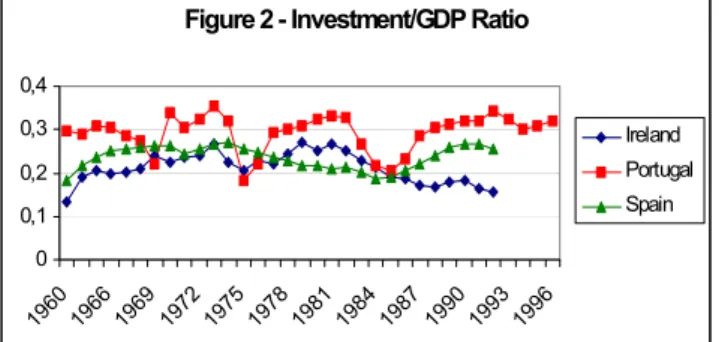
The results are not optimistic towards the future of these countries, if the investment rates do not change. Nevertheless, high investment rates in technology and human capital in Ireland made this country the only one to benefit from a better position in the steady-state than in 1988, although this model does not include the period of faster growth of Ireland. We must caution that investment rates are calculated over the short period 1983-85, which may not be representative of the entire trend, as it occurs in Portugal, for instance (see Figure 2, above).
The most recent study is a simple growth accounting exercise that explicitly compares the three countries under consideration (Freitas (2000)), although it does not account for convergence effects. This suggests, in contradiction to earlier evidence, that Portuguese and Spanish growth depended mainly on capital accumulation, while Irish growth depended on Solow residual or total factor productivity. In fact, the author argues that the low values for Irish depreciation rates and high productivity may suggest high quality of factors, supported by institutional environment, education attainment and research and development. However, between 1994 and 1998 the Irish economy’s growth had a great contribution from the labor factor.
Fuente and Vives (1997) compare the growth sources of Ireland with growth sources of an aggregate of the Iberian countries, which include human capital, research and development and fiscal policy effects. In the next figures we show some relevant time series data.
Figure 1 - Relative per capita Income
-1 -0.8 -0.6 -0.4 -0.2 0 1947 1952 1957 1962 1967 1972 1977 1982 1987 1992 Ireland Portugal Spain
Figure 2 - Investment/GDP Ratio
0 0,1 0,2 0,3 0,4 196 0 196 6 196 9 1972 197 5 197 8 1981 198 4 198 7 199 0 199 3 199 6 Ireland Portugal Spain
Figure 3.1. - Enrollment in secundary and tertiary education 0 50 100 150 200 196 0 197 0 198 0 199 0 199 2 199 4 199 6 Ireland Portugal Spain
Figure 3.2 - Education expenditures/ GDP ratio (%) 0 2 4 6 8 19701975198019851990199119921993199419951996 Ireland Portugal Spain
Figure 4 - R&D expenditure/GDP ratio (%)
0 0,5 1 1,5 2 1980 1982 1984 1986 1988 1990 1992 1994 1996 Ireland Portugal Spain
Figure 5 - Government expentiture/GDP ratio
0 0,05 0,1 0,15 0,2 0,25 1960 1966 1969 1972 1975 1978 1981 1984 1987 1990 1993 1996 Ireland Portugal Spain
Source: OCDE National Accounts Source: UNESCO Yearbooks
Source: UNESCO Yearbooks Source: UNESCO Yearbooks
Source: OCDE National Accounts Source: Maddison (1995)
Figure 1 shows the evolution of per capita relative income. Figure 2 shows the evolution of the ratio of investment to GDP. Figures 3 and 4 show the evolution of school enrollment, investment in education and in R&D. Figure 5 shows the evolution of the ratio of public expenditure to GDP.
Figure 1 needs some remarks: (1) the income differential between Spain and Portugal derives from earlier periods. In this period, Portugal had slightly recovered some differential; (2) the differential between Ireland and OECD was smaller than the differential of the Iberian countries until the mid-sixties, when it was passed by Spain and then by Portugal. In 1992, Ireland had decreased the differential to lower levels than Portugal and Spain. More recent data show that Irish per capita income is indeed higher than the European Union mean (Leddin and Wash (1998)).
The ratio of investment to GDP has been considered to be one of the most important variables in the growth process (Fuente (1995)). Portugal has consistently showed the highest value for this variable, except in 1975 (see Figure 2). Nevertheless, its recent decrease in Ireland does not appear to have negatively affected the growth rate there.
As for technological and human capital investment, Ireland has always occupied the pole position. In addition UNESCO data report that the proportion of university graduates in the labor force has remained greater in Ireland than in the other two countries from 1970 on. In 1995 this number was 2% in Ireland against 1.1% in Spain and 0.8% in Portugal (UNESCO (1999)).
A final important difference between Ireland and the Iberian countries is the share of public expenditure in GDP. Figure 5 shows that this share is sharply decreasing in Ireland after 1985, against an increase in tendency in Portugal and Spain.
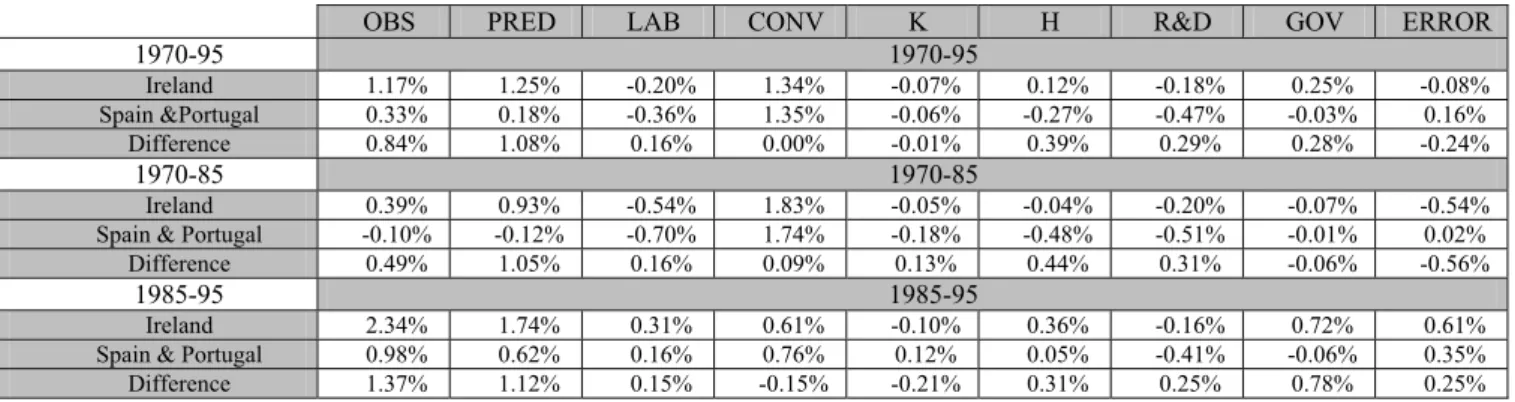
Table 6 – Sources of differential growth between 1970 and 1995
OBS PRED LAB CONV K H R&D GOV ERROR
1970-95 1970-95 Ireland 1.17% 1.25% -0.20% 1.34% -0.07% 0.12% -0.18% 0.25% -0.08% Spain &Portugal 0.33% 0.18% -0.36% 1.35% -0.06% -0.27% -0.47% -0.03% 0.16% Difference 0.84% 1.08% 0.16% 0.00% -0.01% 0.39% 0.29% 0.28% -0.24% 1970-85 1970-85 Ireland 0.39% 0.93% -0.54% 1.83% -0.05% -0.04% -0.20% -0.07% -0.54%
Spain & Portugal -0.10% -0.12% -0.70% 1.74% -0.18% -0.48% -0.51% -0.01% 0.02%
Difference 0.49% 1.05% 0.16% 0.09% 0.13% 0.44% 0.31% -0.06% -0.56%
1985-95 1985-95
Ireland 2.34% 1.74% 0.31% 0.61% -0.10% 0.36% -0.16% 0.72% 0.61%
Spain & Portugal 0.98% 0.62% 0.16% 0.76% 0.12% 0.05% -0.41% -0.06% 0.35%
Difference 1.37% 1.12% 0.15% -0.15% -0.21% 0.31% 0.25% 0.78% 0.25%
Source: Fuente e Vives (1997).
Legend: OBS – observed differential in growth rate of GDP per capita between these countries and OECD mean; PRED – estimate of OBS; LAB – Labor effect; CONV – convergence effect; K – Physical Capital effect; H – Human Capital effect; R&D – R&D effect; GOV – Fiscal policy effect. See Methodological Appendix for details.
The table shows a strong convergence effect (CONV), in line with all other mentioned studies. In contrast with Dowrick and Nguyen’s model, Ireland strongly benefited from this effect, which, of course, is due to the period of time under consideration. Ireland had also gained from an expansionary fiscal contraction10 (GOV) and from the accumulation of Human Capital (H), in contrast to what occurred in the Iberian countries. We could conclude that, with the exceptions of convergence effect and physical capital investment, all sources of convergence are favorable to Ireland.
When the model is divided into the periods (1970-1985 and 1985-1995), it loses some explanatory power for the Irish case, increasing the error component and gaining explanatory power for the Iberian case. In the first period, only the convergence effect is positive in Spain and Portugal. In the second period there is a positive effect in almost all the factors, except in Physical Capital and R&D in Ireland and in Fiscal Policy and R&D in Spain and Portugal.
The main conclusions of the growth accounting exercises presented in our survey suggest that Portugal was the country that benefited least from increases in productivity, while Ireland was the country where productivity and efficiency were most important. Portugal showed lower investment rates in technology and human capital than did Spain and Ireland, but higher investment rates in physical capital. All studies point to convergence effects as the main factor that explains growth and convergence in these countries. The
10 It is said that an expansionary fiscal policy that has a positive effect on GDP growth is expansionary.
This is a phenomenon that is supported by the Ricardian Equivalence effect. For more on this, see Romer (1996).
recent fiscal intervention in Ireland seems to have been crucial in improving growth, which may be a good signal to the other countries.
The absence of complete growth and convergence studies for the period before 1970 has left the puzzle unanswered: why did Ireland fail to converge until the seventies, despite the fact that it had all or more of the conditions to do so than its Iberian counterparts, and had adopted very similar structural policies?
4. Trying to address the puzzle: why did Ireland fail to converge until the seventies while Portugal and Spain did?
Some authors (Walsh (1993, 1999), Ó Gráda and O’Rourke (1996), Fuente and Vives (1997)) have tried to find reasons for the disappointing growth performance of Ireland up to the mid-eighties, when the main factors responsible for the current growth rates were already present at least from 1960 on.
It is consensual that the substitution-of-imports strategy of the fifties was detrimental to growth. However, Iberian countries were submitted to imports-substitution policies and experienced faster growth. In addition, the intense liberalization of Ireland in the sixties did not foster growth. Ó Gráda and O’Rourke (1996) argue that tariffs were replaced by non-trade policy measures, mainly by industrial subsidies and other incentives. This is indeed a factor that is associated with Ireland’s present growth. Nevertheless, Walsh (1999) pointed out a crucial change in incentive policy: the introduction of more sophisticated objectives in the firms and industry selection and extension of the reduced tax to the non-trade sector (financial, for instance).
The tight trade link between the Irish economy and that of the United Kingdom, where growth rates were much lower than those of continental Europe, might be another factor that deterred Irish growth. However, Walsh (1993) demonstrated that after 1960 the growth rates in Ireland show a stronger correlation with those of OECD than those of the UK. The same author argues that emigration has decreased effective human capital stock and so potential growth rates in Ireland may be overestimated. Nevertheless, he observes that the
proportion of highly qualified emigrants had increased while total emigration decreased, which weakens his argument. On the other hand, it is interesting to analyze the composition of human capital. According to the same paper, a technological non-tertiary education system was created only at the beginning of the seventies. Until then, a great part of the educational system was controlled by the Church, which gave special attention to humanities and social sciences.
The last theory that may explain the puzzle is associated with institutional economics11. In fact, Olson argues with a lack of disruptive factors, there is a strong tendency for an increase in the influence of lobbies. The great majority of historians agree that the agrarian revolutions of the XIX century mantained the same institutions and industrial and commercial relations in Ireland. Ó Gráda and O’Rourke argue that some Irish institutions supported the inefficient allocation of resources to benefit some groups in the society. They argue, for instance, that the wage negotiation system was detrimental to growth. Durkan12 concluded that centralized negotiations favored high wage growth. Between 1960 and 1987 Ireland adopted, in a discontinued form, centralized wage negotiations, provoking productivity losses when compared with other countries. In contrast, recently Walsh (1999) argued that the credible return to centralized negotiation processes had contributed to moderate wage growth.
Nevertheless, the comparison between Ireland and Iberian countries may be interesting, as Spain had centralized collective bargaining but Portugal did not. Olson13 argues that authoritarian systems pay attention to the macroeconomic environment and avoid struggles between labor unions, giving rise to slow wage growth, which is one of the necessary growth conditions, according to Eichengreen (1996). However, decentralized negotiations in Portugal allowed higher volatilities in wage growth than in Spain, which means that wages grew more in expansions and decreased more in recessions than they did with Spanish centralized bargaining. This means that labor market rigidities are stronger in Spain than in Portugal.
In spite of that, when we compare wage growth with productivity growth, it is shown that Ireland had labor productivity losses compared to its Iberian counterparts. The analysis of
11 See Ó Gráda and O’Rourke (1996), B. Eichengreen (1996). 12 See Ó Gráda and O’Rourke (1996).
net productivity, defined as the growth rate of labor productivity less the growth rate of wages, is intuitive. The rational entrepreneurial decision must be based on net marginal productivity: the marginal increase in output less the marginal increase in labor costs from an additional unit of labor in productive activities.
Table 7 – Average labor net productivity gains14
1961-72 1973-85 1986-96
Ireland -1.69% 0.44% 0.91%
Portugal -1.16% 0.96% -0.33%
Spain -0.04% 0.32% 0.09%
Source: OECD Economic Outlook. Calculations by the author.
Table 7 shows that Ireland faced labor productivity losses until 1972, becoming positive (productivity gains) after that year and even increased the gains in the following period (1986-96). Portugal had clear labor productivity losses until 1972, gains in the period between 1973 and 1985, and losses again in the last period. This did not prevent Portugal from growing at high rates until 1973. Spain had quite a moderate wage growth rate when compared with labor productivity growth rate during all periods. It may be argued, as Ó Gráda and O’Rourke did, that some inefficient institutions and labor regulations are behind this immoderate wage growth in Ireland
These data suggest a limited importance of the labor component in Iberian growth and convergence paths (mainly in Portugal), as those countries had converged under labor productivity losses (1961-73 and 1986-96 in Portugal), and diverged under labor productivity gains. These same data suggest a strong relevance of the labor component in Ireland, as this country had diverged under labor productivity losses. This is in line with Dowrick and Nguyen’s study (see Table 4), which points out a labor contribution of more than 40% to differential growth rates (which are negative) in Ireland between 1950 and 60 and more than 120% between 1960 and 70. The labor contribution is less significant in the Iberian countries until 1973 (between 4% and 9% for Portugal and between -5% and 24% for Spain). As the link between convergence and labor growth is strong, it may be argued that Ireland showed divergence until 1985 due to decreasing net labor productivity.
13 See C. Ó Gráda and K. O’Rourke (1996).
Such an influence of the labor component on growth in Dowrick and Nguyen's model may result from two sources: (1) the growth rate of the labor force is negative or (2) response of GDP growth rates to the labor growth rates is high or, in other words, the elasticity of output to labor is high15. We have found some support for this argument in data. In fact, the mean growth rates of labor force and employment between 1960 and 1971 were –0.06% and –0.05% each year (-0.72% and -0.66% over the entire decade) and shares of labor in this decade were near 70%, which is quite a high value for the time. The same variables for Iberian countries show remarkable differences. Employment and labor force increased throughout the decade by nearly 2% for Portugal and 8% for Spain. The share of labor in the national income was near 50% for Portugal and 60% for Spain16.
If we observe Fuente and Vives’ results (see Table 6), it is even more evident that the labor force component was of greater importance in Ireland than in Iberian countries throughout the period. Had human capital been taken into account, the difference would be even more pronounced.
To conclude, immoderate wage growth (when compared to productivity), together with the significant contribution of labor to convergence in Ireland, can be a candidate for an explanation to our puzzle of Ireland’s poor performance during the sixties.
5. Conclusion
Despite the existence that very similar policies (protectionist policies and industrial conditioning between 1930 and 1950, liberalizing and integration policies after 1960), until the 1980s growth rates in Portugal and Spain were high, while in Ireland they were low. This paper cites a wide range of economic history and growth/convergence literature in three peripheral European countries sharing very similar departure points. It allows for some conclusions about the most effective or detrimental economic policies, the main growth sources and the most important sources of convergence between these countries in
15 This is easily seen by observing the equation (4) in the methodological appendix. 16 The figures are from OECD, Economic Outlook.
each period. This leads to some new questions and possible answers about the puzzling fact of slow Irish growth and convergence between 1950 and 1975.
The institutional environment and the market regulations were, indeed, quite different (decentralized labor market negotiations, non-state-owned sector and nominal and real equilibrium in Portugal; centralized labor negotiations, explicit interventionism in industrialization and great external deficits and inflation rates in Spain; labor union freedom and centralized labor negotiations, existence of state-owned enterprises and explicit Keynesian policies in Ireland). Nevertheless, this did not prevent similar growth paths between the two Iberian neighbors and quite different growth paths between these and Ireland.
Regarding growth accounting, our survey suggests that:
• Total Factor Productivity was more important for economic growth in Ireland, while factors accumulation were more important in the Iberian Countries;
• Total Factor Productivity was more important for economic growth in Spain than in Portugal, while Capital accumulation was more important in Portugal than in Spain;
• Convergence effects are essential in explaining the growth paths of these three countries and they are more relevant in high growth periods;
• Factors associated with the new growth theory, such as R&D, Human Capital and Fiscal Policy, are quite important in distinguishing the growth paths between Ireland and the Iberian countries after 1970.
We summarize below the main possible explanations for the puzzle identified, which are indeed good research topics. On one hand the human capital stock, in which Ireland was well-endowed, was strongly dominated by non-technical skills until the late seventies. On the other hand, centralized wage negotiation (which allowed wages to grow to higher levels than productivity)17 together with a significant contribution of the labor component to economic convergence, did not motivate an industry-based growth in Ireland until the late seventies. These two candidate explanations for the puzzle may be summarized arguing that Ireland had a set of institutions, which were not ideal for growth, namely
17 This is also in line with Rodrik (1999), who argues that democracies pay higher wages due to political
schooling and wage negotiation institutions. This may explain the different performances between Ireland and Iberian countries prior to 1970.
Methodological Notes
We provide here details on the methodological approaches followed to generate the empirical results presented in the text. For details on sources and data we refer to the literature.
1
General Growth AccountingThe standard procedure for growth accounting starts with the neoclassical production function
Y = F (A, K, L) (1)
where A is the level of technology, K is the capital stock and L is the quantity of labor. As is well known, the growth rate of output can be partitioned into components associated with factor accumulation and technological progress. Differentiation of equation (1) with respect to time yields, after division by Y and rearrangement of terms:
· Y Y = g + µ FKK Y ¶ · K K + µ FLL Y ¶ · L L (2) where g = ¡FAA Y ¢µ· A A 
. If the technology factor appears in a Hicks-neutral
way, so that F (A, K, L) = A eF (K, L), then g = µ·
A A
¶ .
If factors are paid their social marginal products (this is almost always assumed) so that FK = r and FL= w, then (2) can be written as
· Y Y = g + sk · K K + sl · L L ⇔ g = · Y Y − sk · K K − sl · L L (3)
where g is obtained by difference as shown, and the other quantities derive from national accounts.
2
Dowrick and Nguyen (1989) The estimated equation isqi = c + a (I/Q)i + bli− δ ln Yi0+ εi (4)
The decomposition of variations in the growth of trend per capita GDP (q − p) is derived algebraically from (4):
(qi− pi) = −δ(ln Y ) + b(li− pi) + [a(I/Q)i− (1 − b)pi] + εi (5)
where
qi is the average annual rate of growth in trend per capita GDP
I/Qis the average investment ratio Y0 is initial income
l is employment growth rate pis the population growth rate
δ is the regression estimate of the coefficient on initial income b is the regression estimate of the coefficient on employment a is the regression estimate of the coefficient on investment rate
The Þrst three terms on the right hand side of (5) are the contributions to variations in GDP growth rates from catch-up, employment deepening and capital deepening, respectively.
3
Fuente (1995)The undelying production function is
Y = ΦKα(AL)1−α = ΦALZα, with Z = K/AL and Φ = Zµ. (6)
A is an index of labor augmenting technical progress and K denotes a broad capital aggregate. The growth rate of A, ga, is an increasing function
of the proportion of GDP spent in R&D. This is the R&D mechanism in the model. Adding human capital to the model (with coefficient β in the
production function and the same rate of depreciation as physical capital) and letting sk and sh denote the rates of investment on physical and human
capital, respectively, the convergence equation (which was also the estimated equation) can be written as
qit = gx+ λx0+ λgxt− λqit+ λ(α + µ) 1− α − µ − βln skit n + gx+ δ + + λβ 1− α − µ − β ln shit n + gx+ δ + λγθi− gx ε £ 1 + (n− 1)e−ε¤+(7) +λ [(x0− al0) + (al0 − ai0)] (η− 1)e −εt where
qit is the growth rate of output per worker in country i at time t
sk is the rate of investment in physical capital
sh is the rate of investment in human capital
θ is R&D expenditure
(x0−ai0)is the initial gap with respect to best practice technology, where
(x0−al0)is the gap between the leader and the technological frontier.
This assumes some values in the estimation. An assumed value of 0 means that the technological leader is at the technological frontier.
(al0− ai0) is the gap with respect to the leader
λmeasures the speed of convergence of income per efficiency unit of labor towards its steady-state value
η is the speed of technological diffusion (catch-up)
gx is the technological growth rate at the technological frontier. It is
exogenous and constant by deÞnition.
4
Fuente and Vives (1997)The underlying production function is now more complex:
Yit = ΘγKitαkH αh it R
αr
it (AitLit)1−αk−αh−αr (8)
The crucial differences between (6) and (8) are the terms Θ and R, which correspond to the explicit introduction of endogenous R&D and Þscal policy
as production factors in this setting. The Þrst factor was already considered in the last setting but in a seemingly different way. The latter was only now introduced.
The convergence equation that derives from (8) is the following:
qit = gx+ β(ait− y0) + λ 1− αk− αh− αr · · · αkln skit δ + gx+ n + αhln shit δ + gx+ n + αrln srit δ + gx+ n ¸ + (9) +γ(θ·it+ (δ + gx+ n)θit)
This convergence equation is almost equal to (7), except for the simpler speciÞcation of the convergence and catch-up processes, which correspond to the terms βy0and βait, respectively. As the authors explain, if technology
diffuses across countries at a sufficiently rapid pace, those economies which are technically less advanced at the beginning of the period should grow faster than the rest. This effect, however, will gradually exhaust itself as each country approaches an equilibrium level of relative technical efficiency. To try to capture this effect, they have included a dummy for initially back-ward countries (Spain, Ireland, Greece and Japan) and the product of this variable by a trend. As the authors work with data on income per capita rather than output per worker, they include in the equation the increase in unemployment (DU) and labor force participation rates (GTAC), as changes in these variables would affect income per capita with a constant level of output per employed worker.
Thus the estimated equation was:
qit = gx+ c1t + c2t2+ c3DLAG5 + c4(DLAG5)t + caGT ACit+ cuDUit −βy0+ λ 1− αk− αh− αr · (10) · · αkln skit δ + gx+ n + αhln shit δ + gx+ n + αrln srit δ + gx+ n ¸ + +γ(θ·it+ (δ + gx+ n)θit) 27
The Þrst elements in the equation (a constant, a trend and a trend squared and the terms which include the dummy DLAG5) try to approximate the term g + βait, which appears in equation (9).
Abbreviations
CEPR – Centre for Economic Policy Research. EEC – European Economic Community. EU – European Union.
FDI – Foreign Direct Investment.
GATT – General Agreement on Tariffs and Trade. GDP – Gross Domestic Product.
NBER – National Bureau of Economic Research.
OECD – Organization for Economic Cooperation and Development. R&D – Research and Development.
UNESCO – United Nations Educational, Scientific and Cultural Organization. UN – United Nations.
References
ALDCROFT, D. (1987), From Versailles to Wall Street, 1919-1929, Penguin Books, London.
AMARAL, L. (1996), “Crises and restructuring in Portugal and Spain: 1973 to the 1993”, Economic Crises and Restructuring in History: experiences of small countries, St.Katharinen.
ANDRÉS et al. (1993), “Growth, Convergence and Macroeconomic Performance in OECD Countries: A Closer Look”, Documento de Trabajo D-93003, May, Dirección General de Planificación, Secretaria de Estado de Hacienda, Madrid.
BARRO, R. and X. SALA-I-MARTIN (1992), “Convergence”, Journal of Political Economy, vol. 100, pp.223-51.
BENHABIB, J. and M. SPIEGEL (1994), “The role of human capital in economic development: Evidence from aggregate cross-section data”, Journal of Monetary Economics, October, Vol. 34, number 2, pp.143-173. BRANA, J. et al. (1984), El Estado y el Cambio Tecnológico en la Industrialización tardia – Un análisis del caso español, Fondo de Cultura Económica, Madrid.
CÉSAR DAS NEVES, J. (1994), The Portuguese Economy: a Picture in Figures, Universidade Católica Portuguesa, Lisboa.
CÉSAR DAS NEVES, J. (1996), “Portuguese Postwar Growth: a global approach” in Crafts and Toniolo (eds) Economic Growth in Europe since 1945, Cambridge University Press, Cambridge, pp. 329-353.
CONFRARIA, J. (1992), Condicionamento Industrial, uma análise económica, Direcção Geral da Industria Lisboa.
CRAFTS, N. and G. TONIOLO (1996), “Postwar Growth: an overview” in Crafts and Toniolo (eds) Economic Growth in Europe since 1945, Cambridge University Press, Cambridge, pp. 1-37.
DE LONG, J. B. and L. SUMMERS (1991), “Equipment Investment and Economic Growth”, The Quarterly Journal of Economics, Vol. CVI, pp.445-502.
DELGADO, J. (1987), “La Industrialización y el Desarollo Económico de España durante el Franquismo”, in Jordi Nadal, Albert Carreras e Carles Sudrià (Eds), La Economia Española del siglo XX – Una Perspectiva Histórica, pp.164-185.
DOWRICK, S. and D. NGUYEN (1989), “OECD Economic Growth 1950-85: Catch-up and Convergence”, The American Economic Review, Vol. 79, number 5, pp. 1010-1030.
EICHENGREEN, B. (1996), “Institutions and Economic Growth: Europe after World War II”, in Crafts and Toniolo (eds) Economic Growth in Europe since 1945, Cambridge University Press, Cambridge, pp.39-72. FEINSTEIN, C., P. TEMIN and G. TONIOLO (1997), The European Economy between the Wars, Oxford University Press.
FREITAS, M. (2000), “Quantidade versus qualidade: a contabilidade do crescimento na Irlanda”, Boletim Económico, Banco de Portugal, March (2000).
FUENTE, A. (1995), “Catch-up, Growth and Convergence in the OECD”, CEPR Discussion Paper nº 1274. FUENTE, A. and X. VIVES (1997), “The Sources of Irish Growth”, CEPR Discussion Paper nº 1756.
GÖRG, H and E. STROBL (2000), “Multinational Companies and the Development of Firm Start-up Size: Evidence from quantile regressions for Ireland”, CEPR Research network on Foreign Direct investment and the Multinational Organization: New Theories and Evidences.
HARRISON, J. (1978), An Economic History of Modern Spain, Manchester University Press, Manchester. KINDLEBERGER, C. (1973), The World in Depression, 1929-39, Penguin Books, London.
LAINS, P. (1994), “O Estado e a Industrialização em Portugal, 1945-1990”, De onde vem a Economia Portuguesa - Análise Social, 128, pp. 923-958.
LEDDIN, A. and B. WALSH (1998), The Macro-economy of Ireland, 4th Edition, Mcmillan, Dublin. MADDISON (1995), Monitoring The World Economy 1820-1992, Development Centre Studies, OCDE. MADDISON (2000), Monitoring The World Economy 1820-1998, Apendix A, Development Centre Studies, OCDE.
MARQUES, A. (1988), Política Económica e desenvolvimento em Portugal – 1926-1959, Livros Horizonte, Lisboa.
MATEUS, A. (1998), Economia Portuguesa – Crescimento no Contexto Internacional, Editorial Verbo, Lisboa.
MERIGO, E. (1982), “Spain”, The European Economy – Growth and Crisis, Andrea Botho (Eds.), Oxford University Press, New York, pp. 555-580.
Ó GRÁDA, C. and K. O’ROURKE (1996), “Irish Economic Growth, 1945-88” in Crafts and Toniolo (eds), Economic Growth in Europe since 1945, Cambridge University Press, Cambridge, pp. 388-425.
OCDE (1994), National Accounts, 1964-1992. OCDE, Labour Force Statistics, 1959-70; 1974-94.
PATRIARCA, F. (1994), “A regulamentação do trabalho nos primeiros anos do regime corporativo”, De onde vem a Economia Portuguesa - Análise Social, 128, pp. 801-839.
PRADOS DE LA ESCOSURA; L. and C. SANZ, (1996), “Growth and Macroeconomic performance in Spain, 1939-93” in Economic Growth in Europe since 1945, Crafts and Toniolo, eds, Cambridge University Press, Cambridge, pp.355-387.
RODRICK, Dani (1999), “Democracies pay higher wages”, The Quarterly Journal of Economics, CXIV, issue 3, pp. 707-738.
ROMER, D. (1996), Advanced Macroeconomics, MacGraw-Hill, London.
ROSAS, F. (1990), Portugal entre a Paz e a Guerra 1939 – 1945, Editorial Estampa, Lisboa. THE ECONOMIST (1997), “Europe’s Tiger Economy: Green is Good”, May 17th.
TONIOLO, G. (1998), “Europe’s golden age: speculations from a long-run perspective”, The Economic History Review, LI, number 2, pp. 252-267.
UNESCO, Yearbooks, various years.
VALÉRIO, N. (1982), As Finanças Públicas Portuguesas entre as duas guerras mundiais, Lisboa.
WALSH, B. (1993), “The contribution of human capital formation to post-war economic growth in Ireland”, CEPR Discussion Paper nº 819.