CERN-EP-2017-112 2017/10/10
CMS-TOP-14-008
Measurement of the semileptonic tt
+
γ
production cross
section in pp collisions at
√
s
=
8 TeV
The CMS Collaboration
∗Abstract
A measurement of the cross section for top quark-antiquark (tt) pairs produced in
association with a photon in proton-proton collisions at √s = 8 TeV is presented.
The analysis uses data collected with the CMS detector at the LHC, corresponding
to an integrated luminosity of 19.7 fb−1. The signal is defined as the production of
a tt pair in association with a photon having a transverse energy larger than 25 GeV and an absolute pseudorapidity smaller than 1.44. The measurement is performed in the fiducial phase space corresponding to the semileptonic decay chain of the tt pair, and the cross section is measured relative to the inclusive tt pair production cross section. The fiducial cross section for associated tt pair and photon production
is found to be 127±27(stat+syst)fb per semileptonic final state. The measured value
is in agreement with the theoretical prediction.
Published in the Journal of High Energy Physics as doi:10.1007/JHEP10(2017)006.
c
2017 CERN for the benefit of the CMS Collaboration. CC-BY-3.0 license
∗See Appendix A for the list of collaboration members
1
Introduction
As the heaviest elementary particle in the standard model (SM), the top quark has the potential to provide insights into physics beyond the SM (BSM). Many BSM models introduce changes within the top quark sector [1, 2], which can be constrained by precise measurements of the cross sections and properties of top quark production channels [3]. By measuring the associ-ated production cross section of a top quark-antiquark pair and a photon (tt+γ), the coupling of the top quark and the photon is probed [4, 5]. Any deviation of the measured cross section value from the SM prediction would be an indication of BSM physics, such as the production of
an exotic quark with electric charge of−4/3, or a top quark with an anomalous electric dipole
moment [6, 7].
As the top quark predominantly decays to a W boson and a b quark, the tt+γ production can be identified by the presence of a photon candidate and the decay products of a pair of top quarks, namely two jets from the hadronization of two b quarks, and the decay products of a pair of W bosons. In this analysis, events are selected in which one W boson decays leptonically, resulting in an electron or muon and a corresponding neutrino ν, and the other W boson decays hadronically. Examples of two Feynman diagrams for the tt+γ process in the semileptonic final states are shown in Fig. 1. In the signal definition we include possible contributions from
W → τντ, where the τ lepton decays further into an electron or a muon. The presence of a
charged lepton from the W boson decay significantly improves the power to reject dominant backgrounds from multijet processes and allows for efficient triggering of signal events using single-lepton triggers.
Measurements of the production cross section of tt+γ have been performed by the CDF
Col-laboration at the Tevatron using pp collisions at√s =1.96 TeV [8], and by the ATLAS
Collabo-ration at the LHC using pp collisions at√s =7 TeV [9] and√s = 8 TeV [10]. These results are
in agreement with the SM predictions within uncertainties [11].
In this paper, the measurement of the tt+γ production cross section in pp collisions at √s =
8 TeV is presented. The analysis is based on a data sample corresponding to an integrated
lu-minosity of 19.7 fb−1, recorded with the CMS detector in 2012. The measurement of the tt+γ
production cross section in the semileptonic decay channel is performed relative to the tt pro-duction cross section. The tt+γ cross section is measured in a fiducial kinematic region defined by the presence of exactly one charged lepton and corresponding neutrino, at least three jets, and a photon within the selection requirements.
W ¯t t W+ g g ` ¯n` ¯b ¯q0 q b g W ¯t t W+ q ¯q ` ¯n` ¯b ¯q0 q b g
Figure 1: Dominant Feynman diagrams for the tt+γ signal process in the semileptonic final state where the tt pair is produced through gluon-gluon fusion with a photon emitted from one of the top quarks (left), and through quark-antiquark annihilation with a photon emitted from one of the initial partons (right).
2 3 Signal and background modeling
2
The CMS detector
The central feature of the CMS apparatus is a superconducting solenoid of 6 m internal diame-ter, providing a magnetic field of 3.8 T. Within the solenoid volume are a silicon pixel and strip tracker, a lead tungstate crystal electromagnetic calorimeter (ECAL), and a brass and scintillator hadron calorimeter, each composed of a barrel and two endcap sections. Forward calorimeters extend the pseudorapidity η coverage provided by the barrel and endcap detectors. Muons are detected in gas-ionization chambers embedded in the steel flux-return yoke outside the solenoid. In the barrel section of the ECAL, an energy resolution of about 1% is achieved for unconverted or late-converting photons in the tens of GeV energy range, relevant to this
analy-sis. The remaining barrel photons have a resolution of about 1.3% up to|η| =1, rising to about
2.5% at |η| = 1.4. In the endcaps, the resolution of unconverted or late-converting photons
is about 2.5%, while the remaining endcap photons have a resolution between 3 and 4% [12]. A more detailed description of the CMS detector, together with a definition of the coordinate system used and the relevant kinematic variables, can be found in Ref. [13].
3
Signal and background modeling
The signal process produces events in which a pair of top quarks is produced in association with a photon. This process includes photons radiated from the top quarks as well as from initial state partons or the decay products of the top quarks. The simulation of the tt+γ signal
process is performed in the region with photons having transverse momentum (pT) of at least
13 GeV and|η| <3.0, as well as having a separation from all other generated particles of at least
∆R > 0.3, where∆R = √(∆φ)2+ (∆η)2, and∆φ and ∆η are the differences in the azimuthal
angle (in radians) and pseudorapidity, respectively, between the generated particles and the photon. For the purpose of this analysis, nonprompt photons originating from jets are not included in the definition of the tt+γ signal process.
The tt+γ signal process is simulated at leading order (LO) using the MADGRAPH v5.1.3.30
generator [14]. The dominant backgrounds, tt, V+jets, and V+γ (where V = W, Z), are also
simulated using the MADGRAPHgenerator. Single top quark production is simulated at
next-to-leading order (NLO) using thePOWHEGv1.0 r1380 event generator [15–18]. In order to avoid
any overlap between the simulation of the tt+γ signal and the inclusive tt process, events that fall under the tt+γ signal definition are removed from tt simulation. Overlap between V+γ and V+jets simulation is also taken into account by removing events from V+jets samples, which are accounted for in the V+γ simulation. Approximately 1% of events from tt simulation and approximately 3% of V+jets events are removed through this procedure.
The parton showering and hadronization for all simulated samples are handled by PYTHIA
v6.426 [19], with the decays of τ leptons modeled withTAUOLAv27.121.5 [20]. The CTEQ6L1
and CTEQ6M [21] parton distribution functions (PDFs) are used for samples simulated at LO
and NLO, respectively. A top quark mass mt = 172.5 GeV is used in the simulation. The
re-sponse of the full CMS detector is simulated with GEANT4 v9.4 [22, 23], followed by a detailed
trigger simulation and event reconstruction. ThePYTHIA event generator is used to simulate
the presence of additional pp interactions in the same and nearby bunch crossings (“pileup”). Simulated events are reweighted to correct for differences between the number of pileup inter-actions observed from data and the number produced in the simulation.
A cross section of 244.9±1.4 (stat)+6.3
−5.5(syst)±6.4 (lumi) pb is used to normalize the tt
back-ground [24]. The next-to-next-to-leading-order (NNLO) SM prediction is calculated withFEWZ
NLO predictions, calculated withMCFMv6.6 [27]. Values of 553.9 pb for the leptonic decay of the W+gamma process and 159.1 pb for the leptonic decay of the Z+gamma process are used. The single top quark samples are normalized to their approximate NNLO predictions [28, 29].
4
Event reconstruction and selection
The final state of the signal process in the semileptonic decay channel consists of a high-pT
charged lepton, momentum imbalance due to the presence of a neutrino, jets originating from both the b quarks and from the decay of a W boson, and an energetic photon. Events with either
a high-pTelectron or muon are initially selected through a single-lepton trigger. Events in the
e+jets final state must pass a trigger requiring an electron with pT > 27 GeV within |η| < 2.5 and a relative isolation of less than 0.2, where the relative isolation is defined as the sum of the
pT of all particles, excluding the lepton, within a cone around the lepton of∆R= 0.3, divided
by the pTof the lepton. The µ+jets final state requires a single-muon trigger selecting a muon
with pT > 24 GeV within|η| <2.1 and relative isolation less than 0.3 within∆R=0.4. Events are additionally required to have a well reconstructed primary vertex [30], chosen as the one
having the largest sum p2
T of the tracks associated with it.
The particle-flow (PF) algorithm is used to reconstruct individual particles in the event [31]. The PF objects include electrons, muons, charged and neutral hadrons, photons, and an im-balance of the transverse momentum. The following describes the selection of reconstructed objects that are used in the analysis.
Electrons are reconstructed from energy deposits in the ECAL matched to a track from the
tracker [32]. Electrons are required to have pT > 35 GeV and |η| < 2.5. excluding the
tran-sition region between the barrel and endcap of the ECAL, 1.44 < |η| < 1.57. Electrons from
the decay of the top quark are expected to be isolated from other activity in the detector and thus have a requirement that the relative isolation must be less than 0.1. Selected electrons are required to be originating from the primary vertex, and are rejected if identified as likely having originated from a converted photon. Additionally, a multivariate-based identification is applied to reduce the contribution from nonprompt or misidentified electrons. Electrons that fail the above criteria, but pass looser identification requirements (pT >20 GeV,|η| < 2.5, and
a relative isolation less than 0.2 within a cone of size∆R = 0.3) are considered to be “loose”
electrons. The presence of loose electrons can then be used to reject events from the dilepton final state.
Muons are reconstructed based on measurements from both the tracker and muon systems.
Selected muons are required to have pT > 26 GeV and |η| < 2.1. A requirement on relative
isolation less than 0.2 within a cone of∆R=0.4 is applied. Loose muons are defined as failing
the tight requirements but passing a selection in which the pT threshold is lowered to 10 GeV
and|η| <2.5, with the same requirement on the relative isolation as the tight selection.
Jets are reconstructed from PF candidates clustered using the anti-kTalgorithm with a distance
parameter of 0.5 [33, 34]. Jets must have pT > 30 GeV and |η| < 2.4. To remove the
contribu-tion to the jet energy from pileup interaccontribu-tion, charged hadrons candidates associated with other vertices are not included in the clustering, and an offset correction to the energy is applied for the contribution of neutral hadrons that would fall within the jet area. Additionally, correc-tions for the jet energy scale and resolution are applied in simulation, to account for imperfect measurements of the energy of the jet in the detector [35].
com-4 5 Analysis strategy
bined secondary vertex algorithm, which combines secondary vertex and track-based lifetime information to provide a discriminant between jets originating from the fragmentation of b quarks and light quarks or gluons. The b tagging algorithm has an efficiency of approximately 70%, while having a probability of incorrectly b tagging a light jet of only 1.4% [36, 37].
Photons are reconstructed as energy deposits in the ECAL that are not matched to track seeds
in the pixel detector [12]. The photon is required to have pT > 25 GeV and |η| < 1.44 (ECAL
barrel). A selection based on the shape of the shower caused by the photon in the ECAL is
applied using the σηηvariable, which measures the lateral spread of energy in the η space [12].
Selected photons are required to have σηη <0.012. This is used to distinguish genuine photons
from hadronic activity that can be reconstructed as a photon, as the latter will tend to produce
a wider energy spread in η, leading to a larger value of σηη. As photons can convert into a pair
of electrons before reaching the calorimeter, photon showers along φ can be larger compared to that of an electron. Thus, the isolation is defined differently for photons than it was for leptons, in order to account for a possible energy leakage along φ. A characteristic photon energy deposition profile, or “footprint”, is used to restrict the area used to calculate isolation of the photon candidate. The charged-hadron isolation variable for photons is defined as the
sum of the pT of all charged hadrons spatially separated from the photon candidate by∆R =
0.3, but not falling within the photon footprint. The charged-hadron isolation is required not to exceed 5 GeV for selected photons, to help distinguish prompt photons from nonprompt photons produced from hadronic activity.
The missing transverse momentum (pmiss
T ) is defined as the magnitude of the vector sum of the
momenta of all reconstructed PF candidates in the event, projected on the plane perpendicular to the beams.
The final event selection is divided in two steps: a preselection designed to select events with the same topology as top quark pairs (referred to as the “top quark selection”), and a “photon selection”. The top quark selection requires:
• exactly one lepton passing the selection requirements (either an electron or muon);
• no other lepton candidates passing loose selection criteria;
• at least 3 jets, with at least one of these jets passing the b tagging requirement; and
• pmissT >20 GeV.
The photon selection requires that events pass the top quark selection and additionally have at least one photon passing the identification and isolation requirements described above.
5
Analysis strategy
After the photon selection is applied, over half of the events in simulation originate from back-ground processes, and not tt+γ production. The two largest backback-grounds are from tt events that have a nonprompt photon coming from jets in the event and from V+γ events. There is not a single variable that can sufficiently discriminate both of these backgrounds from the tt+γ signal. The V+γ background can be differentiated from tt+γ events by attempting to re-construct a top quark in the event. However, tt events are very similar to the signal in this respect. Alternatively, the nonprompt photon from the tt background will tend to be less iso-lated than the photons from the tt+γ signal, but the photon isolation variable does not have discrimination power to distinguish the V+γ background from tt+γ events. In order to be able to distinguish both tt and V+γ background events, both of these methods are used and the results are combined to measure the tt+γ yield observed in data.
The fraction of events passing the photon selection containing top quark pairs, referred to as the “top quark purity”, can be measured by reconstructing the hadronically decaying top quark
in the event. The M3variable, defined as the invariant mass of the three-jet combination that
gives the highest vector sum of individual jet transverse momenta, is used for this purpose.
Section 7 describes the fit to the distribution of the M3variable, used to distinguish top quark
pair events from other backgrounds.
Section 8 describes the measurement of the “photon purity”, defined as the fraction of recon-structed photons in the selection region, which come from genuine, isolated photons as op-posed to misidentified photons originating from jets. A fit to the photon isolation is used to measure this quantity, which can discriminate between the genuine photons expected from signal and the nonprompt photons from the tt background.
The fits for extracting the top quark and photon purity are performed sequentially, and then the values are used in a likelihood function, from which a fit is performed to extract the number of events that originate from the tt+γ signal process. The likelihood fit and extraction of the number of tt+γ events are described in Section 9.
6
Multijet and Z+jets background estimation
The quantum chromodynamics (QCD) multijet process is not adequately modeled by simu-lation, so a data-based approach is applied to measure the shape and normalization of this background component. The shape of the QCD multijet background is taken from a sideband region in data. The sideband region is defined by inverting the lepton relative isolation re-quirement, selecting leptons with a relative isolation greater than 0.25. Additionally, in the e+jets final state the requirement on the multivariate-based electron identification is inverted, selecting electrons that would typically be identified as misidentified or nonprompt. This con-trol region is dominated by QCD multijet events, with only minor contributions from other processes such as tt and W+jets. The small contribution in the control region from other pro-cesses is subtracted using simulation to provide shapes of the variable distributions used in the analysis.
The normalization of the QCD multijet background is measured through a binned maximum-likelihood fit to the pmiss
T distribution after the standard top quark selection is applied. The
distribution of pmiss
T is softer in the QCD multijet background than the other processes
consid-ered, and thus provides some discriminating power for this background. For the purposes of
the fit, the selection requirement on pmiss
T is removed, in order to improve the discriminating
power of the fit by bringing in more multijet events into the fit region. Two distributions are used in the fit, one for the multijet background and one for the contribution from all other processes. The distribution for the multijet background is taken from the shape found in the sideband control region, while the second distribution is taken from the sum of all simulated events (which does not include the QCD background component). The fit is performed sep-arately in the e+jets and µ+jets final states, and the results are used to scale the QCD multijet background distributions later in the analysis.
The normalization and modeling of the Z+jets background distribution is taken from simula-tion, but the normalization is corrected by applying a scale factor derived from a fit to data. In order to check the normalization, the selection is modified, selecting same-flavor dilepton events, while keeping all other top quark selection requirements in place. A binned maximum-likelihood fit is performed to the dilepton invariant mass for events passing this modified se-lection. The fit is performed using two normalized distributions (templates) from simulation,
6 7 Estimate of top quark pair production
a Z+jets template and a background template, which predominantly contains tt events. Scale factors for the normalization of the Z+jets background are derived from the fit and applied to the simulation.
7
Estimate of top quark pair production
The number of events containing top quark pairs, both after the top quark selection and for events passing the photon selection, are extracted through a binned maximum-likelihood fit
to the distribution of the M3 variable. In events with semileptonic decays of the top quark
pair, the M3variable provides a simple reconstruction of the hadronically decaying top quark,
and has a distribution peaking at the mass of the top quark. Other processes have a wider M3
distribution.
Two separate fits are performed to the M3 distribution. The first fit is performed after the top
quark selection, to extract the total number of tt events passing the selection, Ntt. The second fit
is performed for events passing the photon selection in order to measure the top quark purity. 7.1 Measurement of the tt yield
The fit to the M3distribution for events passing the top quark selection is used to extract the
total number of top quark pairs, used for measuring the tt component of the cross section ratio. The fit uses three templates: associated to top quark events (taken from tt and tt+γ simulation), W+jets, and other background processes. The template for the other background processes is a combination of the data-based QCD multijet background and all other simulated samples. In the fit, the normalizations of the top quark and W+jets templates are allowed to float, while the normalizations of the other backgrounds templates are kept fixed. The QCD
multijet background is normalized to the fit to the pmiss
T distribution, while other simulated
samples are scaled to their theoretical cross sections. From the fit, 162168±1565 (stat) and
219128±1869 (stat) tt events are observed in the e+jets and µ+jets final states, respectively,
consistent with the expected total number of tt events. The fit results are used to scale the normalization of the tt and W+jets contributions in the rest of the analysis.
7.2 Measurement of the top quark purity
After the photon selection, a fit to the M3distribution is used to measure the top quark purity.
The fit uses three templates: associated to top quark events, W+γ events, and the sum of all other processes. In the fit, the normalizations of the top quark and W+γ templates are var-ied, while the templates of all other processes remain fixed. The top quark template contains
simulated events for both tt+γ and tt samples. Figure 2 shows the normalized M3
distribu-tions for tt+γ, tt, W+γ, and other background processes. The backgrounds from non-top quark processes have a wider distribution in this variable, while the tt+γ and tt processes peak near the top quark mass with a tail caused by events with an incorrect assignment of the jets. The relative contributions of the tt+γ and tt samples to the top quark template are computed from the expected yields from simulation, though this does not change the shape of the top quark template as the two distributions are compatible. After the photon selection is applied, the
distribution of the M3variable in many of the background processes begins to suffer from
fluc-tuations caused by the limited number of simulated events. Because the photon selection does
not change the shape of the M3distribution, the problem is solved by taking the shapes for the
non-tt processes from the events after the top quark selection, while retaining the normalization of the samples observed after the photon selection is applied.
(GeV) 3 M 100 200 300 400 500 600 Normalized events 0 0.02 0.04 0.06 0.08 0.1 0.12 0.14 0.16 0.18 0.2 (8 TeV) -1 19.7 fb CMS Simulation +jets µ e/ γ + t t t t γ W+ Other backgrounds
Figure 2: Normalized distributions of the M3variable for tt+γ, tt, W+γ, and other background
processes in a combination of the e+jets and µ+jets final state after the photon selection.
Events / 40 GeV 100 200 300 400 500 600 Data γ + t t +jets t t Single t γ W/Z+ W/Z+jets Multijet Uncertainty (GeV) 3 M 100 200 300 400 500 600 Data/Sim. 0.5 1 1.5 (8 TeV) -1 19.7 fb CMS +jets µ e/
Figure 3: Distribution of the M3variable in data and simulation, scaled to the result of the fit in
a combination of the e+jets and µ+jets channels, for events passing the photon selection. The lower panel shows the ratio of the data to the prediction from simulation. The uncertainty band is a combination of statistical and systematic uncertainties in the simulation.
Figure 3 shows the distribution of the M3 variable in data and simulation, scaled to the result
of the fit. From the fit result, the top quark purity is measured to be 0.70±0.08 (stat) and
0.68±0.06 (stat) in the e+jets and µ+jets channels, respectively. These are consistent with the
expected values from simulation of 0.70±0.03 (stat) in the e+jets final state and 0.72±0.02 (stat)
in the µ+jets final state, where the uncertainties are due to the limited number of simulated events.
8
Photon purity measurement
Events are sorted into one of three categories based on the origin of their reconstructed pho-tons. Genuine photons are those which are promptly produced, originating from nonhadronic sources. Misidentified photons can come from misreconstructed electrons, for which the track
8 8 Photon purity measurement
from the electron is not correctly reconstructed or properly matched to the energy cluster in the calorimeter, causing the electron to be reconstructed as a photon. Quark or gluon fragmen-tation and hadronization processes can be misidentified as photons or yield genuine photons, which for both cases are expected to be nonisolated, in contrast with promptly produced pho-tons. The tt+γ signal events predominantly fall within the first category while the latter two categories are mostly composed of background events.
Simulated events can be placed in one of these three categories based on matching between the reconstructed and generated photons. Matching is performed based on the difference between
the reconstructed photon and the generated particles in both pT and the η-φ phase space. If
a reconstructed photon is matched to a generated photon from a nonhadronic source, it is classified in the first category. Reconstructed photons that are not matched to a generated photon but instead are matched to a generated electron are classified as misidentified electrons, and placed in the second category. All other events, which are not matched to either a generated photon or electron, are considered to be nonprompt photons originating from hadronic activity and placed in the third category.
Photons in the last category, which are produced from hadronic activity, are typically less iso-lated than genuine photons or misidentified electrons. This difference in the isolation distri-bution is used to measure the photon purity, defined as the fraction of events with a photon originating from an isolated source (including both genuine photons and misidentified elec-trons). A binned maximum-likelihood fit to the distribution of the charged-hadron isolation is used to measure the photon purity.
Templates for the shape of the charged-hadron isolation for isolated photons (coming from either genuine photons or misidentified electrons) and nonprompt (nonisolated) photons are taken from data. The shape of the charged-hadron isolation for the isolated photon template is obtained using the random cone isolation method [38]. In this method, the sum of the
trans-verse energy of PF charged-hadron candidates is measured within a cone of size∆R = 0.3 at
the same η value as the reconstructed photon, but in a random φ direction. Contributions to the isolation sum from charged hadrons coming from pileup interactions are subtracted from the energy in the cone. This gives an estimate of the isolation of a completely isolated particle. The shape of the charged-hadron isolation for nonprompt photon events is taken from a sideband
region. The charged-hadron isolation of events with a photon having σηη between 0.012 and
0.016 is used to construct the template for nonisolated photons. These events typically have nonprompt, hadronically produced photons. Comparisons of the distributions of the charged-hadron isolation templates for isolated and nonprompt photons extracted from the data-based method and the templates taken from simulation using the generated particle matching are shown in Fig. 4.
In order to reduce the statistical fluctuations in the background template, the selection require-ment of the photon charged-hadron isolation being less than 5 GeV is relaxed during the fit. Instead, the fit is performed in the range of charged-hadron isolation less than 20 GeV, with all other photon selection requirements still in place. The distribution suffers from lower statisti-cal precision at higher values of the isolation, so the distribution is rebinned with larger bins for higher isolation values and finer binning for lower values where the statistical precision is better. Figure 5 shows the result of the fit of the photon charged-hadron isolation in a combi-nation of the e+jets and µ+jets final state. The photon purity is measured based on the fraction of events coming from isolated sources after the charged-hadron isolation requirement is put
back in place. The photon purity is measured to be 0.57±0.06 (stat) and 0.53±0.06 (stat) in the
simula-Normalized events 5 − 10 4 − 10 3 − 10 2 − 10 1 − 10 1 Random cone Simulation isolated
Photon charged-hadron isolation (GeV)
0 1 2 3 4 5 6 7 8 9 10 Data/Sim. 0.51 1.5 (8 TeV) -1 19.7 fb CMS +jets µ e/ Normalized events 4 − 10 3 − 10 2 − 10 1 − 10 1 sideband η η σ Simulation nonprompt
Photon charged-hadron isolation (GeV)
0 2 4 6 8 10 12 14 16 18 20 Data/Sim. 0.51 1.5 (8 TeV) -1 19.7 fb CMS +jets µ e/
Figure 4: Shapes of isolated (left) and nonprompt (right) photon templates of the photon charged-hadron isolation, comparing templates derived from data to the distributions found from simulation in a combination of the e+jets and µ+jets final states. The lower panel shows the ratio of the distributions derived from data to those found from simulation.
Events 200 400 600 800 1000 1200 1400 1600 1800 2000 Data Isolated photons Nonprompt photons Uncertainty
Photon charged-hadron isolation (GeV)
0 2 4 6 8 10 12 14 16 18 20 Data/Fit 0.5 1 1.5 (8 TeV) -1 19.7 fb CMS +jets µ e/ (8 TeV) -1 19.7 fb CMS +jets µ e/
Figure 5: Result of the fit to the photon charged-hadron isolation in a combination of the e+jets and µ+jets final states. The uncertainty band shows the statistical uncertainties in the templates derived from data. The lower panel shows the ratio of the distribution observed in data to the sum of the templates scaled to the fit result.
tion, assuming the SM prediction for tt+γ production, is 0.58±0.03 in the e+jets final state and
0.57±0.02 in the µ+jets final state.
In order to correct the rate of misidentified electrons in simulation, the Z → e+e−process is
used to measure events in which one of the electrons from the Z boson decay is misidentified as a photon. If the photon originates from a misidentified electron from the Z boson decay, the invariant mass of the combination of the electron and photon in the event will be near the Z boson mass.
Under the nominal event selection described previously, the contribution from Z boson pro-duction is highly suppressed and does not provide a large enough sample of events to measure the electron misidentification rate accurately. In order to improve the statistical precision, the event selection is modified by relaxing the requirement of having a b-tagged jet in the event,
while keeping all other requirements the same. This enhances the contribution of Z → e+e−
events. All steps for the multijet estimation and M3fit are repeated for this new selection.
pro-10 9 Top pair plus photon yield measurement )(GeV) γ M(e, Events / 10 GeV 100 200 300 400 500 600 ) (GeV) γ M(e, 20 40 60 80 100 120 140 160 180 Data/Fit 0.5 1 1.5 (8 TeV) -1 19.7 fb CMS e+jets Data Sum ) γ → ee (e → Z Background
Figure 6: Result of the fit to the invariant mass of the electron and photon for events passing the modified event selection with the b tagging requirement relaxed. Distributions are shown
scaled to the results of the fit for Z → ee (e → γ) and all other simulated samples (dashed
lines), as well as the sum of the two samples (solid line). The lower panel shows the ratio of the data to the simulation scaled to the fit results.
nounced in the eγ invariant mass distribution. This allows a template fit to be performed, in order to estimate how well the misidentification of an electron as a photon is modeled in simulation. The fit to the eγ invariant mass is performed using two templates, both derived from simulation. The first template consists of events with Z bosons in which the reconstructed photon is matched to one of the electrons from the Z boson decay at the generator level. The second template consists of all other simulated samples not included in the previous template and the data-based multijet sample. The result of the fit is shown in Fig. 6. A scale factor of
1.46±0.20 (stat) is found for simulated events with a misidentified electron. This scale
fac-tor is applied to all simulated events in which the photon is identified as originating from a misidentified electron.
9
The tt
+
γ yield measurement
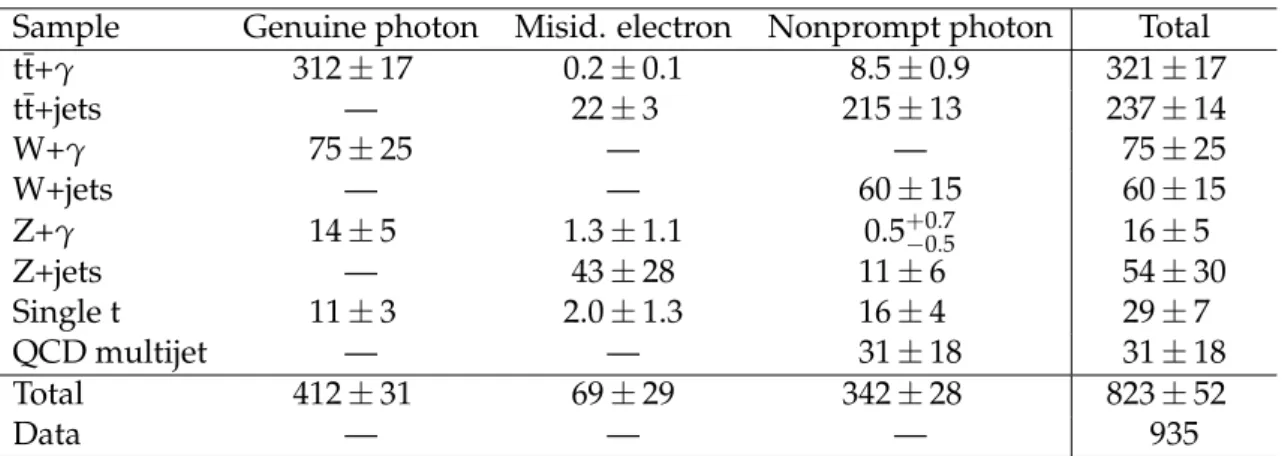
Table 1: Simulated samples categorized by reconstructed photon origin, after photon selection in the e+jets channel. The data-based multijet sample is not expected to have signal photons or electrons. All uncertainties combine statistical and systematic contributions.
Sample Genuine photon Misid. electron Nonprompt photon Total
tt+γ 312±17 0.2±0.1 8.5±0.9 321±17 tt+jets — 22±3 215±13 237±14 W+γ 75±25 — — 75±25 W+jets — — 60±15 60±15 Z+γ 14±5 1.3±1.1 0.5+0.7 −0.5 16±5 Z+jets — 43±28 11±6 54±30 Single t 11±3 2.0±1.3 16±4 29±7 QCD multijet — — 31±18 31±18 Total 412±31 69±29 342±28 823±52 Data — — — 935
As previously mentioned, reconstructed photons originate from either a genuine photon, a misidentified electron, or a jet that produces a nonprompt photon. Different processes con-tribute to each of these three categories in different ways. For example, the tt+γ and V+γ
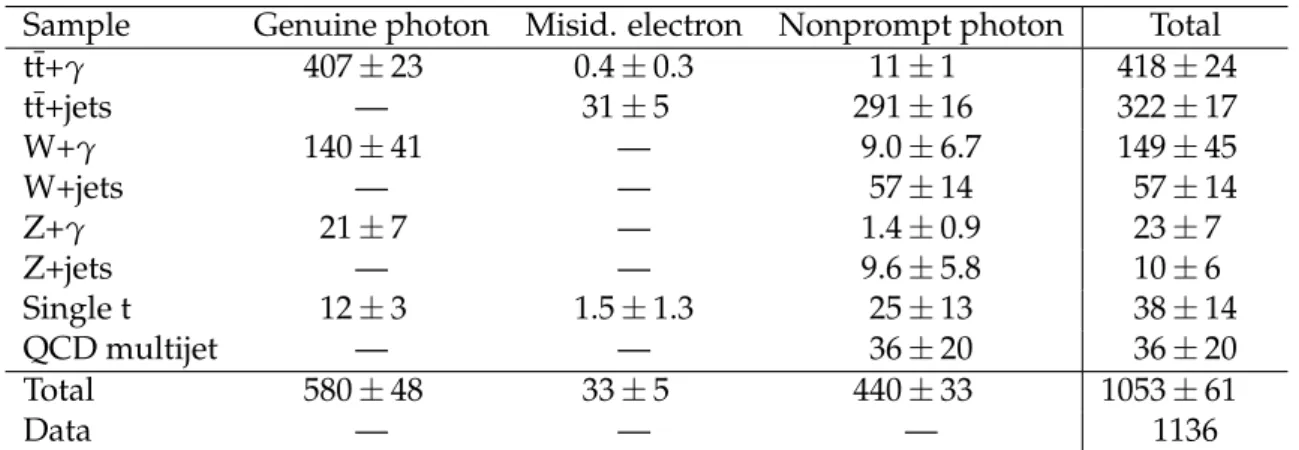
pro-Table 2: Simulated samples categorized by reconstructed photon origin, after photon selection in the µ+jets channel. The data-based multijet sample is not expected to have signal photons or electrons. All uncertainties combine statistical and systematic contributions.
Sample Genuine photon Misid. electron Nonprompt photon Total
tt+γ 407±23 0.4±0.3 11±1 418±24 tt+jets — 31±5 291±16 322±17 W+γ 140±41 — 9.0±6.7 149±45 W+jets — — 57±14 57±14 Z+γ 21±7 — 1.4±0.9 23±7 Z+jets — — 9.6±5.8 10±6 Single t 12±3 1.5±1.3 25±13 38±14 QCD multijet — — 36±20 36±20 Total 580±48 33±5 440±33 1053±61 Data — — — 1136
cesses predominantly produce genuine photons, while the tt and V+jets processes contribute to the nonprompt-photon or misidentified-electrons categories. The breakdown of the number of events in the three reconstructed photon categories from each of the different simulated pro-cesses as well as the total number of expected and observed events are shown in Tables 1 and 2 for the e+jets and µ+jets final states, respectively.
The modeling of misidentified electrons has been corrected using the scale factor described in Section 8, but the modeling of nonprompt photons from jets remains uncorrected. The normal-ization of the tt+jets, W+jets, Z+jets, and QCD samples have been cross-checked and corrected as described previously in Sections 6 and 7. The contribution from single top quark processes is expected to be small and accurately modeled, and is left normalized to the theoretical cross sections. This leaves three major contributing sources, which have so far not been constrained and for which scale factors still need to be measured: tt+γ, V+γ, and photons originating from jets.
The three remaining scale factors, the scale factor on tt+γ simulation (SFtt+γ), on V+γ
simu-lation (SFV+γ), and on simulation of photons originating from jets (SFjet→γ), are derived by
defining a likelihood function based on the three previously measured quantities: the photon purity, πdata
eγ ; top quark purity, πttdata; and the number of events in data after the photon
selec-tion, Ndata. The likelihood function is defined asL(SF
tt+γ, SFV+γ, SFjet→γ) =e−χ 2/2
where χ2is
the sum of three terms:
χ2(SFtt+γ, SFV+γ, SFjet→γ) =
(πdataeγ −πMCeγ )2
σπ2eγ +(π data tt −πttMC)2 σπ2tt + (N data−NMC)2 σN2 , (1) where πMC
eγ , πttMC, and NMCare the photon purity, top quark purity, and the number of events
expected from simulation, and σπeγσπtt, and σNare the statistical uncertainties in the measured quantities. The value of the photon purity from simulation is taken to be the fraction of events in which the reconstructed photon originates from either a genuine photon or a misidentified electron. Similarly, the top quark purity in simulation is found as the fraction of the total simu-lated events coming from either the tt or tt+γ processes. Because these three values depend on the relative contribution of events from the different processes, they are functions of the three scale factors, SFtt+γ, SFV+γ, and SFjet→γ. For example, the photon purity would be increased for
larger values of SFtt+γor SFV+γwhereas SFjet→γwould increase the number of nonprompt
pho-tons and have the inverse effect on the photon purity. Similarly the top quark purity would be
12 10 Calculation of the cross section ratio
photons), whereas SFV+γ has the inverse effect. The likelihood fit is performed by scanning
over the possible combinations of the three scale factors to find the one that results in values of
πMCeγ , πMCtt , and NMC, which most closely match the values observed in data, and thus returns
the maximum likelihood value.
The likelihood fit is performed in the e+jets and µ+jets final states individually, as well as in a combination of the two channels. The combination is performed by maximizing the product of the likelihood functions from the e+jets and µ+jets final states.
The scale factors obtained in the likelihood fit are applied to the simulation to extract the
num-ber of tt+γ events observed, Ntt+γ. All tt+γ events are scaled by SFtt+γ, and those which fall
within the nonprompt-photon category are additionally scaled by SFjet→γ. Applying the results
of the fit in a combination of the e+jets and µ+jets final states, 780±119 (stat) tt+γ events are
observed, 338±53 (stat) events and 442±69 (stat) events in the e+jets and µ+jets final states,
re-spectively. The uncertainty comes predominantly from the statistical uncertainty in the results of the likelihood fit.
10
Calculation of the cross section ratio
The fiducial tt+γ cross section (σfid.
tt+γ) and the inclusive tt+γ cross section (σtt+γ) can be calcu-lated based on the equations:
σtt+γfid. = Ntt+γ ett+γL, σtt+γ = Ntt+γ Att+γett+γL = σtt+γfid. Att+γ, (2)
where Ntt+γis the number of tt+γ events observed, Att+γis the acceptance of tt+γ events within
the fiducial phase space, ett+γ is the efficiency of the tt+γ selection within events in the
accep-tance region, and L is the integrated luminosity of the data set.
The acceptance is determined at generator level, by requiring generated events to fall within the fiducial phase space defined for the analysis. Events are required to have exactly one generated
prompt lepton in the fiducial phase space. For electrons, this requires pT > 35 GeV and|η| <
2.5 while not falling in the region 1.44 < |η| < 1.56. The visible phase space for muons is
defined as pT > 26 GeV and |η| < 2.5. Events are required to have at least three generated
jets with pT > 30 GeV and |η| < 2.4. In order to replicate the pmissT requirement, the vector
sum of the pTof generated neutrinos is required to be greater than 20 GeV. Lastly, events are
required to have a generated photon with pT > 25 GeV and |η| < 1.44. The acceptance can
be split into two components: the one coming from the branching fraction of tt+γ to the e+jets or µ+jets channels, and the one coming from the kinematic phase space requirements. The kinematic acceptance is measured by the number of events passing the kinematic phase space requirements described above divided by the number of events generated in the e+jets and
µ+jets final states.
The efficiency is calculated as the ratio of reconstructed events that pass the event selection over the number of events generated in the fiducial phase space. This accounts for the migration of events into and out of the fiducial phase space, and includes the efficiencies of the trigger requirement, object identification and reconstruction, and the event selection. The measured values for the acceptance and efficiency of the tt+γ selection in the e+jets and µ+jets channels are given in Table 3.
In order to reduce the effect of systematic uncertainties that similarly affect all tt+jets tion modes, the ratio of the cross section of fiducial tt+γ production to the inclusive tt
produc-Table 3: Kinematic acceptance and efficiency of the tt+γ selection in the e+jets and µ+jets final states.
e+jets µ+jets
Kinematic acceptance 0.2380±0.0014 0.2551±0.0014
Efficiency 0.1198±0.0071 0.1268±0.0070
tion cross section is calculated as
R= σ fid tt+γ σtt = Ntt+γ ett+γ etttopAtttop Ntt , (3)
where Ntt is the number of tt events passing the top quark selection, and ett
top and Atttop are
the efficiency and acceptance of top quark selection for tt events. The value of ett
topAtttop is determined from simulation to be 0.034 in the e+jets final state and 0.046 in the µ+jets final state with negligible statistical uncertainties.
11
Sources of systematic uncertainty
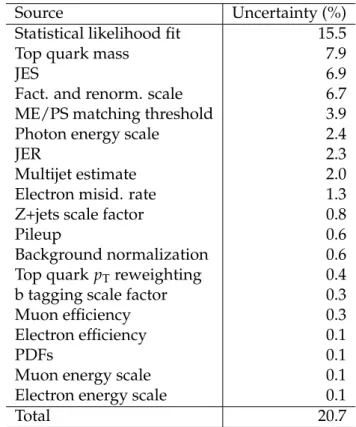
The effects of the systematic uncertainties are estimated by varying the simulated samples ac-cording to the uncertainty and repeating the measurement. The top quark purity measurement, photon purity measurement, and likelihood fit are repeated for each source of systematic un-certainty and the new value of the cross section ratio is compared to the nominal value. In this way, an estimate of the effect each source of systematic uncertainty has on the final result is found. Table 4 lists the uncertainties in decreasing order of their effect on the cross section ratio, as found through the combination of the e+jets and µ+jets final states.
The statistical uncertainty in the number of signal events found after maximizing the likelihood fit described in Section 9, dominates the determination of the cross section for tt+γ. It includes the uncertainties in the measurement of the photon purity, top quark purity after photon selec-tion, and the statistical uncertainty from the observed number of events in data. The contribu-tion from each of these three porcontribu-tions is estimated individually by performing the likelihood fit in which the uncertainties in these parameters are set to zero one at a time. This effectively
fixes the value to the measured value. The change in the SFtt+γ uncertainty (which is roughly
14% in the standard likelihood fit) can be attributed to the fixed parameter. The uncertainty is dominated by the top quark purity and photon purity uncertainties, which contribute 10% and 9%, respectively. The statistical uncertainty caused by the limited number of events in data is approximately 4.8%.
The uncertainties in the energy of reconstructed objects in the event are taken into account by scaling the energies of reconstructed objects in simulation up and down by the uncertainties in their corrections. The uncertainties in the jet energy scale (JES) and jet energy resolution (JER) [35] are applied to the reconstructed jets and the effect is propagated to the calculation of pmiss
T . Similarly the uncertainty due to the photon energy is found by scaling the energy
of reconstructed photons up and down by 1%, and the measurement is repeated [12]. The
uncertainty due to the lepton energy scale is found by varying the pT of the electrons and
muons in the event by 1% in the e+jets and µ+jets final states, respectively [32, 39].
A 50% uncertainty is assigned to the normalization of the data-based multijet sample derived from the fit to the pmiss
T distributions. Additionally, a 20% normalization uncertainty is applied
14 12 Results
Section 7). The systematic uncertainty due to the scale factor for Z+jets simulation (described in Section 6) is applied by adjusting the scale factor up and down by its uncertainty.
The uncertainty in the efficiency of the b tagging algorithm is taken into account by varying the b tagging scale factors up and down by their uncertainties [37]. Differences between the
distribution of the pT of the top quarks in data and simulation are taken into account by
ap-plying a reweighting based on the pT of the generated top quarks and treating the difference
from the nominal sample as a systematic uncertainty (“top quark pT reweighting”) [40]. The
uncertainty in the pileup correction is found by recalculating the pileup distribution in data with a plus and minus 5% change to the total inelastic proton-proton cross section [41], and using these new distributions to reweight the simulation.
The uncertainty in the factorization and renormalization scales is taken into account by sim-ulating the tt+γ and tt+jets processes with the scales doubled and halved compared to the
nominal value of µF = µR = Q = √m2t +Σp2T (where the sum is taken over all final state
partons). The uncertainty in the matching of partons at ME level to the parton shower (PS) is found by simulating tt+γ and tt+jets processes with the threshold used for matching doubled and halved from the nominal value of 20 GeV. The uncertainty arising from the choice of the
top quark mass used in simulation is measured by simulating the samples with a value of mt
varied up and down by 1 GeV from its central value of mt=172.5 GeV.
Table 4: Uncertainties in the cross section ratio R for the combination of the e+jets and µ+jets final states.
Source Uncertainty (%)
Statistical likelihood fit 15.5
Top quark mass 7.9
JES 6.9
Fact. and renorm. scale 6.7
ME/PS matching threshold 3.9
Photon energy scale 2.4
JER 2.3
Multijet estimate 2.0
Electron misid. rate 1.3
Z+jets scale factor 0.8
Pileup 0.6
Background normalization 0.6
Top quark pTreweighting 0.4
b tagging scale factor 0.3
Muon efficiency 0.3
Electron efficiency 0.1
PDFs 0.1
Muon energy scale 0.1
Electron energy scale 0.1
Total 20.7
12
Results
The ratio of the fiducial cross section of tt+γ to tt production is found to be R = (5.7±1.8)×
10−4(stat+syst)in the e+jets final state and R = (4.7±1.3)×10−4(stat+syst)in the µ+jets final state. The value of the fiducial tt+γ cross section can be extracted from the cross section ratio
using the measured tt cross section of 244.9±1.4 (stat)+6.3
−5.5(syst)±6.4 (lumi) pb [24]. Multiply-ing the cross section ratio by the measured tt cross section results in values for the tt+γ fiducial
cross section of 138±45(stat+syst)fb in the e+jets final state and 115±32(stat+syst)fb in the
µ+jets final state.
The value of the cross section times the branching fraction in the lepton+jets final states can be extrapolated from the fiducial cross section by dividing by the kinematic acceptance. The
kinematic acceptances (as given in Section 10) are found to be 0.2380±0.0014 and 0.2551±
0.0014 in the e+jets and µ+jets final states. This gives a cross section times branching fraction
of σtt+γB =582±187 fb in the e+jets final state and 453±124 fb in the µ+jets final state. These
values are in agreement with theoretical prediction of 592±71(scales)±30(PDFs)fb for the
cross section times branching fraction of each of the semileptonic final states [42].
The combination of the e+jets and µ+jets channels results in a cross section ratio per semilep-tonic final state of(5.2±1.1)×10−4(stat+syst). This results in a value of 127±27(stat+syst)fb for the fiducial tt+γ cross section. When extrapolated to the cross section times branching
frac-tion by dividing by the kinematic acceptance, the result is σtt+γB =515±108 fb per lepton+jets
final state, in good agreement with the theoretical prediction. Table 5 summarizes the measured ratios and cross sections for the e+jets and µ+jets final states as well as the combination. Table 5: Cross section ratios, as well as fiducial and total cross sections per semileptonic final state. Category R σtt+γfid (fb) σtt+γB(fb) e+jets (5.7±1.8)×10−4 138±45 582±187 µ+jets (4.7±1.3)×10−4 115±32 453±124 Combination (5.2±1.1)×10−4 127±27 515±108 Theory — — 592±71(scales)±30(PDFs)
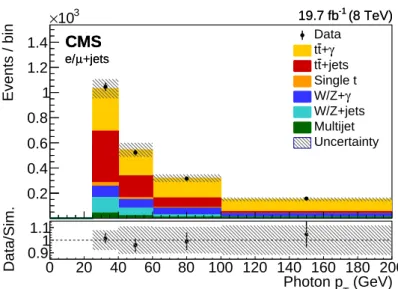
The distributions of the transverse momentum and absolute value of the pseudorapidity of the photon candidate are shown in Figs. 7 and 8, scaled to the results of the likelihood fit. While the statistical precision of this analysis currently limits the ability to perform a differential measurement of the tt+γ cross section, there is the potential to measure the differential cross section in the future in both of these variables.
13
Summary
The results of a measurement of the production of a top quark-antiquark (tt) pair produced in
association with a photon have been presented. The measurement is performed using 19.7 fb−1
of data collected by the CMS detector at a center-of-mass energy of 8 TeV. The analysis has been performed in the semileptonic e+jets and µ+jets decay channels.
The ratio of the tt+γ to tt production cross sections has been measured to be R = σtt+γ/σtt =
(5.2±1.1)×10−4. By multiplying the measured ratio by the previously measured value of the
tt cross section, the fiducial cross section for tt+γ production of 127±27 fb has been found for
events in the e+jets and µ+jets final states. The measured values are in agreement with the theoretical predictions.
16 13 Summary Events / bin 0.2 0.4 0.6 0.8 1 1.2 1.4 3 10 × Data γ + t t +jets t t Single t γ W/Z+ W/Z+jets Multijet Uncertainty (GeV) T Photon p 0 20 40 60 80 100 120 140 160 180 200 Data/Sim. 0.9 1 1.1 (8 TeV) -1 19.7 fb CMS +jets µ e/ (8 TeV) -1 19.7 fb CMS +jets µ e/
Figure 7: Distribution of the transverse momentum of the photon in data and simulation, scaled to the result of the likelihood fit in a combination of the e+jets and µ+jets channels for events passing the photon selection. The lower panel shows the ratio of the data to the prediction from simulation. The uncertainty band is a combination of statistical and systematic uncertainties in the simulation. Events / bin 100 200 300 400 500 600 Data γ + t t +jets t t Single t γ W/Z+ W/Z+jets Multijet Uncertainty | η Photon | 0 0.2 0.4 0.6 0.8 1 1.2 1.4 Data/Sim. 0.8 1 1.2 (8 TeV) -1 19.7 fb CMS +jets µ e/ (8 TeV) -1 19.7 fb CMS +jets µ e/ (8 TeV) -1 19.7 fb CMS +jets µ e/
Figure 8: Distribution of the absolute value of the pseudorapidity of the photon in data and simulation, scaled to the result of the likelihood fit in a combination of the e+jets and µ+jets channels for events passing the photon selection. The lower panel shows the ratio of the data to the prediction from simulation. The uncertainty band is a combination of statistical and systematic uncertainties in the simulation.
Acknowledgments
We congratulate our colleagues in the CERN accelerator departments for the excellent perfor-mance of the LHC and thank the technical and administrative staffs at CERN and at other CMS institutes for their contributions to the success of the CMS effort. In addition, we grate-fully acknowledge the computing centres and personnel of the Worldwide LHC Computing Grid for delivering so effectively the computing infrastructure essential to our analyses. Fi-nally, we acknowledge the enduring support for the construction and operation of the LHC and the CMS detector provided by the following funding agencies: BMWFW and FWF (Aus-tria); FNRS and FWO (Belgium); CNPq, CAPES, FAPERJ, and FAPESP (Brazil); MES (Bulgaria); CERN; CAS, MoST, and NSFC (China); COLCIENCIAS (Colombia); MSES and CSF (Croatia); RPF (Cyprus); SENESCYT (Ecuador); MoER, ERC IUT, and ERDF (Estonia); Academy of Fin-land, MEC, and HIP (Finland); CEA and CNRS/IN2P3 (France); BMBF, DFG, and HGF (Ger-many); GSRT (Greece); OTKA and NIH (Hungary); DAE and DST (India); IPM (Iran); SFI (Ireland); INFN (Italy); MSIP and NRF (Republic of Korea); LAS (Lithuania); MOE and UM (Malaysia); BUAP, CINVESTAV, CONACYT, LNS, SEP, and UASLP-FAI (Mexico); MBIE (New Zealand); PAEC (Pakistan); MSHE and NSC (Poland); FCT (Portugal); JINR (Dubna); MON, RosAtom, RAS, RFBR and RAEP (Russia); MESTD (Serbia); SEIDI, CPAN, PCTI and FEDER (Spain); Swiss Funding Agencies (Switzerland); MST (Taipei); ThEPCenter, IPST, STAR, and NSTDA (Thailand); TUBITAK and TAEK (Turkey); NASU and SFFR (Ukraine); STFC (United Kingdom); DOE and NSF (USA).
Individuals have received support from the Marie-Curie programme and the European Re-search Council and Horizon 2020 Grant, contract No. 675440 (European Union); the Leventis Foundation; the A. P. Sloan Foundation; the Alexander von Humboldt Foundation; the Belgian Federal Science Policy Office; the Fonds pour la Formation `a la Recherche dans l’Industrie et dans l’Agriculture (FRIA-Belgium); the Agentschap voor Innovatie door Wetenschap en Tech-nologie (IWT-Belgium); the Ministry of Education, Youth and Sports (MEYS) of the Czech Republic; the Council of Science and Industrial Research, India; the HOMING PLUS pro-gramme of the Foundation for Polish Science, cofinanced from European Union, Regional Development Fund, the Mobility Plus programme of the Ministry of Science and Higher Ed-ucation, the National Science Center (Poland), contracts Harmonia 2014/14/M/ST2/00428, Opus 2014/13/B/ST2/02543, 2014/15/B/ST2/03998, and 2015/19/B/ST2/02861, Sonata-bis 2012/07/E/ST2/01406; the National Priorities Research Program by Qatar National Research Fund; the Programa Clar´ın-COFUND del Principado de Asturias; the Thalis and Aristeia pro-grammes cofinanced by EU-ESF and the Greek NSRF; the Rachadapisek Sompot Fund for Post-doctoral Fellowship, Chulalongkorn University and the Chulalongkorn Academic into Its 2nd Century Project Advancement Project (Thailand); and the Welch Foundation, contract C-1845.
References
[1] T. Han, “The ’Top Priority’ at the LHC”, Int. J. Mod. Phys. A 23 (2008) 4107,
doi:10.1142/S0217751X08042705, arXiv:0804.3178.
[2] W. Bernreuther, “Top quark physics at the LHC”, J. Phys. G 35 (2008) 083001,
doi:10.1088/0954-3899/35/8/083001, arXiv:0805.1333.
[3] A. Buckley et al., “Constraining top quark effective theory in the LHC Run II era”, JHEP
18 References
[4] U. Baur, A. Juste, L. H. Orr, and D. Rainwater, “Probing electroweak top quark couplings at hadron colliders”, Phys. Rev. D 71 (2005) 054013,
doi:10.1103/PhysRevD.71.054013.
[5] A. O. Bouzas and F. Larios, “Electromagnetic dipole moments of the top quark”, Phys.
Rev. D 87(2013) 074015, doi:10.1103/PhysRevD.87.074015.
[6] O. Bessidskaia Bylund et al., “Probing top quark neutral couplings in the Standard Model Effective Field Theory at NLO in QCD”, JHEP 05 (2016) 052,
doi:10.1007/JHEP05(2016)052, arXiv:1601.08193.
[7] M. Schulze and Y. Soreq, “Pinning down electroweak dipole operators of the top quark”,
Eur. Phys. J. C 76(2016) 466, doi:10.1140/epjc/s10052-016-4263-x,
arXiv:1603.08911.
[8] CDF Collaboration, “Evidence for t¯tγ production and measurement of σt¯tγ/σt¯t”, Phys.
Rev. D 48(2011) 031104, doi:10.1103/PhysRevD.84.031104, arXiv:1106.3970.
[9] ATLAS Collaboration, “Observation of top-quark pair production in association with a
photon and measurement of the ttγ production cross section in pp collisions at√s =7
TeV using the ATLAS detector”, Phys. Rev. D 91 (2015) 072007, doi:10.1103/PhysRevD.91.072007, arXiv:1502.00586.
[10] ATLAS Collaboration, “Measurement of the t¯tγ production cross section in
proton-proton collisions at√s=8 TeV with the ATLAS detector”, (2017).
arXiv:1706.03046. Submitted to JHEP.
[11] P.-F. Duan et al., “QCD corrections to associated production of ttγ at hadron colliders”,
Phys. Rev. D 80(2009) 014022, doi:10.1103/PhysRevD.80.014022,
arXiv:0907.1324.
[12] CMS Collaboration, “Performance of photon reconstruction and identification with the
CMS detector in proton-proton collisions at√s=8 TeV”, JINST 10 (2015) P08010,
doi:10.1088/1748-0221/10/08/P08010, arXiv:1502.02702.
[13] CMS Collaboration, “The CMS experiment at the CERN LHC”, JINST 3 (2008) S08004,
doi:10.1088/1748-0221/3/08/S08004.
[14] J. Alwall et al., “The automated computation of tree-level and next-to-leading order differential cross sections, and their matching to parton shower simulations”, JHEP 07 (2014) 079, doi:10.1007/JHEP07(2014)079, arXiv:1405.0301.
[15] S. Frixione, P. Nason, and C. Oleari, “Matching NLO QCD computations with parton shower simulations: the POWHEG method”, JHEP 11 (2007) 070,
doi:10.1088/1126-6708/2007/11/070, arXiv:0709.2092.
[16] S. Alioli, P. Nason, C. Oleari, and E. Re, “A general framework for implementing NLO calculations in shower Monte Carlo programs: the POWHEG BOX”, JHEP 06 (2010) 043,
doi:10.1007/JHEP06(2010)043, arXiv:1002.2581.
[17] E. Re, “Single-top Wt-channel production matched with parton showers using the POWHEG method”, Eur. Phys. J. C 71 (2011) 1547,
[18] S. Alioli, P. Nason, C. Oleari, and E. Re, “NLO single-top production matched with shower in POWHEG: s- and t-channel contributions”, JHEP 09 (2009) 111,
doi:10.1088/1126-6708/2009/09/111, arXiv:0907.4076. [Erratum:
doi:10.1007/JHEP02(2010)011].
[19] T. Sj¨ostrand, S. Mrenna, and P. Skands, “PYTHIA 6.4 physics and manual”, JHEP 05 (2006) 026, doi:10.1088/1126-6708/2006/05/026, arXiv:hep-ph/0603175. [20] Z. Wa¸s, “Precision simulations with TAUOLA and PHOTOS”, Nucl. Phys. Proc. Suppl.
169(2007) 16, doi:10.1016/j.nuclphysbps.2007.02.113,
arXiv:hep-ph/0610386.
[21] P. M. Nadolsky et al., “Implications of CTEQ global analysis for collider observables”,
Phys. Rev. D 78(2008) 013004, doi:10.1103/PhysRevD.78.013004,
arXiv:0802.0007.
[22] GEANT4 Collaboration, “GEANT4—a simulation toolkit”, Nucl. Instrum. Meth. A 506 (2003) 250, doi:10.1016/S0168-9002(03)01368-8.
[23] J. Allison et al., “GEANT4 developments and applications”, IEEE Trans. Nucl. Sci. 53 (2006) 270, doi:10.1109/TNS.2006.869826.
[24] CMS Collaboration, “Measurement of the tt production cross section in the e-µ channel in
proton-proton collisions at√s=7 and 8 TeV”, JHEP 08 (2016) 029,
doi:10.1007/JHEP08(2016)029, arXiv:1603.02303.
[25] K. Melnikov and F. Petriello, “Electroweak gauge boson production at hadron colliders
through O(α2)”, Phys. Rev. D 74 (2006) 114017, doi:10.1103/PhysRevD.74.114017,
arXiv:hep-ph/0609070.
[26] K. Melnikov and F. Petriello, “W boson production cross section at the Large Hadron
Collider with O(α2) corrections”, Phys. Rev. Lett. 96 (2006) 231803,
doi:10.1103/PhysRevLett.96.231803, arXiv:hep-ph/0603182.
[27] J. M. Campbell and R. K. Ellis, “MCFM for the Tevatron and the LHC”, in Proceedings, 10th DESY Workshop on Elementary Particle Theory: Loops and Legs in Quantum Field Theory, volume 205-206, p. 10. Woerlitz, Germany, April, 2010. arXiv:1007.3492. Nucl. Phys. Proc. Suppl. 205-206 (2010) 10. doi:10.1016/j.nuclphysbps.2010.08.011. [28] N. Kidonakis, “Next-to-next-to-leading logarithm resummation for s-channel single top
quark production”, Phys. Rev. D 81 (2010) 054028,
doi:10.1103/PhysRevD.81.054028, arXiv:1001.5034.
[29] N. Kidonakis, “Two-loop soft anomalous dimensions for single top quark associated
production with a W−or H−”, Phys. Rev. D 82 (2010) 054018,
doi:10.1103/PhysRevD.82.054018, arXiv:1005.4451.
[30] CMS Collaboration, “Description and performance of track and primary-vertex reconstruction with the CMS tracker”, JINST 9 (2014) P10009,
doi:10.1088/1748-0221/9/10/P10009, arXiv:1405.6569.
[31] CMS Collaboration, “Particle-flow reconstruction and global event description with the CMS detector”, (2017). arXiv:1706.04965. Submitted to JINST.
20 References
[32] CMS Collaboration, “Performance of electron reconstruction and selection with the CMS
detector in proton-proton collisions at√s=8 TeV”, JINST 10 (2015) P06005,
doi:10.1088/1748-0221/10/06/P06005, arXiv:1502.02701.
[33] M. Cacciari, G. P. Salam, and G. Soyez, “The anti-ktjet clustering algorithm”, JHEP 04
(2008) 063, doi:10.1088/1126-6708/2008/04/063, arXiv:0802.1189.
[34] M. Cacciari, G. P. Salam, and G. Soyez, “FastJet user manual”, Eur. Phys. J. C 72 (2012) 1896, doi:10.1140/epjc/s10052-012-1896-2, arXiv:1111.6097.
[35] CMS Collaboration, “Determination of jet energy calibration and transverse momentum resolution in CMS”, JINST 6 (2011) P11002,
doi:10.1088/1748-0221/6/11/P11002.
[36] CMS Collaboration, “Performance of b tagging at√s=8 TeV in multijet, tt and boosted
topology events”, CMS Physics Analysis Summary CMS-PAS-BTV-13-001, 2013.
[37] CMS Collaboration, “Identification of b-quark jets with the CMS experiment”, JINST 8 (2013) P04013, doi:10.1088/1748-0221/8/04/P04013, arXiv:1211.4462. [38] CMS Collaboration, “Measurement of differential cross sections for the production of a
pair of isolated photons in pp collisions at√s =7 TeV”, Eur. Phys. J. C 74 (2014) 3129,
doi:10.1140/epjc/s10052-014-3129-3, arXiv:1405.7225.
[39] CMS Collaboration, “Performance of CMS muon reconstruction in pp collision events at√
s =7 TeV”, JINST 7 (2012) P10002, doi:10.1088/1748-0221/7/10/P10002,
arXiv:1206.4071.
[40] CMS Collaboration, “Measurement of the differential cross section for top quark pair
production in pp collisions at√s =8 TeV”, Eur. Phys. J. C 75 (2015) 542,
doi:10.1140/epjc/s10052-015-3709-x, arXiv:1505.04480.
[41] CMS Collaboration, “Measurement of the inelastic proton-proton cross section at√s=7
TeV”, Phys. Lett. B 722 (2013) 5, doi:10.1016/j.physletb.2013.03.024, arXiv:1210.6718.
[42] K. Melnikov, M. Schulze, and A. Scharf, “QCD corrections to top quark pair production in association with a photon at hadron colliders”, Phys. Rev. D 83 (2011) 074013,
A
The CMS Collaboration
Yerevan Physics Institute, Yerevan, Armenia A.M. Sirunyan, A. Tumasyan
Institut f ¨ur Hochenergiephysik, Wien, Austria
W. Adam, E. Asilar, T. Bergauer, J. Brandstetter, E. Brondolin, M. Dragicevic, J. Er¨o, M. Flechl,
M. Friedl, R. Fr ¨uhwirth1, V.M. Ghete, C. Hartl, N. H¨ormann, J. Hrubec, M. Jeitler1, A. K¨onig,
I. Kr¨atschmer, D. Liko, T. Matsushita, I. Mikulec, D. Rabady, N. Rad, B. Rahbaran, H. Rohringer, J. Schieck1, J. Strauss, W. Waltenberger, C.-E. Wulz1
Institute for Nuclear Problems, Minsk, Belarus
O. Dvornikov, V. Makarenko, V. Mossolov, J. Suarez Gonzalez, V. Zykunov National Centre for Particle and High Energy Physics, Minsk, Belarus N. Shumeiko
Universiteit Antwerpen, Antwerpen, Belgium
S. Alderweireldt, E.A. De Wolf, X. Janssen, J. Lauwers, M. Van De Klundert, H. Van Haevermaet, P. Van Mechelen, N. Van Remortel, A. Van Spilbeeck
Vrije Universiteit Brussel, Brussel, Belgium
S. Abu Zeid, F. Blekman, J. D’Hondt, N. Daci, I. De Bruyn, K. Deroover, S. Lowette, S. Moortgat, L. Moreels, A. Olbrechts, Q. Python, K. Skovpen, S. Tavernier, W. Van Doninck, P. Van Mulders, I. Van Parijs
Universit´e Libre de Bruxelles, Bruxelles, Belgium
H. Brun, B. Clerbaux, G. De Lentdecker, H. Delannoy, G. Fasanella, L. Favart, R. Goldouzian, A. Grebenyuk, G. Karapostoli, T. Lenzi, A. L´eonard, J. Luetic, T. Maerschalk, A. Marinov, A. Randle-conde, T. Seva, C. Vander Velde, P. Vanlaer, D. Vannerom, R. Yonamine, F. Zenoni,
F. Zhang2
Ghent University, Ghent, Belgium
A. Cimmino, T. Cornelis, D. Dobur, A. Fagot, M. Gul, I. Khvastunov, D. Poyraz, S. Salva, R. Sch¨ofbeck, M. Tytgat, W. Van Driessche, E. Yazgan, N. Zaganidis
Universit´e Catholique de Louvain, Louvain-la-Neuve, Belgium
H. Bakhshiansohi, C. Beluffi3, O. Bondu, S. Brochet, G. Bruno, A. Caudron, S. De Visscher,
C. Delaere, M. Delcourt, B. Francois, A. Giammanco, A. Jafari, M. Komm, G. Krintiras, V. Lemaitre, A. Magitteri, A. Mertens, M. Musich, K. Piotrzkowski, L. Quertenmont, M. Selvaggi, M. Vidal Marono, S. Wertz
Universit´e de Mons, Mons, Belgium N. Beliy
Centro Brasileiro de Pesquisas Fisicas, Rio de Janeiro, Brazil
W.L. Ald´a J ´unior, F.L. Alves, G.A. Alves, L. Brito, C. Hensel, A. Moraes, M.E. Pol, P. Rebello Teles
Universidade do Estado do Rio de Janeiro, Rio de Janeiro, Brazil
E. Belchior Batista Das Chagas, W. Carvalho, J. Chinellato4, A. Cust´odio, E.M. Da Costa,
G.G. Da Silveira5, D. De Jesus Damiao, C. De Oliveira Martins, S. Fonseca De Souza,
L.M. Huertas Guativa, H. Malbouisson, D. Matos Figueiredo, C. Mora Herrera, L. Mundim,
H. Nogima, W.L. Prado Da Silva, A. Santoro, A. Sznajder, E.J. Tonelli Manganote4, F. Torres Da
22 A The CMS Collaboration
Universidade Estadual Paulistaa, Universidade Federal do ABCb, S˜ao Paulo, Brazil
S. Ahujaa, C.A. Bernardesa, S. Dograa, T.R. Fernandez Perez Tomeia, E.M. Gregoresb,
P.G. Mercadanteb, C.S. Moona, S.F. Novaesa, Sandra S. Padulaa, D. Romero Abadb, J.C. Ruiz
Vargasa
Institute for Nuclear Research and Nuclear Energy, Sofia, Bulgaria
A. Aleksandrov, R. Hadjiiska, P. Iaydjiev, M. Rodozov, S. Stoykova, G. Sultanov, M. Vutova University of Sofia, Sofia, Bulgaria
A. Dimitrov, I. Glushkov, L. Litov, B. Pavlov, P. Petkov Beihang University, Beijing, China
W. Fang6
Institute of High Energy Physics, Beijing, China
M. Ahmad, J.G. Bian, G.M. Chen, H.S. Chen, M. Chen, Y. Chen7, T. Cheng, C.H. Jiang,
D. Leggat, Z. Liu, F. Romeo, M. Ruan, S.M. Shaheen, A. Spiezia, J. Tao, C. Wang, Z. Wang, H. Zhang, J. Zhao
State Key Laboratory of Nuclear Physics and Technology, Peking University, Beijing, China Y. Ban, G. Chen, Q. Li, S. Liu, Y. Mao, S.J. Qian, D. Wang, Z. Xu
Universidad de Los Andes, Bogota, Colombia
C. Avila, A. Cabrera, L.F. Chaparro Sierra, C. Florez, J.P. Gomez, C.F. Gonz´alez Hern´andez, J.D. Ruiz Alvarez, J.C. Sanabria
University of Split, Faculty of Electrical Engineering, Mechanical Engineering and Naval Architecture, Split, Croatia
N. Godinovic, D. Lelas, I. Puljak, P.M. Ribeiro Cipriano, T. Sculac University of Split, Faculty of Science, Split, Croatia
Z. Antunovic, M. Kovac
Institute Rudjer Boskovic, Zagreb, Croatia
V. Brigljevic, D. Ferencek, K. Kadija, B. Mesic, T. Susa University of Cyprus, Nicosia, Cyprus
A. Attikis, G. Mavromanolakis, J. Mousa, C. Nicolaou, F. Ptochos, P.A. Razis, H. Rykaczewski, D. Tsiakkouri
Charles University, Prague, Czech Republic M. Finger8, M. Finger Jr.8
Universidad San Francisco de Quito, Quito, Ecuador E. Carrera Jarrin
Academy of Scientific Research and Technology of the Arab Republic of Egypt, Egyptian Network of High Energy Physics, Cairo, Egypt
E. El-khateeb9, S. Elgammal10, A. Mohamed11
National Institute of Chemical Physics and Biophysics, Tallinn, Estonia M. Kadastik, L. Perrini, M. Raidal, A. Tiko, C. Veelken
Department of Physics, University of Helsinki, Helsinki, Finland P. Eerola, J. Pekkanen, M. Voutilainen