ADVERTISING INVESTMENT AS A TOOL FOR
BOOSTING CONSUMPTION: TESTING
GALBRAITH’S HYPOTHESIS FOR SPAIN
Valentín-Alejandro Martínez-Fernándeza
Pablo Castellanosb
Óscar Juanatey-Bogac
a, b, cFaculty of Economics and Business, University of Corunna, Spain.
Article received on 2014/06/17 and approved on 2015/01/26.
ABSTRACT: The recession that most of the world economies have been facing in the
last years has caused a great interest in the study of its macroeconomic effects. In this context, a debate has resurged regarding the advertising investment, as for its potential capacity to impel the consumer spending and to impact positively on the economic recovery. This idea, sustained in the so-called Galbraith’s hypothesis, constitutes the core of this paper, where the main objective is to test that hypothesis by means of an empirical analysis. In this study, we focus on the Spanish case and the data correspond to the period 1976 -2010. A cointegration analysis is carried out, using two different approaches (Engle-Granger test and Gregory-Hansen test, respectively), to determine if there is any relationship between the advertising investment and six macromagnitu-des (GDP, National Income, Consumption, Savings and Fixed Capital Formation), as well as the registered unemployment rate. Based on the results obtained, we conclude that Galbraith’s hypothesis is not fulfilled for the Spanish case.
KEYWORDS: Advertising investment; Galbraith’s hypothesis; macroeconomic
effects; unemployment.
JEL CLASSIFICATION: E20; E21.
Correspondence to Óscar Juanatey-Boga. E-mail: [email protected].
ISSN (Versão Impressa) 1415-9848 http://dx.doi.org/10.1590/141598481836 www.ie.ufrj.br/revista
1. INTRODUCTION
J. K. Galbraith, in his work The New Industrial State (1967), considers the advertising investment1 as an outstanding instrument to raise the global consumption and conse-quently to impact positively on job creation and national income, without forgetting the impact on savings and the Gross Domestic Product (GDP). He conceives the pu-blicity, and more concretely the advertising investment, as a powerful motor, with ma-croeconomic effects, to boost the economic growth. In short, he claims that in case of an increase of the advertising investment this would cause a rise in the global consump-tion and, therefore, it would lead to job creaconsump-tion and an increase in the naconsump-tional income and, consequently, in the standard of living. He reformulated this idea some years later, even with more emphasis, in The Affluent Society (1969) and so he attracted the interest of researchers to testing the so-called “Galbraith’s hypothesis” (Wilder, 1974).
This task has not been exempt of some controversy (Clark, 1988; Drake, 1989; Becker and Murphy, 1993; León, 1996; Belch and Belch, 2004; Etayo and Preciado, 2009) and, after having fallen into oblivion in the last decade, it has resurged nowadays in consequence of the economic crisis that is affecting both the European Union and the USA, which, in the field of scientific research, induces to show a preferential interest in studying the macroeconomic effects and even the use of the advertising investment as a key tool in economic recession periods (Dhalla, 1980 and O’Malley et al., 2011).
The research carried out up to now shows certain heterodoxy as for the type of data used, variables included, implementation of methodologies, analytic systematiza-tion and interpretasystematiza-tion of the different results. This may be the reason why there is not a certain consensus when it comes to validate or to refute the hypothesis formulated by Galbraith (García et al., 2000).
Consequently, there is not a clear answer to the two key questions that, due to their explanatory nature, sustain the confirmation of the aforementioned hypothesis: does advertising investment induce to consumption? Or does consumption generate adver-tising investment? Although it may well be a third question: is there any feedback bet-ween them? And, anyway, is there any direct relationship betbet-ween the advertising in-vestment and the boost of the demand and, hence, the direct increment in consumption? This is the reason why the research and analysis of the macroeconomic effects that may be caused by the advertising investment remain at the present time, because of their consequences, an outstanding objective for the design of public policies of
incen-1 There is a big debate in the literature on the theme of advertising being considered either as spending
or investment. Galbraith considers advertising as an investment, so in the context of this paper we use always “advertising investment” hereinafter.
INVESTIMENTO EM PUBLICIDADE COMO UMA
FERRAMENTA PARA IMPULSAR O CONSUMO.
TESTE DA HIPÓTESE DE GALBRAITH NA
ESPANHA
RESUMO:A recessão que a maioria das economias mundiais suportaram nos
últi-mos anos causou um grande interesse no estudo dos seus efeitos macroeconômicos. Neste contexto, ressurgiu o debate sobre os efeitos do investimento em publicidade, tanto pela sua capacidade potencial para estimular o gasto do consumidor, quanto pelo impacto positivo na recuperação económica. Esta ideia, sustentada na conhecida hipótese de Galbraith, constitui a base deste artigo, cujo objetivo fundamental é testar a citada hipótese por meio de uma análise empírica. Neste estudo, centramo-nos no caso da Espanha usando os dados correspondentes ao período compreendido entre os anos 1976 e 2010. Realizou-se uma análise de cointegração usando duas aproximações (Teste de Engle-Granger e teste de Gregory-Hansen respetivamente), para determinar se existe alguma relação entre investimento de publicidade e seis macro variáveis (PIB, Rendimento Nacional, Procura Interna, Consumo, Poupança e Formação de Capital Fixo), assim como a taxa de desemprego registado. Com os resultados obtidos conclu-ímos que a hipótese de Galbraith não se cumpre no caso da Espanha.
PALAVRAS-CHAVE: Investimento em publicidade; hipótese de Galbraith; efeitos
Subsequent to “Galbraith’s hypothesis”, as Mújika (2004) points out, different stu-dies also concluded that there is some degree of influence between the advertising in-vestment and the increment of global consumption, but without these appreciations could constitute a universal validation. Within those studies we should mention, for their significance: Peel (1975), Wright et al. (1977 apud Norris, 1980), Ashley et al. (1980), Jung and Seldon (1995) and García et al. (2000).
However, other studies refute Galbraith’s formulation (Metzen, 1967; Backman, 1968; Ekelund and Gramm, 1969; Verdon et al., 1969; Mueller, 1971; Schemalensee, 1972; Taylor and Weiserbs, 1972; Ehremberg, 1974; Schmalensee, 1978; Ashley et al., 1980; Norris, 1980; Jacobson and Nicosia, 1981; Sturgess, 1982; Waterson, 1982; Quar-les and Jeffres, 1983; Duffy, 1991; and Chowdhury 1994). All those works agree in that the advertising investment only generates some effect on the consumption – and therefore it has repercussions on the savings and other macroeconomic variables – in some particular cases and so weakly that establishing a direct relationship could be even a rashness. Hence, Galbraith’s hypothesis could be reduced to a mere speculative argument which is lacking the necessary theoretical foundation validated by the em-pirical testing.
Most of the aforementioned research is sustained in methodological developments of causation and cointegration. Of the first ones, one may point out Ashley et al. (1980) and Sturgess and Wilson (1984); and within the second ones, Baghestani (1991), Elliot (2001) and Guo (2003).
This evident controversy shows the enormous complexity of the problem, but this has not involved a decline in the interest of researchers in finding new conclusions by virtue of methodological applications which study the interaction of different macro-economic variables in scenarios that have not been analyzed yet, as it happens in this paper with the delimitation of the scope of the study to the case of Spain.
3. EMPIRICAL ANALYSIS
3.1. SCOPE OF THE STUDY AND VARIABLES USED
In order to test the fulfillment of Galbraith’s hypothesis in the case of Spain, for our analysis we have chosen the period 1976-2010, which begins after General Franco’s Dictatorship, since before that Spanish economy did not move according to market approaches but rather it was a planned and intervened economy that prevented the typical mechanisms of the free market economy from being developed; hence, evidently, the analysis of the hypothesis in that context would make no sense. We consider that the tives for consumption or savings, as well as for the social and cultural incidences that
may happen if the hypothesis in question is validated. In this case, if the advertising investment acts as a lever of the consumption, it would be convenient to establish con-crete policies (e. g., fiscal measures) directed towards boosting that investment. And, evidently, without ignoring the interest that it also offers for the study of commercial communication from the marketing perspective.
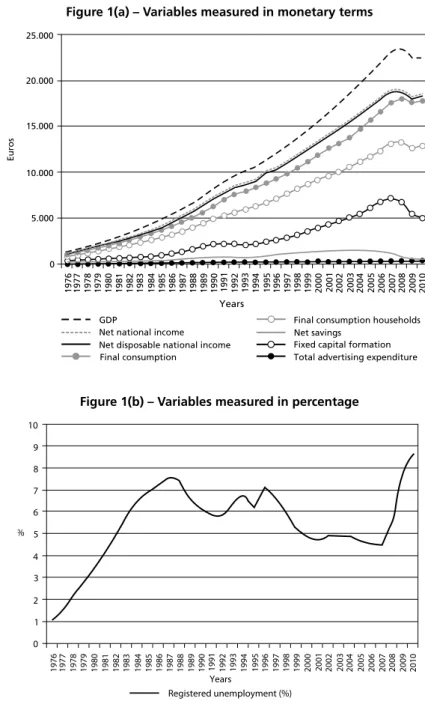
The research reflected by this paper is sustained basically in the methodological formulation which was successfully employed by Chowdhury (1994). It seeks to con-tribute to the verification of the assumptions formulated by Galbraith by means of an empiric development and taking into account harmonized and consolidated data of the advertising investment made in Spain in the period 1976-2010, which constitute a time series that allows to obtain results endowed with the indispensable robustness. The following macroeconomic variables were used: GDP, net national income, net disposable national income, final consumption, final consumption of households, net savings, fixed capital formation, registered unemployment and total advertising in-vestment.
This paper is structured in the following way. First, shortly, we review the antece-dents and most outstanding aspects of the literature that has discussed the fulfillment of Galbraith’s hypothesis. Next, we deal with the empirical analysis of this question, describing both the scope of our study and the variables used, and then we carry out a cointegration analysis. Finally, we show the main conclusions and the bibliography.
2. GENESIS AND STATE OF THE ART
The antecedent to Galbraith’s hypothesis relies, in opinion of Nevett (1996), on the research carried out by Borden (1942), who finds in the period 1919-1940 that the oscillations in the monthly advertising investment experienced a certain delay in re-lation to those registered in a production index that the author had created on his own and all these using data of the USA. That led him to think that the advertising investment showed the capacity to accentuate, to a great or a lesser extent, the eco-nomic fluctuations and, consequently, we could deduce the existence of a certain in-teraction.
Figure 1(a) – Variables measured in monetary terms
1976 1977 1978 1979 1980 1981 1982 1983 1984 1985 1986 1987 1988 1989 1990 1991 1992 1993 1994 1995 1996 1997 1998 1999 2000 2001 2002 2003 2004 2005 2006 2007 2008 2009 2010
0 5.000 10.000 15.000 20.000 25.000
Euros
Net national income GDP
Net disposable national income Final consumption
Final consumption households Net savings
Fixed capital formation Total advertising expenditure Years
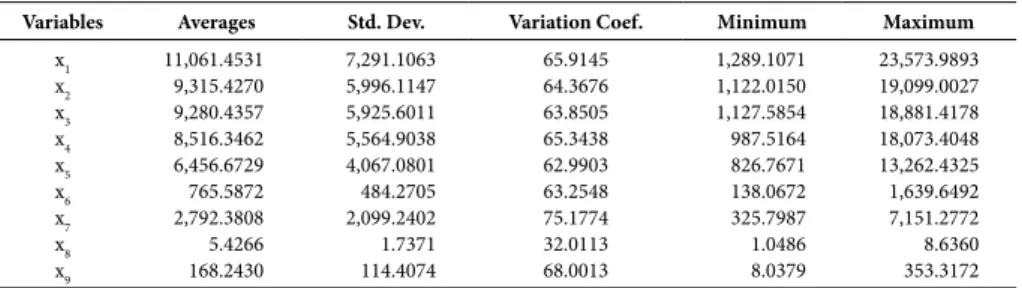
Figure 1(b) – Variables measured in percentage
Registered unemployment (%) 0
1 2 3 4 5 6 7 8 9 10
%
1976 1977 1978 1979 1980 1981 1982 1983 1984 1985 1986 1987 1988 1989 1990 1991 1992 1993 1994 1995 1996 1997 1998 1999 2000 2001 2002 2003 2004 2005 2006 2007 2008 2009 2010
Years
Source: Authors’ elaboration.
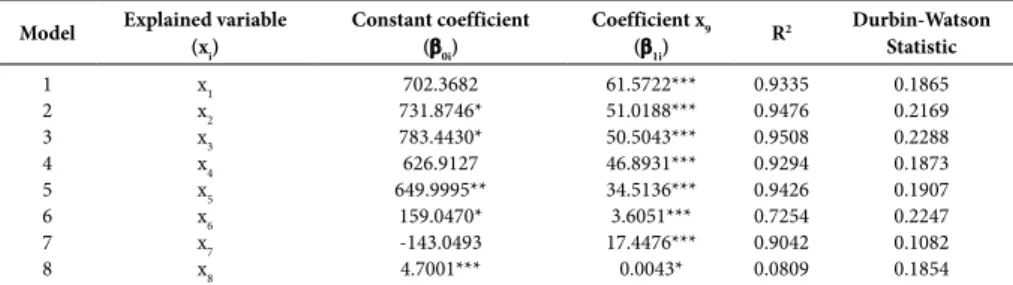
Table 1 shows the main descriptive statistics of all the variables analyzed. period of study is large enough (35 years) to analyze the potential presence of long term
relationships between the variables considered, which are the following: • x1: Gross Domestic Product.
• x2: Net National Income.
• x3: Net Disposable National Income. • x4: Final Consumption.
• x5: Final Consumption of Households. • x6: Net Savings.
• x7: Fixed Capital Formation. • x8: Registered unemployment (%). • x9: Total advertising investment.
In order to eliminate the demographic effect (in the period considered, there was a considerable population increment, growing from 35.89 million people in 1976 to 47.02 millions in 2010), all the former variables, except for the registered unemploy-ment (x8), were quantified in terms of current euros per capita, considering the popu-lation of every year.
As for the sources of our data, for the macromagnitudes (variables x1 to x7, both included) we used the database OECD Statistical Compendium; the data of the unem-ployment (x8) were obtained from the web of the Bank of Spain (www.bde.es); the total advertising investment (x9) stems from the databases of Dupplo and Infoadex, which implied carrying out the pertinent homogenization and harmonization of the data; and, finally, for population data, the web of the National Institute of Statistics was con-sulted (www.ine.es).
Unit root tests will be carried out on the proposed series as a first step and subse-quently the corresponding cointegration analysis will be performed.
However, before performing all those tests, it would be convenient to make a com-ment on the size of our time series. Both unit root tests and cointegration tests perform better with big samples. Our series consists of 35 years, so it seems reasonable to ex-tend the series to a quarterly frequency in order to increase the size over 35. But, re-grettably, this solution faces some important difficulties in practice:
a) Although quarterly data for the macromagnitudes are available, it is impossible to get data on advertising investment at this level: the databases of Dupplo and Infoadex provide only annual data. In our paper we have included all the data available at this time, so it is impossible to increase the number of observations –advertising investment is the series which restricts the time period for all the remaining series.
b) If we had used quarterly data, we would have found seasonality problems: for instance, advertising investment usually increases systematically at the end of every year (due to Christmas season).
c) The power of unit root tests depends much more on the span of the data than on the number of observations, that is, for macroeconomic data, a long span of annual data would be preferred to a shorter span with monthly or quarterly data, even though the latter case may have more observations (Kennedy, 2008). To sum up, we have no alternative but to keep the size in 35 data.
Unit roots tests
In order to establish the order of integration of the variables, we used three classic tests: Augmented Dickey-Fuller, Phillips-Perron and Kwiatkowski-Phillips-Schmidt-Shin tests (hereinafter, ADF, PP and KPSS, respectively).
One of the main drawbacks of the unit root tests is the possibility of not rejecting the non-stationary hypothesis due to the existence of structural breaks or outliers, which if were considered in the analysis could led to the rejection of that hypothesis.
In this sense, Perron (1989) shows that the ADF is sensitive to the presence of structural breaks, so, in case they exist, that test could lead to wrong conclusions.
Different authors (for instance, Perron and Vogelsang, 1992) distinguish two types of breaks according to their effects:
a) Additive outlier model (hereinafter, AO). Each break occurs in an instanta-neous and precise instant.
b) Innovative outlier model (hereinafter, IO). Each break occurs gradually, pro-longing its effect throughout the time.
Table 1 – Descriptive statistics of the variables
Variables Averages Std. Dev. Variation Coef. Minimum Maximum
x1 11,061.4531 7,291.1063 65.9145 1,289.1071 23,573.9893
x2 9,315.4270 5,996.1147 64.3676 1,122.0150 19,099.0027
x3 9,280.4357 5,925.6011 63.8505 1,127.5854 18,881.4178
x4 8,516.3462 5,564.9038 65.3438 987.5164 18,073.4048
x5 6,456.6729 4,067.0801 62.9903 826.7671 13,262.4325
x6 765.5872 484.2705 63.2548 138.0672 1,639.6492
x7 2,792.3808 2,099.2402 75.1774 325.7987 7,151.2772
x8 5.4266 1.7371 32.0113 1.0486 8.6360
x9 168.2430 114.4074 68.0013 8.0379 353.3172
Source: Authors’ elaboration.
It can be observed that there are big differences as for the variability of the different series. This is relatively small (32.01%) in the case of the registered unemployment (x8), about twice as much (62.99% – 65.92%) for a block of six macromagnitudes which reveal a very similar behaviour – Gross Domestic Product (x1), the two measures of National Income (x2 and x3) and Consumption (x4 and x5) and the Net Savings (x6) –, slightly bigger (68.00%) as for the advertising expenditure (x9) and, lastly, very pro-nounced (75.18%) in the case of the Fixed Capital Formation (x7).
Once we have described the main features of the different series, it is time to ana-lyze the possibility of a noticeable structural relationship between the advertising ex-penditure and the other variables considered. To determine this econometrically, we should apply cointegration analysis techniques. Within these techniques, one of the best known is the so-called augmented Engle-Granger test (AEG test), which we carry out in the following section.
3.2. COINTEGRATION ANALYSIS
Cointegration tests aim to prove the existence of a long-term relationship between non-stationary variables with the same integration order (Engle and Granger, 1987; Enders, 2010).
If there is cointegration – i.e., if such variables are not stationary but they have the same order of integration, and the error term of their regression is stationary–, we would prove the existence of a long-term relationship between the previously described macromagnitudes and the advertising investment. Thus, cointegration tests can be considered as a prior test to avoid spurious regressions (Granger, 1986)2.
2 In case of presence of non-stationary variables, the R2 and t statistics cannot be used as usual, since these
GH test requires that all the variables have a single unit root); second, we have to run a regression with up to four possibilities [changes in (i) level, (ii) change in level and trend, (iii) regime and (iv) regime and trend] and check if the test statistics overcome their corresponding critical values of the GH. If so, the null hypothesis of inexistence of a cointegration relationship could be rejected.
Results
In our study, in the first stage, to determine the order of integration of the series, the
ADF, PP, KPSS, PV and CMR tests were used4, considering as a primary rule the
preference for the ADF test when it indicated stationarity and for the structural break tests (particularly the AO) in other case; and as a secondary rule, comparing the results of the PP and KPSS tests to substantiate the valuations.
We concluded that, for a significance level of 5%, all the variables would be I (1), i. e., integrated of order one.
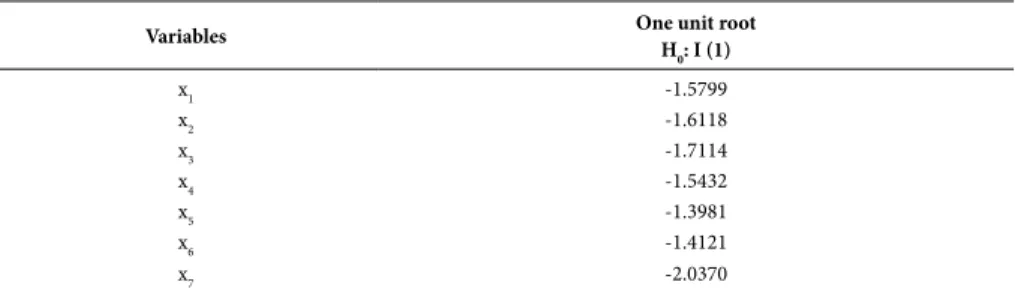
That is to say, as the variable investment in publicity (x9) is I (1), it would only be necessary to analyze the possibility of a cointegration relationship with the rest of vari-ables which are I (1). As this condition is fulfilled by absolutely all the varivari-ables, in the second stage of the method of Engle-Granger, to determine the execution or not of Galbraith’s hypothesis, we estimated, by OLS, the long term models xit = β0i + β1i·x9t +
εit (i = 1, …, 8 and 7; t = 1976, 1977, ..., 2010), where β0i and β1i are parameters and εit
is the error term. The results of the estimates are summarized in Table 2.
Table 2 – Main results of the estimates of the long term models
Model Explained variable
(xi)
Constant coefficient (β0i)
Coefficient x9
(β1i) R
2 Durbin-Watson
Statistic
1 x1 702.3682 61.5722*** 0.9335 0.1865
2 x2 731.8746* 51.0188*** 0.9476 0.2169
3 x3 783.4430* 50.5043*** 0.9508 0.2288
4 x4 626.9127 46.8931*** 0.9294 0.1873
5 x5 649.9995** 34.5136*** 0.9426 0.1907
6 x6 159.0470* 3.6051*** 0.7254 0.2247
7 x7 -143.0493 17.4476*** 0.9042 0.1082
8 x8 4.7001*** 0.0043* 0.0809 0.1854
Notes: (*) Significant at 10%; (**) significant at 5%; (***) significant at 1%. Source: Authors’ elaboration.
4 In the ADF, PV and CMR the number of lags was selected by means of Akaike’s Criterion (AIC); in the
PP and KPSS the bandwith was chosen by means of the Newey-West using Bartlett kernel option. In all the tests we included a constant term. The results for all the unit root tests are shown in Annex I.
Some researchers have criticized the IO because of the persistence of their effects (Kaiser and Maravall, 2001). For this reason, the AO is preferred to the IO.
Furthermore, Glynn et al. (2007) distinguish between two types of models: (i) mo-dels with exogenous breakpoints established by the researcher, and (ii) momo-dels with endogenous breakpoints, determined by quantitative methods.
In this paper, we opted to use a model with endogenous breakpoints, because we thought that its definition has less subjectivity.
The existence of structural breaks in time series makes necessary to use different tests depending on the number of breaks, so the following test will be applied for one break and two breaks respectively: Perron and Vogelsang test (1992) (hereinafter, PV) and Clemente, Montañés and Reyes (1998) test (hereinafter, CMR).
Cointegration
Only those variables that have a unit root can be used in the Engle-Granger and Gre-gory-Hansen cointegration tests.
The Engle-Granger test (EG, hereinafter) will be used for a first cointegration analy-sis without the presence of structural breaks. This analyanaly-sis will be complemented with the Durbin-Watson test3. Potential structural breaks in the variables analyzed and their potential influence on the cointegration relationship of the series will be studied later on.
The EG test (Engle and Granger, 1987) is a two-stage technique based on the resi-duals obtained from a single-equation linear regression model. In the first stage, the in-tegration order of the variables to be included in the model is determined; if the series turn out to be integrated of different order, it is possible to conclude that the variables are not cointegrated. In the second stage, for those variables that – according to the results of the first stage – have the same integration order, the functional long term relationship is specified and estimated, and then it is contrasted if the residuals are or not stationary; if so, a cointegration relationship would exist between the variables; if not, there would not be cointegration, and we would be in the presence of a spurious regression.
The presence of structural breaks in the series could hide existing cointegration relationships among them, so Gregory and Hansen (1996) developed a cointegration model for being used with series with structural breaks. This test (GH, hereinafter) implies two steps: first, we have to determine the integration order of the variables (the
3 Despite the existence of literature showing the use of the Johansen test with series of different sizes, it
To sum up, both the ADF test and the DWRC test applied the residuals lead to conclude that there is not a cointegrating relationship between the advertising invest-ment and the rest of variables selected in our analysis.
In the case of the model with structural breaks, the Gregory-Hansen test results at 5% (see Annex 2) show again that there is no long-term relationship between the investment in publicity and the selected Spanish economy macroeconomic variables.
This way, we can conclude that in accordance with all the results obtained (both by the Engle-Granger and the Gregory-Hansen method), in the case of the Spanish economy, the empirical evidence reveals the non-fulfillment of Galbraith’s hypothesis.
4. CONCLUSIONS
J. K. Galbraith, in his works The New Industrial State (1967) and The Affluent Society (1969), formulated the hypothesis that, at macroeconomic level, the advertising investment could constitute a powerful stimulus for economic growth and job ge-neration.
This hypothesis has raised an abundant literature that has tried to test its fulfillment in practice. About this, a review of the different studies shows that there is not unanimity as for the results observed, although it can be said that the studies that have refuted such a hypothesis are dominant.
After some time in which this hypothesis has been in a second place, the deep re-cession we have been suffering since the end of 2007 has risen again the interest for the study of the macroeconomic effects linked to Galbraith’s postulate. There is a resur-gence of the debate regarding the advertising investment, as for its potential capacity to impel consumption and to impact positively on the recovery.
In this context, this paper seeks to contribute with empirical evidences that help clarify the potential expansive role of the advertising investment, testing the fulfillment of Galbraith’s hypothesis for the case of Spain, which had never been investigated so far. It was carried out an analysis that tested the possible relationship between the advertising investment and six macromagnitudes, as well as the registered unemployment rate, during the period 1976-2010. The results show the non-fulfillment of Galbraith’s hypothesis.
We hope that our paper can prompt other Latin American researchers to analyze the role of advertising in the macroeconomic performance of their countries. This way, we would have more empirical evidence which could help us to know more pre-cisely the completion of Galbraith’s hypothesis.
As one could have already imagined taking into account the information shown in Table 2, it can be observed that in all the cases except for the unemployment (x8)5, the advertising expenditure is statistically very significant, and the goodness of fit is very high. Nevertheless, the value of Durbin-Watson (DW) statistic is very low, which means positive autocorrelation in the errors and possibility of non-cointegration, be-ing verified that R2> DW, fact that accentuates the suspicion that we are in the presence of spurious regressions. To elucidate this question, an ADF test was applied to the re-siduals; its results are shown in Table 3; in this table, all the statistics are not significant (not even at 10%)6, that is to say, the residuals are non-stationary and, consequently, there is not cointegration.
Table 3 - Results of the ADF test applied to the residuals
Variables One unit root
H0: I (1)
x1 -1.5799
x2 -1.6118
x3 -1.7114
x4 -1.5432
x5 -1.3981
x6 -1.4121
x7 -2.0370
Source: Authors’ elaboration.
Alternatively the test ADF applied to the residuals, there is the possibility of apply-ing the test of Durbin-Watson to the cointegration regression (DWRC test)7. In this test, the null hypothesis is H0: DW = 0, the variables are not cointegrated, and the alter-native hypothesis is H1: DW > 0 the variables are cointegrated. In accordance with Gujarati (2003), in this test the critical value for a significance level of 5% is 0.386. If DW statistic does not overcome this value, H0 is not rejected and vice versa.
In our models, all the DW statistics (last column of Table 3) are below 0.386. So we can claim that, at 5% level, we cannot reject that the series are not cointegrated.
5 As the unemployment was not significant at 5%, we shall omit this variable in our analysis hereinafter. 6 The critical values used here for the Engle-Granger cointegration test were: -4.123 (1%), -3.461 (5%) and
-3.130 (10%) [source: Enders (2010, p. 490), two variables, T = 50)].
7 Gujarati (2003, p. 798) points out that: “There is a great debate about the superiority of the DWRC in
ETAYO, C.; PRECIADO, A. “Advertising in Spanish language media”. In: ALBARRAN, A. B.
Handbook of Spanish language media. New York: Taylor and Francis Group, 2009, p.
249-265.
GALBRAITH, J. K. The new industrial state. Boston: Houghton Mifflin, 1967.
GALBRAITH, J. K. The affluent society. Boston: Houghton Mifflin, 1969.
GARCÍA, I.; GIBAJA, J. J.; MÚJIKA, A. Publicidad y macroeconomía: un estudio empírico de la
hipótesis de Galbraith. In: Encuentro de Profesores Universitarios de Marketing, 12, ESIC,
Madrid, 2000.
GLYNN, J.; PERERA, N.; VERMA, R. Unit root tests and structural breaks: A survey with
appli-cations. Revista de Métodos Cuantitativos para la Economía y la Empresa, v. 3, p. 63-79, 2007.
GRANGER, C. W. J. Developments in the study of co-integrated economic variables. Oxford
Bulletin of Economics and Statistics, v. 48, p. 213-228, 1986.
GREGORY, A.W.; HANSEN, B.E. Residual-based tests for cointegration in models with regime
shifts. Journal of Econometrics, n. 70, p. 99-126, 1996.
GUJARATI, D. N. Econometría. México, DF: Ed. McGraw-Hill, 2003.
GUJARATI, D. N.; PORTER, D. Econometría. México, DF: Ed. McGraw-Hill, 2010.
GUO, C. Cointegration analysis of the aggregate advertising-consumption relationship. Journal
of the Academy of Business and Economics, v. 1, n. 2, p. 179-190, 2003.
HANSEN, A. H. Economic issues of the 1960’s. New York: McGraw Hill, 1960.
JACOBSON, R.; NICOSIA, F. M. Advertising and public policy: the macroeconomic effects of
advertising. Journal of Marketing, v. 18, n. 1, p. 29-38, 1981.
JUNG, C.; SELDON, B. J. The macroeconomic relationship between advertising and
consump-tion. Southern Economic Journal, v. 61, n. 3, p. 577-587, 1995.
KAISER, R.; MARAVALL, A. Seasonal outliers in time series. Documento de Trabajo, Servicio
de Estudios del Banco de España, n. 9915, 2001. Available at: <http://www.bde.es>. Acces-sed on Jun. 2016.
KENNEDY, P. A guide to econometrics. Malden: Blackwell Publishing, 2008.
LEÓN, J. L. Los efectos de la publicidad. Barcelona: Ariel, 1996.
METZEN, E. Advertising as a source of information. Freedom of Information in the Market Place.
Columbia, USA: University of Missouri, Freedom of Information Center, 1967.
MUELLER, C. Monopoly with real money. The Washington Monthly, v. 3, p. 36-43, Apr. 1971.
MÚJIKA, A. La publicidad a examen. La medición de la actitud de los ciudadanos ante la
publi-cidad. San Sebastián: Universidad de Deusto, 2004.
NEVETT, T. The economic effects of advertising: Neil Borden revisited. Journal of
Macromarke-ting, n. 16, n. 2, p. 124-133, 1996.
NORRIS, V. P. Toward the institutional study of advertising. Occasional Papers in Advertising,
The American Academy of Advertising, v. 1, n. 1, p 59-73, 1966.
5. REFERENCES
ASHLEY, R.; GRANGER, C. W. J.; SCHMALENSEE, R. Advertising and aggregate
consump-tion: an analysis of causality. Econometrica, v. 48, n. 5, p. 1149-1167, 1980.
BACKMAN, J. Advertising in the 1970’s. Business Horizons, p. 7-15, Apr. 1968
BAGHESTANI, H. Cointegration analysis of the advertising-sales relationship. The Journal of
Industrial Economics, v. 39, v. 6, p. 671-681, 1991.
BECKER, G. S.; MURPHY, K. M. A simple theory of advertising as a good or bad. Quarterly
Journal of Economics, v. 108, v. 4, p. 941-964, 1993.
BELCH, G. E.; BELCH, M. A. Publicidad y Promoción. Perspectiva de la Comunicación de
Ma-rketing Integral. México: McGraw Hill, 2004.
BLANK, D. M. Cyclical behavior of national advertising. Journal of Business, v. 35, n. 1, p. 14-27,
1962.
BORDEN, N. H. The economic effects of advertising. Chicago: Richard D. Irwin, 1942.
CHOWDHURY, A. R. Advertising expenditures and the macro-economy: some new evidence.
International Journal of Advertising, v. 13, n. 1, p. 1-14, 1994.
CLARK, E. The want makers, the world of advertising: how they make you buy. London: Hodder
& Stoughton, 1988.
CLEMENTE, J.; MONTAÑÉS, A.; REYES, M. Testing for a unit root in variables with a double
change in the mean. Economic Letters, n. 59, p. 175-182, 1998.
CONNOR, J. T. Advertising absolutely indispensable. Address before the Cleveland Advertising
Club. Cleveland, Ohio: American Association of Advertising Agencies, 1966.
DHALLA, N. K. Advertising as an antirecession tool. Harvard Business Review, p. 158-165, Jan./
Feb. 1980.
DRAKE, H. J. K. Galbraith’s the affluent society: a critique. Economic Notes, Libertarian Aliance,
London, n. 22, 1989.
DUFFY, M. Advertising in demand systems: testing a Galbraithian hypoyhesis. Applied
Econo-mics, v. 23, n. 2, p. 485-496, 1991.
EHREMBERG, A. S. Repetitive advertising and the consumer. Journal of Advertising Research.
v. 14, n. 2, p. 25-33, 1974.
ELLIOT, C.A cointegration analysis of advertising and sales data. Review of Industrial
Organiza-tion, v. 18, n. 4, p. 417-426, 2001.
EKELUND, R. B.; GRAMM, W. P. A reconsideration of advertising expenditures, aggregate
demand, and economic stabilization. Quarterly Review of Economic and Business, v. 9,
p. 71-77, 1969.
ENDERS, W. Applied econometric time series. Hoboken, US: Ed. Wiley, 2010.
ENGLE, R. F.; GRANGER, C. W. J. Co-integration and error correction: representation,
ANNEXES
Annex 1 – Results of unit root tests
Variables ADF test PP text KPSS test Tests with breaks
AO IO
x1 Non stationary Non stationary Non stationary Non stationary
Breaks: 1991 and 2002 No breaks
x2 Non stationary Non stationary Non stationary Non stationary
Breaks: 1991 and 2001 No breaks
x3 Non stationary Non stationary Non stationary Non stationary
Breaks: 1991 and 2001 No breaks
x4 Non stationary Non stationary Non stationary Non stationary
Breaks: 1991 and 2001 No breaks
x5 Non stationary Non stationary Non stationary Breaks: 1991 and 2001Non stationary Breaks: 1985 and 1997Non stationary
x6 Non stationary Non stationary Non stationary Non stationary Breaks: 1987 and 1996
Non stationary Breaks: 1993 and 2007
x7 Non stationary Non stationary Non stationary Non stationary
Breaks: 1991 and 2001 No breaks
x8 Non stationary Non stationary Stationary Non stationary
Breaks: 1985 No breaks
x9 Non stationary Non stationary Non stationary Non stationary Breaks: 1990 and 2001
Non stationary Breaks: 1986 and 1996
dx1 Non stationary Non stationary Stationary No breaks No breaks
dx2 Stationary Stationary Stationary No breaks Breaks: 1984Stationary
dx3 Stationary Stationary Stationary No breaks Non stationary
Breaks: 1984 and 1995
dx4 Stationary Stationary Stationary Breaks: 1987Stationary Breaks: 1984 and 1998Non stationary
dx5 Non stationary Stationary Stationary No breaks Stationary
Breaks: 1995
dx6 Stationary Stationary Stationary Stationary
Breaks: 2005
Non stationary Breaks: 2002 and 2006
dx7 Non stationary Non stationary Stationary No breaks Stationary
Breaks: 1995 and 2007
dx8 Non stationary Non stationary Stationary No breaks ***
dx9 Stationary Stationary Stationary Stationary
Breaks: 2005 ***
d2x1 Stationary Stationary *** *** ***
d2x2 *** *** *** *** ***
d2x3 *** *** *** *** Stationary
Breaks: 2007
d2x4 *** *** *** *** Stationary
Breaks: 2007
d2x5 Stationary *** *** *** ***
d2x6 *** *** *** *** No breaks
d2x7 Stationary Stationary *** *** No breaks
d2x8 Stationary Stationary No breaks No breaks
d2x9 *** *** *** *** ***
Note: H0 – existence of unit root in all cases except KPSS (where H1 is the unit root hypothesis). Significance level = 5%. Source: Authors’ elaboration.
NORRIS, V. P. Advertising history according to the textbooks. Journal of Advertising. v. 9, n. 3,
p. 3-11, 1980.
O’MALLEY, L.; STORY, V.; O’SULLIVAN, V. Marketing in a recession: retrench or invest.
Jour-nal of Strategic Marketing, v. 19, n. 3, p. 285-310, 2011.
PEEL, D. “Advertising and aggregate consumption”. In: COWLING ET AL. (Eds.) Advertising
and Economic Behavior. London: MacMillan Publishing, 1975, p. 213-228.
PERRON, P. The great crash, the oil price shock, and the unit root hypothesis. Econometrica,
v. 57, n. 6, p. 1361-1401, 1989.
PERRON, P.; VOGELSANG, T. J. Non-stationarity and level shifts with an application to
pur-chasing power parity. Journal of Business & Economic Statistics, v. 10, n. 3, p. 301-321.
QUARLES, R. C.; JEFFRES, L. V. Advertising and national consumption: a path analytic
re--examination of the Galbraithian argument. Journal of Advertising, v. 12, n. 2, p. 4-12 (33),
1983.
SCHMALENSEE, R. The economics of advertising. Amsterdam: North Holland, 1972.
SCHMALENSEE, R. Entry deterrence in the ready-to-eat breakfast cereal industry. Bell Journal
of Economics, v. 9, n. 2, p. 305-327, 1978.
STURGESS, B. Dispelling the myth: the effects of total advertising expenditures on aggregate
consumption. Journal of Advertising, v. 1, n. 3, p. 201-212, 1982.
STURGESS, B.; WILSON, N. Advertising expenditure and aggregate consumption in britain
and West Germany: an analysis of causality. Managerial and Decision Economics. v. 5, n. 4,
p. 219-227, 1984.
TAYLOR, L. D.; WEISERBS, D. Advertising and the aggregate consumption function. American
Economic Review, v. 62, n. 4, p. 642-655, 1972.
VERDON, W. A.; MCCONNELL, C. R.; ROESLER, T. W. Advertising expenditures as an
econo-mic stabilizer. Quarterly Review Economics and Business, v. 8, n. 2, p. 7-18, 1969.
WATERSON, M. J. Advertising and Cigarette Consumption. 2 ed. London: Advertising
Associa-tion, 1982.
WILDER, R. P. Advertising and inter-industry competition: testing a Galbraith Hypothesis.
Journal of Industrial Economics, v. 2, n. 3, p. 215-226, 1974.
YANG, C. Y. Variations in the cyclical behavior of advertising. Journal of Marketing, v. 28, n. 2,
Annex 2 – Results for Gregory-Hansen cointegration test
Model
Lag Length
(AIC)
Test Statistic Breakpoint Critical values(1, 5 and 10%)
ADF Zt Za ADF Zt Za ADF Zt Za
Change in level X1 X2 X3 X4 X5 X6 X7 2 2 2 2 2 2 1 -4.05 -4.08 -4.13 -4.44 -4.07 -4.52 -3.75 -3.46 -3.47 -3.21 -3.42 -3.38 -3.80 -3.77 -17.18 -17.12 -16.05 -17.72 -17.03 -21.88 -20.58 2004 2004 2004 2004 2004 2003 2002 2004 2004 2003 2004 2004 2005 2002 2004 2004 2003 2004 2004 2005 2002 -5.13 -4.61 -4.34 -5.13 -4.61 -4.34 -50.07 -40.48 -36.19
Change in level and trend X1 X2 X3 X4 X5 X6 X7 0 0 0 0 0 2 1 -3.15 -2.96 -2.92 -3.04 -3.15 -4.12 -3.36 -3.68 -3.62 -3.59 -3.50 -3.20 -3.85 -3.81 -15.58 -13.39 -13.09 -14.46 -15.27 -21.35 -20.70 2002 2002 2002 2002 2002 2003 2000 2002 2002 1982 2002 2002 2005 2002 2002 2002 1982 2002 2002 2005 2002 -5.45 -4.99 -4.72 -5.45 -4.99 -4.72 -57.28 -47.96 -43.22
Change in regime X1 X2 X3 X4 X5 X6 X7 0 1 1 0 0 0 1 -3.22 -3.19 -3.32 -3.24 -3.06 -4.26 -4.05 -3.70 -3.63 -3.62 -3.68 -3.51 -4.33 -4.01 -19.38 -18.97 -18.74 -19.12 -18.32 -24.90 -22.60 2003 1988 1988 2004 2003 2005 1998 2003 2003 2003 2003 2003 2005 2001 2003 2003 2003 2003 2003 2005 2001 -5.47 -4.95 -4.68 -5.47 -4.95 -4.68 -57.17 -47.04 -41.85
Change in regime and trend X1 X2 X3 X4 X5 X6 X7 1 2 2 1 1 2 1 -4.11 -4.06 -4.02 -3.75 -3.22 -5.19 -4.65 -2.81 -3.29 -3.39 -3.24 -3.31 -4.09 -4.37 -11.94 -14.92 -15.74 -13.14 -14.13 -21.79 -28.14 1994 1995 1993 1993 1994 1997 1997 1997 1993 1993 1992 1994 2000 1999 1997 1993 1993 1992 1994 2000 1999 -6.02 -5.50 -5.24 -6.02 -5.50 -5.24 -69.37 -58.58 -53.31