Article
J. Braz. Chem. Soc., Vol. 26, No. 12, 2607-2614, 2015. Printed in Brazil - ©2015 Sociedade Brasileira de Química 0103 - 5053 $6.00+0.00
A
*e-mail: [email protected]
Optical and Structural Studies of Mn
2+Doped SbPO
4
-ZnO-PbO Glasses
Renata S. Manzan,a,b José P. Donoso,c Claudio J. Magon,c Igor d’Anciães A. Silva,c Christian Rüsseld and Marcelo Nalin*,a
aLaboratório de Vidros Especiais (LAViE), Instituto de Química, Universidade Estadual Paulista
“Júlio de Mesquita Filho” (Unesp), 14800-060 Araraquara-SP, Brazil
bDepartmento de Química, Universidade Federal de São Carlos (UFSCar), CP 676,
13565-905 São Carlos-SP, Brazil
cInstituto de Física de São Carlos, Universidade de São Paulo (USP),
13566-590 São Carlos-SP, Brazil
dOtto Schott Institute of Materials Research, Friedrich Schiller University of Jena,
D-07743 Jena, Germany
New glass compositions in the system 1 – x(SbPO4-ZnO-PbO)-xMnO (with 0 ≤x≤ 20 in mol%) were prepared by melt-quenching methodology. Thermal, structural and optical properties of the new glasses were systematically studied by means of differential scanning calorimetry (DSC), UV-Vis and Raman spectroscopy, fluorescence and electronic paramagnetic resonance (EPR). The addition of MnO increases the thermal stability of the glasses with Tx – Tg close to 140 oC for higher Mn contents. EPR measurements show that Mn2+ ions are in octahedral arrangement which is in agreement with UV-Vis and luminescence results. Samples present red luminescence when excited with 408 nm source.
Keywords: antimony glasses, manganese, luminescence, structure
Introduction
Special glasses containing transition metal (TM) ions have aroused the interest of researchers around the globe during the last years to explore an amount of interesting phenomena like luminescence,1-3 non-linear4,5 and, more
recently, magnetic properties.6-8
The interest in luminescent glasses, mainly those containing Mn2+ ions, arises from the fact that, depending
on the composition of the glass host, the material can be used as a phosphor with emission range from green to red.3
However, it must be taken into account that the luminescent behavior is strongly dependent on the surroundings of the Mn2+ ions, and depending on the composition it can even
be completely suppressed.9
It is known that crystals present better luminescent properties than glasses (i.e., higher life times and narrow emission bands), so, to enhance the optical properties, including preparing better phosphors, an alternative is
to crystallize the glass host in order to obtain a glass-ceramic, where the transition metal should be present in the crystalline phase. In multi-component glass systems it is not that trivial because a lot of different and undesired phases can rise up during the thermal treatment. Thus, the control of the crystallization process and the knowledge of the environment of the TM are essential to maximize the efficiency of the phosphor.
Structural modifications of the local environment of the TM ion incorporated into the network resulting from thermal treatment or by varying the composition of a glass can be reflected in the electron paramagnetic resonance (EPR) and optical absorption spectra of the TM ions.10,11 Among the TM ions, Mn2+ is important because
of the extreme sensitivity of its optical and EPR spectra on the nature of the host matrix, and has been frequently used as paramagnetic probes in vitreous systems.12-16
In glass matrices, manganese may be present as Mn3+
or Mn2+ ions, occupying tetrahedral or octahedral site
symmetries.11,17,18 EPR spectroscopy is a particularly
Mn2+ and Mn4+ ions in glass matrices. In particular, EPR
techniques have been extensively used to monitor changes at the manganese sites during crystallization process and to identify spectroscopically distinct manganese sites in glasses.9,11,12,14,16,19-21
In such context, the aim of this paper was to study the optical and structural properties of phosphate glasses and glass-ceramics doped with manganese. The samples were studied by thermal analysis, Raman, UV-Vis, EPR and luminescence spectroscopy.
Experimental
The glass samples were prepared by melt quenching method, in platinum crucible, using SbPO4, ZnO, PbO
and MnCl2.4H2O as raw materials. SbPO4 was previously
synthesized as described by Nalin et al.22 The glass
composition (100 – x)70SbPO4-10ZnO-20PbO-xMnO was
chosen to be studied, with x ranging from 0 to 20 mol% as shown in Table 1.
Thermal analyses were performed with a Netsch DSC 404 Pegasus, in nitrogen atmosphere. Small pieces of glass were put in platinum crucibles and analyzed in the range from 25 to 700 oC with a heating rate of 10 oC min-1. The
characteristic temperatures of the glasses were determined: glass transition (Tg), onset of crystallization (Tx) and maximum of crystallization (Tp). The stability parameter (Tx – Tg) was used to estimate the stability of the glass compositions against devitrification. The errors associated with determinations of the temperatures are ± 2 oC for Tg
and Tx and ± 1 oC for Tp.
A LabRAM (Jobin Yvon) spectrometer equipped with a micro-Raman microscope was used to obtain the Raman spectra in the range from 100 to 2000 cm-1. The spectra
were obtained from the polished surface of the glasses. The wavelength of the laser used in measurements was 632.8 nm and the spectral resolution was 4 cm-1.
X-Band continuous-wave electron paramagnetic resonance (CW-EPR) spectra were recorded at 50 K on a
Bruker Elexsys E580 spectrometer operating at 9.478 GHz and equipped with an Oxford continuous flow liquid helium cryogenic system. Solid state powder EPR spectra were simulated using the software EasySpin,23 implemented in
MATLAB (MathWorks, Inc.).
Excitation and emission spectra were obtained using a Fluorolog (Horiba Jobin Yvon) equipment at room temperature. Both measurements were obtained from glass pieces. For excitation measurements the emission wavelength was set at 610 nm for samples 05Mn, 3Mn, 5Mn and 10Mn and 650 nm for sample 20Mn. The emission spectra were obtained by exciting at 411 nm.
Since Tg and Tx were known, heat treatments were performed between those temperatures in order to control the formation of glass-ceramics, and the absorption spectra were monitored during the heating process in an oven coupled to a Varian Cary 5000 UV-Vis-near infrared (NIR) spectrophotometer in the range from 350 to 800 nm. The spectral resolution was 4 nm.
Results and Discussion
Antimony based heavy metal oxides glasses present several interesting tecnological characteristics, concerning their high refractive index,24 good thermal stability,25 and
good non-linear properties,26 making them promising
materials for photonic applications. However, from the luminescent point of view, such materials were not yet explored. In this sense, this work aimed to study the structural and optical properties of antimony based glasses and glass-ceramics doped with Mn2+ and the luminescent
dependency on the manganese content.
Glasses in the system 100 – x(70SbPO4
-10ZnO-20PbO)-xMnO (with 0.5 ≤ x ≤ 20, in mol%) were synthesized. The prepared samples were pale yellow, and presented a slight intensification of the color as more manganese was added.
The thermal analyses results are shown in Figure 1a, from which we note an enlargement of the crystallization
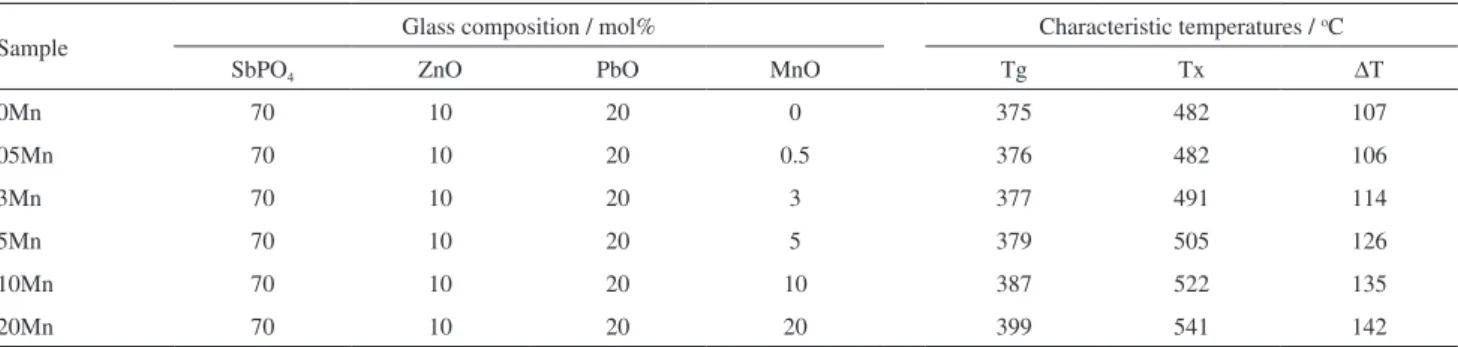
Table 1. Glass compositions, characteristic temperatures and the stability parameter of the glasses containing different MnO contents
Sample Glass composition / mol% Characteristic temperatures /
oC
SbPO4 ZnO PbO MnO Tg Tx ∆T
0Mn 70 10 20 0 375 482 107
05Mn 70 10 20 0.5 376 482 106
3Mn 70 10 20 3 377 491 114
5Mn 70 10 20 5 379 505 126
10Mn 70 10 20 10 387 522 135
20Mn 70 10 20 20 399 541 142
peak with increase of the manganese content. The characteristic temperatures also increase with the MnO concentration. Since Tx increase is more significant than that of Tg, the thermal stability also rises with increase of manganese content, which may indicate that the Mn2+ ions
favor the disorganization of the glass network making it more difficult to crystallize the glass matrices.
All the thermal results, along with the glass compositions, are summarized in Table 1. The evolution in the characteristic temperatures of the glasses is better observed in Figure 1b, for Tg, Figure 1c for Tx and Figure 1d for the stability parameter.
Raman spectra seen in Figure 2 show the characteristic profile bands of a SbPO4 based glass.22 Bands at 1140 and
978 cm-1 are assigned to ν
as PO4 and νs PO4, respectively.
Those at 620, 548, 467 and 404 cm-1 may be attributed to ν
as P–O–Sb, νas Sb–O, δs PO4 and δas Sb–O, respectively.
Those appearing at 204 and 300 cm-1 were assigned to
group modes.22 From Raman results it was not possible to
observe any significant change in the structural arrangement of the glasses despite the low intensity band appearing close 850 cm-1 for samples containing 5, 10 and 20 mol%
of MnO. Such band corresponds to luminescence of Mn2+
ions present in octahedral sites. If converted to wavelengths, 850 cm-1 corresponds to 668 nm and can be assigned
to transition 4T
1 (G) 6A1 (S).3 Also, it is clear that by
increasing the amount of manganese a large luminescent band rises up in the higher energy side and as manganese content increases, the luminescence signal of manganese begins to overlap the band at 1100 nm.
In order to investigate the role of manganese in the structure of the glasses, EPR measurements were done. Figure 3a shows the X-band CW-EPR spectrum measured at 50 K of the 100 – x(70SbPO4 -10ZnO-20PbO)-xMnO
300 350 400 450 500 550 600 650 700
H
e
a
t
flow
/
a
.u
.
Temperature /oC 0Mn
05Mn
3Mn
5Mn
10Mn
20M (a)
0 2 4 6 8 10 12 14 16 18 20
370 375 380 385 390 395 400 405
MnO / mol%
T
g
/
°C
(b)
0 2 4 6 8 10 12 14 16 18 20
480 492 504 516 528 540
MnO / mol%
T
x
/
°C
(c)
0 2 4 6 8 10 12 14 16 18 20
100 105 110 115 120 125 130 135 140 145
T
x
-T
g
/
°C
MnO / mol% (d)
Figure 1. (a) Thermal analyses of the glasses with different contents of Mn2+. Evolution of the characteristic temperatures of (b) Tg, (c) Tx and (d) thermal
stability of the samples.
300 350 400 450 500 550 600 650 700
H
e
a
t
flow
/
a
.u
.
Temperature /oC
0Mn
05Mn
3Mn
5Mn
10Mn
20M (a)
0 2 4 6 8 10 12 14 16 18 20
370 375 380 385 390 395 400 405
MnO / mol%
T
g
/
°C
(b)
0 2 4 6 8 10 12 14 16 18 20
480 492 504 516 528 540
MnO / mol%
T
x
/
°C
(c)
0 2 4 6 8 10 12 14 16 18 20
100 105 110 115 120 125 130 135 140 145
T
x
-T
g
/
°C
glasses. Two prominent features with effective g-values of
g ca. 2.0 (around 3300 G) and g ca. 4.3 (around 1500 G) appeared in all spectra. The former signal, which has been frequently reported in oxide glasses, is attributed to magnetically isolated Mn2+ ions in symmetry close to
octahedral or undistorted cubic sites.11,27-29 The low field
signal at g ca. 4.3 is associated with isolated Mn2+ ions
in rhombic distorted sites subjected to high crystal field effects.11,15,18,30,31
The Mn2+ ion has a 3d5 electronic configuration, spin S = 5/2 and ground state 6S
5/2 (high spin configuration). For
d5 transition metal ions the axial or tetragonal distortion
of octahedral crystal field gives rise to three Kramer’s doublets, ± 5/2, ± 3/2 and ± 1/2.32 Application of magnetic
field lifts the spin degeneracy of the Kramer’s doublets and the resonances observed in the EPR spectra are due to transitions within the Kramer’s doublets. The resonance at g ca. 4.3 is believed to arise from transitions between energy levels of the ± 3/2 Kramer doublet whereas those at g ca. 2 arise from transition within the ± 1/2 Kramer doublet.12,29,33,34 Manganese has a stable isotope with
non-zero nuclear spin, 55Mn, with I = 5/2 (100% natural
abundance), therefore the EPR spectra of Mn2+ ions at low
manganese concentration has a characteristic hyperfine structure composed of six lines, resulting from the dipole-dipole interaction between the magnetic moment of the
55Mn nuclei and the electronic moment of the paramagnetic
Mn2+ ion. The hyperfine sextet has long been recognized as
the main signature of Mn2+ in glasses.20
As can be seen in Figure 3a, the shape of the EPR spectra strongly depends on the MnO content of the glass samples. The EPR spectrum of the sample with lower MnO content (x = 0.5 mol%), exhibits a well-defined isotropic sextet
centered at g ca. 2.0, superimposed on a broader background. The hyperfine structure is only barely discernible in the low field resonance at g ca. 4.3. It should be noted that the signal at g ca. 4.3 may also have a contribution of natural iron impurity presented in the raw materials. The Fe3+ ion has also a 3d5 electronic configuration and the g
ca. 4.3 signal is due to isolated Fe3+ ions in tetrahedral
or octahedral symmetry with rhombic distortion.20,35,36
When the concentration of manganese increased beyond 1 mol% MnO in the glass samples, the hyperfine structure disappears and the spectra reduces to a broad resonance line centered at g ca. 2.0 (Figure 3a). The disappearance of the hyperfine structure in glasses with higher content of MnO indicates the increase of dipole-dipole interactions and, at higher MnO concentrations, the presence of magnetic exchange interaction.16,37,38 The manganese concentration
dependence of the EPR line intensity, shown in Figure 3b, was obtained from the double integration of the resonance
200 400 600 800 1000 1200 1400
1140 978
850 620
548 467 404 300
In
te
n
s
it
y
/
a
.u
.
Wavenumber / cm-1
20Mn
10Mn
5Mn
3Mn
05Mn
0M
204
Figure 2. Raman spectra of the glasses containing different contents of MnO.
0 1000 2000 3000 4000 5000 6000
10M 5Mn 3Mn
In
te
n
s
it
y
/
a
.u
.
In
te
n
s
it
y
/
a
.u
.
Magnetic field / G 05Mn
(a)
0 2 4 6 8 10
0 5 10 15 20 25
MnO concentration / mol% (b)
Figure 3. (a) EPR spectra of the glasses containing different contents of MnO. (b) Manganese concentration dependence on the EPR line intensity.
200 400 600 800 1000 1200 1400
1140 978
850 620
548 467 404 300
In
te
n
s
it
y
/
a
.u
.
Wavenumber / cm-1
20Mn
10Mn
5Mn
3Mn
05Mn
0M
204
0 1000 2000 3000 4000 5000 6000 10M
5Mn 3Mn
In
te
n
s
it
y
/
a
.u
.
In
te
n
s
it
y
/
a
.u
.
Magnetic field / G 05Mn
(a)
0 2 4 6 8 10
0 5 10 15 20 25
MnO concentration / mol%
line at g ca. 2.0 and normalized by their mass. The intensity of the resonance at g ca. 2.0 increases almost linearly with the manganese ions content in the glass up to 10 mol%. This behavior is in agreement with those observed in other manganese doped phosphate glasses.11,16,29,39
The resonance signal centered at g ca. 2.0 is dominant in the Mn2+ spectra of the glass sample with 0.5 mol% of
MnO (Figure 3a). For most of the reported EPR studies in manganese-doped glasses, the signal at g ca. 4.3 is weak if compared to the main resonance at g ca. 2.0. This result suggests that for low MnO concentration, the Mn2+ ions enter in the 70SbPO
4-10ZnO-20PbO glass as
isolated ions occupying predominantly highly ordered environment close to octahedral symmetry, giving the g ca. 2.0 resonance signal.11,16,18,38 On the other hand, it should
be noted that dominant Mn2+ resonance signal at g ca. 4.3
has been reported on glasses based on B2O3-Bi2O315,35 and
90PbGeO3-10SbPO4,9 indicating that a significant fraction
of Mn2+ ions in these glasses are in rhombically octahedral
distorted sites.
It is interesting to note the shift of the EPR resonance toward lower magnetic field with increasing MnO content in Figure 3a. For low MnO levels, the g-value (g = 2.005 for sample with 0.5 and 3 mol% of MnO) is close to the free electron value (ge = 2.0023). At higher MnO concentrations
the g-value shifts to 2.022 (sample 5Mn) and 2.037 (sample 10Mn). Similar changes in g-values were reported in
xMnO-(1 – x)(Sr-O-P2O5)40 and MnxSr1 – x(PO3)2 glasses,11
where the parameter increased from g = 2.00 for x = 0.1 to
g = 2.04 for x = 1.0. Similar trends were observed in LiI-AgI-B2O3-MnO glasses, where the g-value increased from
2.0027 to 2.0070 when the MnO content increased from 0.1 to 0.8 mol%.18 The shift in g-value with the manganese
concentration has been correlated with the bonding character of the Mn2+ ion incorporated in the glass. Values
above the free electron g-value are indicative of more covalent, and those below are related to more ionic Mn2+
bonding character.11,40 Accordingly, the positive deviation
of the g-valuewith the MnO content observed in Figure 3 suggests a more covalent character in Mn2+ site for higher
Mn content in the SbPO4-ZnO-PbO glasses studied here.
The influence of the MnO content on the optical properties of the glasses was investigated by UV-Vis spectroscopy and the absorption spectra may be observed in Figure 4. Results show a sharp band at 411 nm, which is more intense as the manganese content in the glass sample increases. Such band is assigned to 6A
1 (S) 4A1, 4E (G) from Mn2+ ions in octahedral symmetry which is in
agreement with EPR results. This band presents a shoulder around 420 nm which has been assigned to 6A
1 (S) 4T2
(G) transition. A second band, which is broader, is observed
at about 520 nm only for sample 20Mn and attributed to transition 6A
1 (S) →4T1 (G). Considering the presence of
such band for the sample more concentrated in MnO, we can rule out the presence of small amounts of Mn3+ ions. In
a very detailed study, Konidakis et al.40 showed that even
concentrations below 0.07% in Mn3+ ions are enough to
present absorption band in this region. Such results are also in agreement with previously reported data.3
Due to very low concentration and because Mn3+ is
silent to EPR measurements, the presence of such ion is difficult to be characterized in glasses.
The red shift observed in the cutting edge as the sample is more concentrated in manganese may be assigned to both charge-transfer excitations from oxygen to Mn2+
and/or Mn3+ and intervalence charge-transfer excitations
from Mn2+ towards Mn3+.40
The glasses were studied by luminescence spectroscopy and the results are shown in Figure 5. In the excitation spectra of the glasses, shown in Figure 5a, the absorption profiles are similar to those observed by Winterstein et al.41
The inset in Figure 5a shows a deconvolution of the bands for sample 20Mn. The six d-d transitions were assigned and correspond to transitions from the fundamental level
6A
1 of Mn2+ towards the excited states 4E (4D), 4T2 (4D), 4E
(4G), 4A1 (4G), 4T2 (4G) and 4T1 (4G), respectively.
Emission spectra of the samples are shown in Figure 5b. Broad bands are observed in the region between 620 and 680 nm, and have a red shift as the concentration increases. Mn2+ (d5) in octahedral symmetry and high spin
configuration is not supposed to present allowed transitions. However, if some symmetry distortion is observed the transition become allowed by the Laporte rule and the
350 400 450 500 550 600 650
0.0 0.1 0.2 0.3 0.4 0.5 0.6 0.7 0.8 0.9 1.0
6
A1(S) 4T2(G) 6
A1(S) 4A1.4E (G)
A
b
s
o
rb
a
n
c
e
/
a
.u
.
Wavelength / nm
0Mn 05Mn 3Mn 5Mn 10Mn 20Mn
6
A1(S) 4T1(G)
Figure 4. Absorption spectra of the glasses with different contents of MnO.
350 400 450 500 550 600 650
0.0 0.1 0.2 0.3 0.4 0.5 0.6 0.7 0.8 0.9 1.0
6
A1(S) 4T2(G)
6
A1(S) 4A1.4E (G)
A
b
s
o
rb
a
n
c
e
/
a
.u
.
Wavelength / nm
0Mn 05Mn 3Mn 5Mn 10Mn 20Mn
6
emission band can be observed.42 Usually, if Mn2+ ions
are in tetrahedral arrangement, the emission band appears in the green region while octahedrally surrounded Mn2+
presents emission from orange to red.41,43 Following the
same argument discussed above, the emission bands shown in Figure 5b were assigned to transition 4T
1 (G) →6A1 (S)
of Mn2+ in octahedral environment.42,44 The red shift was
already observed by Reisfeld et al.45 and is an indicative
that the increase of manganese concentration increases the crystal field strength.
The photograph of the sample without MnO and the sample containing 10 mol% Mn (10Mn) under white light irradiation is shown in Figure 6a. It is clear that the addition of manganese leads to a slight change in the color of the mother glass. This color comes mainly as a result of the absorption band at 410 nm, as observed in Figure 4.
Under excitation of a light source at 480 nm it is possible to observe the red emission of the sample 10Mn while the non-doped sample remains unchanged. The emission lifetime was measured for all samples and the results are summarized in Table 2.
From the results listed in Table 2 it is possible to infer that the lifetimes (τ) are low, but coherent with amorphous materials; increasing the MnO content a decrease in τ was also observed, which is in agreement with other results shown by Reisfield et al.45 Such effect is assigned
to luminescence-quenching as a function of the MnO concentration for samples.3,46
Nowadays, the preparation of glass-ceramics using such glasses are under investigation in our laboratories in order to obtain longer lifetimes and also focusing on the magnetic properties of such new materials, since the crystallization of MnO in nanoscale from the glass can be achieved by controlled thermal annealing.
Conclusions
The local symmetry of Mn2+ in the matrix must be
predominantly octahedral, as observed from the results of absorbance spectroscopy, EPR and luminescence.
From thermal analysis results we conclude that the devitrification of glasses becomes less favorable when the manganese concentration increases in the glass composition. This may be an indicative that the ions favor the disorder of the matrix, possibly occupying the interstices. On the other hand, when the concentration of
320 360 400 440 480 520 560
0.0 0.2 0.4 0.6 0.8 1.0
30000 27500 25000 22500 20000 17500 0.0 0.2 0.4 0.6 0.8 1.0 In te n s it y / a .u .
Wavelength / nm 05Mn 3Mn 5Mn 10Mn 20Mn (a) 4 T 2( 4 G) 4 T 1( 4 G) 4 A 1( 4 G) 4
E (4
G)
Wavenumber / cm-1
4
E (4
D) 4 T 2( 4 D) 20Mn
450 500 550 600 650 700 750 800
0.0 0.2 0.4 0.6 0.8 1.0 Intensit y / a .u .
Wavelength / nm 05Mn 3Mn 5Mn 10Mn 20Mn 4
T1(G) 6A1(S) (b)
Figure 5. (a) Excitation spectra of the samples. The inset shows the deconvolution of the excitation spectra, here represented by sample 20Mn. (b) Emission spectra of the glasses.
Table 2. Lifetime of the emission in the red for the samples containing different amounts of MnO.
Sample τ / ms R2
05Mn 5.65 ± 0.24 0.95
3Mn 5.71 ± 0.77 0.99
5Mn 4.59 ± 0.54 0.99
10Mn 2.66 ± 0.27 0.99
20Mn 0.35 ± 0.27 0.99
τ: Emission lifetime; R2: coefficient of determination.
Figure 6. (a) Photograph under white light of the glass matrix containing 0 and 10 mol% of MnO; (b) photograph of both samples under illumination of a λ = 408 nm light source.
320 360 400 440 480 520 560
0.0 0.2 0.4 0.6 0.8 1.0
30000 27500 25000 22500 20000 17500 0.0 0.2 0.4 0.6 0.8 1.0 In te n s it y / a .u .
Wavelength / nm 05Mn 3Mn 5Mn 10Mn 20Mn (a) 4 T 2( 4 G) 4 T 1( 4 G) 4 A 1( 4 G) 4
E (4
G)
Wavenumber / cm-1
4
E (4
D) 4 T 2( 4 D) 20Mn
450 500 550 600 650 700 750 800
0.0 0.2 0.4 0.6 0.8 1.0 Intensit y / a .u .
Wavelength / nm 05Mn 3Mn 5Mn 10Mn 20Mn 4
MnO is higher than 5 mol%, a new band at ca. 850 nm appears in the Raman spectra; however, it corresponds to luminescence of Mn2+ in Oh symmetry.
The samples containing Mn2+ ions are luminescent and
present red emission when excited with λ = 408 nm. The emission band shifts to higher wavelengths along with the Mn content.
Acknowledgements
The authors are grateful to grants No. 2012/05087-4 and No. 2013/07793-6, São Paulo Research Foundation (FAPESP) for financial support.
References
1. Katayama, Y.; Ueda, J.; Tanabe, S.; Opt. Mater. Express2014,
4, 613.
2. Song, E.; Zhao, W.; Dou, X.; Zhu, Y.; Yi, S.; Min, H.; J. Lumin.
2012, 132, 1462.
3. Da, N.; Peng, M.; Krolikowski, S.; Wondraczek, L.; Opt. Express2010, 18, 2549.
4. Schmidt, M. A.; Wondraczek, L.; Lee, H. W.; Granzow, N.; Da, N.; Russell, P. S. J.; Adv. Mater. 2011, 23, 3681.
5. Satyanarayana, T.; Valente, M. A.; Nagarjuna, G.; Veeraiah, N.;
J. Phys. Chem. Solids2013, 7, 229.
6. Raghuwanshi, V. S.; Harizanova, R.; Haas, S.; Tatchev, D.; Gugov, I.; Dewhurst, C.; Russel, C.; Hoell, A.; J. Non-Cryst. Solids 2014, 385, 24.
7. Worch, C.; Buttner, M.; Schaaf, P.; Harizanova, R.; Russel, C.; Schimidt, F.; Seidel, P.; J. Mater. Sci. 2013, 48, 2299. 8. Jungwirth, T.; Nemec, P.; Novak, V.; Nat. Photonics2013, 7,
500.
9. Volpi, V.; Montesso, M.; Ribeiro, S. J. L.; Viali, W. R.; Magon, C. J.; Silva, I. D. A.; Donoso, J. P.; Nalin, M.; J. Non-Cryst. Solids, inpress, DOI: 10.1016/j.jnoncrysol.2015.04.022.
10. Ravikumar, R. V. S. S. N.; Ikeda, K.; Chandrasekhar, A. V.; Reddy, Y. P.; Rao, P. S.; Yamauchi, J.; J. Phys. Chem. Solids 2003, 64, 2433.
11. Möncke, D.; Kamitsos, E. I.; Herrmann, A.; Ehrt, D.; Friedrich, M.; J. Non-Cryst. Solids2011, 357, 2542.
12. Srinivasa Reddy, M.; Murali Krishna, G.; Veeraiah, N.; J. Phys. Chem. Solids2006, 67, 789.
13. Winterstein-Beckmann, A.; Möncke, D.; Palles, D.; Kamitsos, E. I.; Wondraczek, L.; J. Non-Cryst. Solids2013, 376, 165. 14. Singh, R. K.; Kothiyal, G. P.; Srinivasan. A.; J. Non-Cryst.
Solids2008, 354, 3166.
15. Singh, S. P.; Chakradhar, R. P. S.; Rao, J. L.; Karmakar, B.;
Phys. B 2010, 405, 2157.
16. Ardelean, I.; Toderas, M.; Horea, C.; Filip, S.; J. Optoelectron. Adv. Mater. 2008, 10, 243.
17. Ravi Kumar, A. V.; Srinivasa Rao, Ch.; Narasimha Rao, N.; Ravi Kumar V.; Kityk, I. V.; Veeraiah, N.; J. Non-Cryst. Solids 2012, 358, 1278.
18. Mogus-Milankovic, A.; Pavic, L.; Srilatha, K.; Rao, Ch. S.; Srikumar, T.; Gandhi, Y.; Veeraiah, N.; J. Appl. Phys. 2012,
111, 013714.
19. Fuxi, G.; Huimin, L.; J. Non-Cryst. Solids1987, 95-96, 61. 20. Griscom, D. L.; J. Non-Cryst. Solids1980, 40, 211.
21. Franco, R. W. A.; Lima, J. F.; Magon, C. J.; Donoso, J. P.; Messaddeq, Y.; J. Non-Cryst. Solids2006, 352, 3414. 22. Nalin, M.; Messaddeq, Y.; Ribeiro, S. J. L.; Poulain, M.;
Briois, V.; Brunklaus, G.; Rosenhahn, C.; Mosel, B. D.; Eckert, H.; J. Mater. Chem. 2004, 14, 3398.
23. Stoll, S.; Schweiger, J.; Magn. Reson. 2006, 178, 42. 24. Gómez, L. A.; de Araújo, C. B.; Messias, D. N.; Misoguti, L.;
Zílio, S. C.; Nalin, M.; Messaddeq, Y.; J. Appl. Phys. 2006, 100, 116105.
25. Nalin, M.; Poulain, M.; Poulain, M.; Ribeiro, S. J. L.; Messaddeq, Y.; J. Non-Cryst. Solids2001, 284, 110.
26. Falcão-Filho, E. L.; de Araújo, C. B.; Bosco, C. A. C.; Maciel, G. S.; Acioli, L. H.; Nalin, M.; Messaddeq, Y.; J. Appl. Phys.
2005, 97, 013505.
27. Kliava, J.; Phys. Status Solidi B1986, 134, 411.
28. Bogomolova, L. D.; Krasilnikova, N. A.; Bogdanov, V. L.; Khalilev, V. D.; Mitrofanov, V. V.; J. Non-Cryst. Solids1995,
188, 130.
29. Pascuta, P.; Bosca, M.; Borodi, G.; Culea, E.; J. Alloys Compd.
2011, 509, 4314.
30. Ardelean, I.; Flora, M.; J. Mater. Sci. 2002, 13, 357. 31. Schreurs, J. W. H.; J. Chem. Phys. 1978, 69, 2151.
32. Abragam, A.; Bleaney, B.; Electron Paramagnetic Resonance of Transition Ions; Oxford University Press: Oxford, 1970.
33. Priya, V. V.; Upender, G.; Prasad, M.; Glass Phys. Chem. 2014,
40, 144.
34. Kripal, R.; Maurya, M.; Mater. Chem. Phys. 2008, 108, 257. 35. Singh, R. K.; Srinivasan, A.; J. Magn. Magn. Mater. 2010, 322,
2018.
36. Muralidhara, R. S.; Kesavulu, C. R.; Rao, J. L.; Anavekar, R. V.; Chakradhar. R. P. S.; J. Phys. Chem. Solids2010, 71, 1651.
37. Ardelean, I.; Cora, S.; Lucacel, R. C.; Hulpus, O.; Solid State Sci.2005, 7, 1438.
38. Cerný, V.; Petrova, B.; Frumar, M.; J. Non-Cryst. Solids1990,
125, 17.
39. Toloman, D.; Giurgiu, L. M.; Ardelean, I.; Phys. B2009, 404, 4198.
40. Konidakis, I.; Varsamis, C. E.; Kamitsos, E. I.; Moncke, D.; Ehrt, D.; J. Phys. Chem. C2010, 114, 9125.
41. Winterstein, A.; Akamatsu, H.; Moncke, D.; Tanaka, K.; Shimidt, M. A.; Wondraczek, L.; Opt. Mater. Express2013,
42. Kawano, M.; Takebe, H.; Kuwabara, M.; Opt. Mater. 2009, 32, 277.
43. Molla, A. R.; Chakradhar, R. P. S.; Kesavulu, C. R.; Rao, J. L.; Biswas, S. K.; J. Alloys Compd. 2012, 512, 105.
44. Kiran, N.; Kesavulu, C. R.; Kumar, A. S.; Rao, J. L.; Phys. B 2011, 406, 3816.
45. Reisfeld, R.; Kisilev, A.; Jorgensen, C. K.; Chem. Phys. Lett.
1984, 111, 19.
46. Li, P.; Peng, M.; Wondraczek, L.; Zhao, Y.; Viana, B.; J. Mater. Chem. C2015, 3, 3406.
Submitted: July 20, 2015
Published online: October 30, 2015