Article
Printed in Brazil - ©2017 Sociedade Brasileira de Química0103 - 5053 $6.00+0.00*e-mail: [email protected]
Sensitive Estrogens Determination in Wastewater Samples by HPLC and
Fluorescence Detection
Marcus Vinicius de Liz,a Bianca do Amaral,b Sandra Stets,b Noemi Nagatab and Patricio Peralta-Zamora*,b
aDepartamento Acadêmico de Química e Biologia, Universidade Tecnológica Federal do Paraná,
81280-340 Curitiba-PR, Brazil
bDepartamento de Química, Universidade Federal do Paraná, CP 19081,
81531-980 Curitiba-PR, Brazil
A sensitive high-performance liquid chromatography-fluorescence detection method (HPLC-FLD) was developed and validated for 17β-estradiol (E2) and 17α-ethinylestradiol (EE2) determination in wastewater samples. Sample preparation was performed by solid-phase extraction (SPE) on Hypersep C18 cartridges. Conditioning and elution solvents and sample volume were investigated by a 23 factorial design for both analytes. The pre-concentration factor was 2500 times, allowing to quantify 5.0 ng L-1 for both hormones. The SPE-HPLC-FLD method was successfully applied to detect and quantify trace amount of target compounds in raw and treated wastewater samples. E2 was found below limit of quantification in influent and effluent samples. Nevertheless, the recoveries of E2 in standard addition experiments were between 41 and 72%, with relative standard deviations between 4 and 16%. An important matrix effect was observed in the determination of EE2, with fluorescence signal suppression.
Keywords: estrogens, SPE, HPLC, fluorescence, wastewater
Introduction
Contamination of water resources represents a worldwide concern. Excessive population growth with the inefficient wastewater collection, particularly in developing countries, low treatment efficiency and inadequate sewage disposal, are the common causes of water contamination.1 Endocrine disrupting compounds
(EDCs), especially estrogens, are chemical species that have negative activity on the endocrine system in humans2,3 and animals.4,5
Estrone (E1), 17β-estradiol (E2) and estriol (E3) are estrogens naturally produced by mammals and excreted mainly by pregnant and menstrual women via urine and feces.1 Otherwise, 17α-ethinylestradiol (EE2) is a synthetic
estrogen widely used as contraceptive and for therapeutic purposes such menopausal syndrome and prostate cancer control.6 Despite of being unregulated contaminants in
environmental waters, they have already been included in the New Contaminant Candidate List-3 of the U.S.
EPA and in the list of priority substances of the EU Water Framework Directive.7,8
These compounds have been detected in wastewater treatment plants (WWTP),9-12 in natural waters9,13 and,
even in water supplies.14 Since 1990, estrogenic activity
has been detected in many countries. For instance, E1, E2, and EE2 were found in concentrations about ng L-1 in the
effluent from a sewage treatment plant in the UK.15 In Brazil,
monitoring studies of natural estrogens in domestic sewage also were initiated in the 90s.16 This study revealed estrogen
concentrations between 20 and 40 ng L-1 and only partial
removal by conventional treatments based on biological filter and activated sludge systems. Since then, other monitoring works reported the presence of endocrine disruptors in surface waters in Brazil. Sodré et al.17 detected E2 and EE2
between 38 to 2,510 ng L-1 and 6 to 310 ng L-1, respectively,
in river water samples. Moreira et al.18 monitored river
water samples for eight months and found EE2 and E2 in concentration levels between 5.6 to 63.8 ng L-1. The higher
concentrations observed by Torres et al.19 in surface and drinking water samples were 28, 90, 137, and 194 ng L-1 to
The estrogens monitoring in sewage and natural waters is a challenge due to the low concentration of the analytes and the complexity of the environmental matrices. Most of the reported methods to estrogens determination in aqueous samples involve preconcentration and clean-up processes such solid phase extraction (SPE),20-22 stir bar
sorptive extraction (SBSE),23 solid-phase microextraction
(SPME),24,25 and dispersive liquid-liquid microextraction
(DLLME),26 among others. SPE followed by instrumental
systems based on liquid chromatography, usually coupled with mass spectrometry detection,19,27,28 is the most
employed procedure to detect estrogens in environmental samples. Despite that, these instruments are expensive and require high investment costs for their maintenance.29
High-performance liquid chromatography coupled with UV (HPLC-UV)30-32 and fluorescence detection
(HPLC-FLD)26,29,33-35 have been reported as low-cost
alternatives to HPLC-MS analysis, used to determine estrogens with quantification limits compatible with the concentration of estrogens in wastewater and natural waters. Lopes et al.36 showed the determination of E1 and E2 by SPE-HPLC-FLD in natural (600 ng L-1 of E1 in surface
water, 6 ng L-1 of E2 in river spring) and treated waters
(6.8 ng L-1 of E2) in São Paulo (Brazil). Melo and Brito37
also developed an SPE-HPLC-FLD method and applied in the determination of EE2 in surface water and water supply of São Luis (Brazil), in which concentrations were below the limit of detection.
The aim of this study was the development of a high-performance liquid chromatographic method with fluorescence detection for the routine determination of 17β-estradiol (E2) and 17α-ethinylestradiol (EE2) in wastewater. The developed method was validated and employed in urban wastewater samples from the city of Curitiba (Paraná State, Brazil). To the best of our knowledge, no similar approach has been reported on developing a complete methodology and validation for simultaneous determination of estrogens in wastewater samples by SPE-HPLC-FLD in Brazil.
Experimental
Materials
All HPLC-grade solvents were purchased from J. T. Baker (Philipsburg, NJ, USA). 17β-estradiol (E2, ≥ 98%), estriol (E3, ≥ 97%) and 17α-ethinylestradiol (EE2,
≥ 98%), were purchased from Sigma-Aldrich (Steinheim, Germany). Individual standard stock solutions were prepared by dissolving an appropriate amount of standard in HPLC grade methanol and kept at −4 °C (100 mg L-1).
All aqueous solutions were prepared daily using ultrapure water (18.2 MΩ cm, Milli-Q system, Millipore, Bedford, MA, USA) from appropriate dilutions of the stock solution.
Sampling and sample preparation
Influent and effluent wastewater samples were collected from two anaerobic wastewater treatment plants located in Curitiba City, Paraná, Brazil. Typically, household wastewater is collected by underground sewage system and feed an upflow anaerobic sludge blanket (UASB) reactor. The post-treatment is performed by coagulation and flotation using ferric chloride (FeCl3) or polyelectrolytes.
Organic charge removal efficiency about 80% is obtained in these WWTP.
Sample volumes of 4 or 8 L were collected in amber bottle glass and stored at 4 °C until analysis. The maximum time of storage was 72 hours to minimize microbial degradation. Samples were filtered through a 0.6 mm filter (Macherey-Nagel, GF-3, Germany) in order to remove suspended solids.
Extraction of the selected compounds was performed with a PrepSep 20-port vacuum manifold (Waters, Milford, MA, USA) using Hypersep C18 cartridges (3 mL polypropylene tube, 500 mg, Thermo Scientific, USA). The SPE experimental conditions, such conditioning, elution solvents and sample volume were optimized by a full 23 factorial design according to Table 1. The cartridges were
previously conditioned with 7 mL of acetonitrile, 5 mL of methanol and 5 mL of water according to the described in our previous paper38 and adapted from Girotto et al.39 and
López de Alda and Barceló.20 Briefly, extractions were
performed at a flow rate of about 4 mL min-1. Afterward,
the cartridges were drought with a gentle nitrogen flow and eluted with four aliquots of acetonitrile (2.5 mL). The eluate was concentrated to dryness with a gentle nitrogen flow and reconstituted with 0.150 mL of methanol, yielding an enrichment factor of 2,000 times. Final extracts were kept at −4 °C until chromatographic determinations.
Chromatographic determination
H i g h - p e r f o r m a n c e l i q u i d c h r o m a t o g r a p h y measurements were carried out on a Varian 920-LC chromatograph equipped with an autosampler, quaternary gradient pump and fluorescence detector (Agilent 1260). Routine chromatographic separations were performed on a C18 Microsorb column (250 × 4.6 mm, 5 µm) with a Metaguard pursuit C18 (4.6 mm i.d.) as guard column. The flow rate was 0.8 mL min-1 with an injection volume
were determined by fluorescence detection at an excitation wavelength of 282 nm and an emission wavelength of 306 nm. The analytes separation were achieved by gradient elution using water (A) and acetonitrile (B) as a mobile phase: A:B (90:10) was increased linearly to 42% of B in 70 min and then to A:B (45:55) in 10 min. From 80 to 82 min, mobile phase B was increased linearly to 100% and this condition was held for 10 min. Finally, the initial condition was returned in 2 min and held for 11 min.
Method validation
The method developed was evaluated according to the following parameters: selectivity, linearity, detection and quantification limits, precision and accuracy. The linearity was tested in the concentration range studied: 2.0 to 200 µg L-1 for E2 and EE2. The sensitivity for each
hormone was evaluated by the average of three slope curves independently prepared. Selectivity was evaluated by comparing the analytes in the solvent (methanol) with wastewater samples fortified with 5.00 mg L-1. Extraction of
100 mL of aqueous solution at 20.0 µg L-1 of each estrogen
prepared in different days was used to assess the precision (sextuplicate), expressed in relative standard deviation (RSD). The accuracy was determined by recovery at different concentrations of each estrogen. The limits of detection (LOD) and quantification (LOQ) were assessed according to visual evaluation for three analytical curves according guidelines from IUPAC40 and ICH.41 Robustness tests were
performed on temperature and pressure of column variation.
Standard addition recovery studies
Tree-hundred milliliters of wastewater were spiked with the hormones in triplicate at five concentration levels (10, 50 75, 100 and 300 ng L-1) and submitted to aging for
24 hours. Spiked samples were submitted to solid phase extraction described in Sampling and sample preparation section. The obtained chromatograms were confronted to the ones acquired from wastewater without standard addition, to the standard solutions and to samples with post-extraction fortification (approximately 0.6 mg L-1).
Results and Discussion
Chromatographic method
Figure 1 shows the fluorescence spectra of each hormone standards at 5 mg L-1 in aqueous solution.
The natural fluorescence behavior is represented by a strong emission at 306 nm in 230 and 282 nm excitation wavelengths.
A detailed analysis of these spectral profiles shows there is a significant difference between the excitation wavelengths and high fluorescence intensities. Nevertheless, it is important to point out that most of the works have employed 230 nm as excitation wavelength29,33,37 which has a suitable response to river
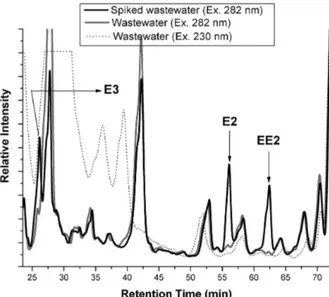
and drinking water samples. Nonetheless, wastewater samples showed high interference on fluorescence signal at 230 nm (Figure 2). Hence, 280 nm was selected as
Figure 1. Excitation-emission fluorescence spectra of (a) 17β-estradiol and (b) 17α-ethinylestradiol at 5 mg L-1. Table 1. SPE conditions to estrogens (10 µg L-1) evaluated in 23 factorial design
Conditioning Sample volume / mL Elution
(−)a (+)b (−) (+) (−)a (+)b
4 mL acetone 5 mL methanol 5 mL ultrapure water
7 mL acetonitrile 5 mL methanol 5 mL ultrapure water
100 500 2 × 5 mL acetone 2 × 5 mL acetonitrile
excitation wavelength to ensure suitable detectability of E2 and EE2 at trace level concentrations. Lima et al.26
and Kumar et al.34 also monitored estrogens in wastewater samples at 280 nm as excitation wavelength with minor matrix interference.
The chromatographic method was carefully developed in order to achieve a suitable resolution for both hormones. Thereby, different mobile phases with methanol, acetonitrile, and water were tested in several eluting programs. Acetonitrile was selected for further separations in the gradient elution program. Although the analytes separation could be achieved at a shorter elution time, the complexity of analyzed samples needed longer times to minimize matrix interference.
Extraction procedure optimization
The analysis of estrogens in aqueous matrices frequently involves samples volumes between 100 and 2000 mL and the use of preliminary procedures of filtration and extraction.42 In the filtration process, the adsorption of
estrogens on cellulose ester or nylon filters allowed losses between 30 and 50%, respectively, of the analytes, which make it almost mandatory to use filters based on the glass fiber.38,43,44
Extraction processes are usually carried out by solid phase extraction, involving the use of cartridges containing silica C18 or polymeric sorbents and acetone, acetonitrile or methanol as the elution solvent.45 In
general, silica C18 cartridges have been widely used in estrogens extraction processes with two solvent systems: the first adopted acetone/methanol/water as conditioning
solvent and acetone as elution solvent, while the second involves conditioning with acetonitrile/methanol/water and elution with acetonitrile. Therefore, in this study, the extraction efficiency of both procedures was evaluated by a factorial design using the average extraction recovery of the two studied estrogens (E2 and EE2) as processing response. Additionally, the effect of the sample volume was investigated, which configures a full 23 factorial design.
Based on the estimated effects, and taking into account the typical deviation of triplicate analysis (approximately 6%), it was observed that the extraction process was not significantly influenced by the studied variables. Although all procedures were very efficient, allowing recoveries between 85 and 95%, slight recovery improvements were observed with acetonitrile in the conditioning and elution step as shown in Figure 3. Likewise, a slight improvement in the extraction capacity was observed for sample volumes of 500 mL. This result is in accordance with those reported by López de Alda and Barceló,46 which suggest 500 mL as
the operational limit for the SPE cartridges. The optimized extraction conditions were established as: mixture acetonitrile/methanol/water as conditioning solvent, acetonitrile as elution solvent and sample volume between 100 and 500 mL, depending on the analysis requirements.
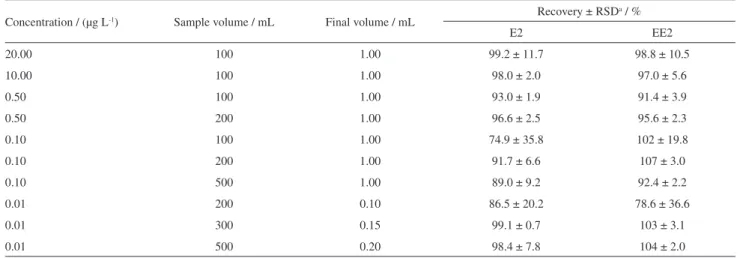
The recovery of estrogens from aqueous solution was also evaluated under different analytes concentration between 0.01 and 20.00 µg L-1, samples volumes between
100 and 500 mL and reconstitution volumes between 0.1 and 1.0 mL. The results in Table 2 showed excellent recoveries for concentrations up to 10 ng L-1, which
were obtained mainly due to the high sensibility of the fluorescence detector and the preconcentration factors of 2,000 to 2,500 times. This limit of quantification is lower than those reported by Sodré et al.47 that implemented an
extraction method and liquid chromatography-tandem
Figure 2. Typical chromatogram of natural and spiked wastewater samples (spiked at 600 µg L-1).
Figure 3. Geometrical representation of the 23 factorial designs used to
mass spectrometry detection with preconcentration factors of 5,000 times.
Performance of the analytical method
Under optimized conditions, validation procedure was performed by the linear range and linearity, determination coefficient (R2), LOD and LOQ as summarized in
Table 3. The SPE-HPLC-FLD showed a good linearity for hormones in the range of 10 to 200 µg L-1 for E2 and
EE2 with determination coefficients higher than 0.99. The instrumental precision (HPLC-FLD method) was evaluated by determination of a sample containing 100 µg L-1 of each
estrogen, in triplicate. The gradient elution utilized allowed relative standard deviation lower than 5%.
The LOD and LOQ were calculated by visual evaluation which is a precision-based approach. Analytes concentration were systematically decreased and the value accepted as quantitation limit exhibited 20% as the maximum relative standard deviation. In this work 5.0 ng L-1 for both estrogens was found as LOQ. The value
immediately below this concentration but with the standard deviation greater than 20% was considered the limit of detection (2.5 ng L-1). LOD and LOQ were also obtained
by curve parameters method (0.835 and 2.54 ng L-1 for E2,
respectively; 2.56 and 7.8 ng L-1 for EE2, respectively).
Lower values for E2 and similar results for EE2 were obtained in both methods. Since the latter method is most applicable when the analysis has no significant background noise,48 the first method was adopted in this work as shown
in Table 3. It is important to point out that instrumental limits of quantification associated with preconcentration factors of 2000, allowed quantitation limits of 5 ng L-1 for
E2 and EE2, which is consistent with the proposed study.
The recoveries of the two estrogens reached values higher than 97%, whereas the standard deviation values achieved were in the order of 10%. Although there is no maximum value for the random errors obtained in an analysis, 80 to 120% is considered acceptable as recovery rate with relative standard deviation up to 20% for micropollutants determination.40,49 This is acceptable
since analyte recovery depends on the concentration range, matrix complexity and the number of steps involved in the process. Lopes et al.36 achieved recovery levels for
E2 in SPE-HPLC-FLD method between 96 and 128% in surface water and between 86 and 93% in treated water, with coefficients of variation between 3 and 24%, working with 1 L of sample. Montagner and Jardim50 developed
an SPE-HPLC-FLD method with E2 and EE2 recoveries from 65 to 74% for water sample containing 1.0 µg L-1 with
coefficients of variation below 5% for both analytes. The results obtained in the present study are in accordance with those reported in literature.
Table 2. Recovery of estrogens from aqueous solution by SPE extraction under different preconcentration levels
Concentration / (µg L-1) Sample volume / mL Final volume / mL Recovery ± RSD a / %
E2 EE2
20.00 100 1.00 99.2 ± 11.7 98.8 ± 10.5
10.00 100 1.00 98.0 ± 2.0 97.0 ± 5.6
0.50 100 1.00 93.0 ± 1.9 91.4 ± 3.9
0.50 200 1.00 96.6 ± 2.5 95.6 ± 2.3
0.10 100 1.00 74.9 ± 35.8 102 ± 19.8
0.10 200 1.00 91.7 ± 6.6 107 ± 3.0
0.10 500 1.00 89.0 ± 9.2 92.4 ± 2.2
0.01 200 0.10 86.5 ± 20.2 78.6 ± 36.6
0.01 300 0.15 99.1 ± 0.7 103 ± 3.1
0.01 500 0.20 98.4 ± 7.8 104 ± 2.0
aRSD: relative standard deviation (n = 3).
Table 3. Analytical method performance to estrogens determination in
aqueous standard solutions
E2 EE2
Equation Y = −0.342 + 74.94X Y = −0.244 + 66.59X
R2 0.9998 0.9955
LCRa / (µg L-1) 10-200 10-200
n 10 10
LODb / (ng L-1) 2.5 2.5
LOQc / (ng L-1) 5 5
Recovery ± RSDd / % 99.1 ± 0.7 103 ± 3.1
aLCR: linear calibration range; bLOD: limit of detection; cLOQ: limit
The robustness of the method was evaluated by varying instrument parameters such as column temperature and pressure. While temperature and pressure modifies retention times (differences up to 10%), integrated area values remain essentially unchanged. Hence, these parameters must be careful monitored in order not to affect reproducibility.
Analysis of wastewater samples
As shown in Figure 2, the fluorescence signal of an extracted sewage sample was very complex, even when an extended gradient system was adopted. A typical chromatogram of a pre-concentrated sewage sample is shown in Figure 4.
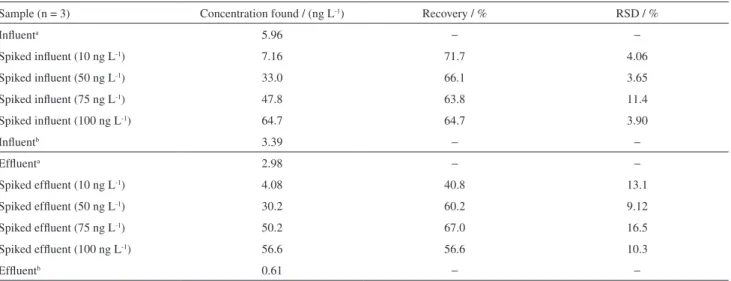
In most cases, chromatographic profile suggests the presence of E2 and the absence of EE2. Hence, standard addition studies from spiked sewage samples were carried
out and the results showed recoveries between 40 and 70% (Table 4). This is a remarkable result, once few works reported estrogens recovery from complex samples such wastewater. The low recovery obtained may be attributed to signal suppression of the matrix components. According to results summarized by Gabet et al.,51 the recovery of
estrogens differs considerably with the type of matrix. For this reason, this parameter should be determined with real samples, an operation that could be extremely difficult due to the unavailability of non-contaminated matrices. Recently, Pailler et al.52 developed an LC-MS/MS method for quantification of micropollutants in natural waters including both hormones studied in this work. The author obtained recoveries between 92 and 110% for E2 and EE2, and a matrix effect with moderate signal suppression ranged from −3 to −16% in relation to the signal registered for spiked deionized water. In most cases, matrix effects are the main challenge in quantitative analysis.19
In this work, EE2 was found below LOD in real samples. It was also observed an important matrix effect to EE2, with fluorescence signal suppression. However, the E2 concentration was determined directly by interpolation in analytical curves and by the standard addition system. The results shown in Table 4 are slightly different but have the same magnitude order. Considering the high sample complexity, standard addition method gave more realistic results, since matrix effects, which are a drawback of the HPLC-DAD (diode array detector) and HPLC-FLD methods, were corrected. The concentration of E2 is compatible with values reported in the recent literature,47,52 including some
works that use chromatographic methods assisted by mass detectors. Instead the low recovery obtained, the estrogens were successfully determined in real samples.
Figure 4. Detail of a typical fluorescence-based chromatogram of spiked and natural wastewater samples.
Table 4. Recovery of E2 from wastewater samples (influent and effluent) using direct interpolation and standard addition methods
Sample (n = 3) Concentration found / (ng L-1) Recovery / % RSD / %
Influenta 5.96 − −
Spiked influent (10 ng L-1) 7.16 71.7 4.06
Spiked influent (50 ng L-1) 33.0 66.1 3.65
Spiked influent (75 ng L-1) 47.8 63.8 11.4
Spiked influent (100 ng L-1) 64.7 64.7 3.90
Influentb 3.39 − −
Effluenta 2.98 − −
Spiked effluent (10 ng L-1) 4.08 40.8 13.1
Spiked effluent (50 ng L-1) 30.2 60.2 9.12
Spiked effluent (75 ng L-1) 50.2 67.0 16.5
Spiked effluent (100 ng L-1) 56.6 56.6 10.3
Effluentb 0.61 − −
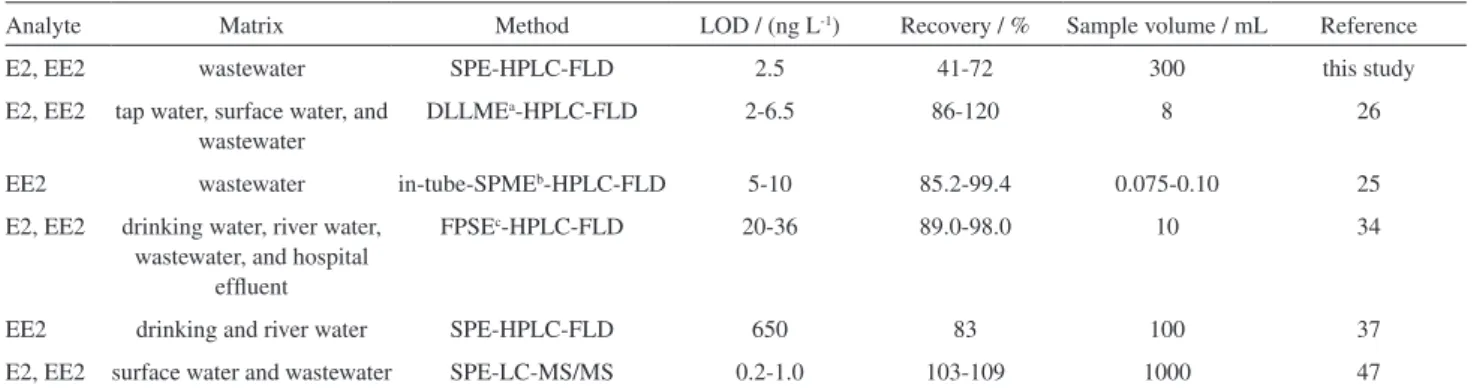
Comparing other procedures based on high-performance liquid chromatography and fluorescence detectors (Table 5), quantification limits of the same order of magnitude of this work and similar recoveries around between 83 and 120% were obtained for environmental samples.
Conclusions
A sensitive and accurate analytical method was developed for the simultaneous determination of estrogens in aqueous samples. The use of solid-phase extraction coupled with high-performance liquid chromatography with fluorescence detection achieved limits of quantification of 5.0 ng L-1 for E2 and EE2. The proposed method was
applied to the determination of trace amount of estrogens in influents and effluents from a wastewater treatment plant. Unfortunately, the low concentration of the estrogens and the severe interference of the matrix fluorescence hindered the quantification of EE2 even at fortified levels. Neverthless, E2 could be detected in real samples below the limit of quantification. The recoveries to spiked samples were between 41 and 72%, with relative standard deviations between 4 and 16%.
Acknowledgments
Financial support from the National Counsel of Technological and Scientific Development (CNPq) and Araucária Foundation (PR, Brazil) is gratefully acknowledged. We also thank Coordination for the Improvement of Higher Education Personnel (CAPES) for the scholarships.
References
1. Barreiros, L.; Queiroz, J. F.; Magalhães, L. M.; Silva, A. M. T.; Segundo, M. A.; Microchem. J.2016, 126, 243.
2. Schultz, M. M.; Minarik, T. A.; Martinovic-weigelt, D.; Curran, E. M.; Bartell, S. E.; Schoenfuss, H. L.; Environ. Int.2013, 61,
138.
3. Treviño, L. S.; Wang, Q.; Walker, C. L.; Trevi, L. S.; Reprod. Toxicol.2015, 54, 136.
4. Campbell, C. G.; Borglin, S. E.; Green, F. B.; Grayson, A.; Wozei, E.; Stringfellow, W. T.; Chemosphere2006, 65, 1265. 5. Al-Ansari, A. M.; Saleem, A.; Kimpe, L. E.; Sherry, J. P.;
McMaster, M. E.; Trudeau, V. L.; Blais, J. M.; Environ. Pollut.
2010, 158, 2566.
6. Reis Filho, R. W.; de Araújo, J. C.; Vieira, E. M.; Quim. Nova
2006, 29, 817.
7. USEPA CCL3, Water: Contaminant Candidate List 3; United States Environmental Protection Agency, 2009.
8. European Commission; European Community Directive 2000/60/EC of the European Parliament and of the Council of 23 October 2000 Establishing a Framework for Community Action in the Field of Water Policy; Official Journal of the
European Union: Brussels, 2000, L327, 1.
9. Kuster, M.; López de Alda, M. J.; Hernando, M. D.; Petrovic, M.; Martín-Alonso, J.; Barceló, D.; J. Hydrol.2008, 358, 112. 10. Pedrouzo, M.; Borrull, F.; Pocurull, E.; Marcé, R. M.; Water,
Air, Soil Pollut.2011, 217, 267.
11. Muz, M.; Sönmez, M. S.; Komesli, O. T.; Bakırdere, S.; Gökçay, C. F.; Analyst2012, 137, 884.
12. Vymazal, J.; Březinová, T.; Koželuh, M.; Sci. Total Environ.
2015, 536, 625.
13. Martinovic-Weigelt, D.; Minarik, T. A.; Curran, E. M.; Marchuk, J. S.; Pazderka, M. J.; Smith, E. A.; Goldenstein, R. L.; Miresse, C. L.; Matlon, T. J.; Schultz, M. M.; Schoenfuss, H. L.; Environ. Int.2013, 61, 127.
14. Nie, M.; Yang, Y.; Liu, M.; Yan, C.; Shi, H.; Dong, W.; Zhou, J. L.; Sci. Total Environ.2014, 487, 785.
15. Desbrow, C.; Routledge, E. J.; Brighty, G. C.; Sumpter, J. P.; Waldock, M.; Environ. Sci. Technol.1998, 32, 1549.
16. Stumpf, M.; Ternes, T. A.; Wilken, R.-D.; Rodrigues, S. V.; Aumann, W.; Sci. Total Environ.1999, 225, 135.
Table 5. Comparison of SPE-HPLC-FLD method developed with other methods for E2 and EE2 quantification in real samples
Analyte Matrix Method LOD / (ng L-1) Recovery / % Sample volume / mL Reference
E2, EE2 wastewater SPE-HPLC-FLD 2.5 41-72 300 this study
E2, EE2 tap water, surface water, and wastewater
DLLMEa-HPLC-FLD 2-6.5 86-120 8 26
EE2 wastewater in-tube-SPMEb-HPLC-FLD 5-10 85.2-99.4 0.075-0.10 25
E2, EE2 drinking water, river water, wastewater, and hospital
effluent
FPSEc-HPLC-FLD 20-36 89.0-98.0 10 34
EE2 drinking and river water SPE-HPLC-FLD 650 83 100 37
E2, EE2 surface water and wastewater SPE-LC-MS/MS 0.2-1.0 103-109 1000 47
17. Sodré, F. F.; Montagner, C. C.; Locatelli, M. F.; Jardim, W. F.;
J. Braz. Soc. Ecotoxicol.2007, 2, 187.
18. Moreira, M.; Aquino, S.; Coutrim, M.; Silva, J.; Afonso, R.;
Environ. Technol.2011, 32, 1409.
19. Torres, N. H.; Aguiar, M. M.; Ferreira, L. F. R.; Américo, J. H. P.; Machado, Â. M.; Cavalcanti, E. B.; Tornisielo, V. L.; Environ. Monit. Assess.2015, 187, 379.
20. López de Alda, M. J.; Barceló, D.; J. Chromatogr. A2001, 938,
145.
21. Ciofi, L.; Fibbi, D.; Chiuminatto, U.; Coppini, E.; Checchini, L.; Del Bubba, M.; J. Chromatogr. A2013, 1283, 53. 22. Chen, W.; Xue, M.; Xue, F.; Mu, X.; Xu, Z.; Meng, Z.; Zhu,
G.; Shea, K. J.; Talanta2015, 140, 68.
23. Silva, A. R. M.; Portugal, F. C. M.; Nogueira, J. M. F.;
J. Chromatogr. A2008, 1209, 10.
24. Ma, X.; Li, Q.; Yuan, D.; Talanta2011, 85, 2212.
25. Aufartová, J.; Torres-Padrón, M. E.; Sosa-Ferrera, Z.; Solich, P.; Santana-Rodríguez, J. J.; Int. J. Environ. Anal. Chem.2012,
92, 382.
26. Lima, D. L. D.; Silva, C. P.; Otero, M.; Esteves, V. I.; Talanta
2013, 115, 980.
27. Guedes-Alonso, R.; Sosa-Ferrera, Z.; Santana-Rodríguez, J. J.; Santana-Rodríguez, J. J.; J. Anal. Methods Chem.2013, 2013, 1.
28. Guo, F.; Liu, Q.; Qu, G.; Song, S.; Sun, J.; Shi, J.; Jiang, G.;
J. Chromatogr. A2013, 1281, 9.
29. Patrolecco, L.; Ademollo, N.; Grenni, P.; Tolomei, A.; Barra Caracciolo, A.; Capri, S.; Microchem. J.2013, 107, 165.
30. Verbinnen, R. T.; Nunes, G. S.; Vieira, E. M.; Quim. Nova2010,
33, 1837.
31. Gañán, J.; Pérez-Quintanilla, D.; Morante-Zarcero, S.; Sierra, I.; J. Hazard. Mater.2013, 260, 609.
32. Machado, K. S.; Cardoso, F. D.; Azevedo, J. C. R.; Braga, C. B.; Acta Sci. Technol.2014, 36, 421.
33. Lisboa, N. S.; Fahning, C. S.; Cotrim, G.; dos Anjos, J. P.; de Andrade, J. B.; Hatje, V.; da Rocha, G. O.; Talanta2013, 117,
168.
34. Kumar, R.; Gaurav; Heena; Malik, A. K.; Kabir, A.; Furton, K. G.; J. Chromatogr. A2014, 1359, 16.
35. Kozłowska-Tylingo, K.; Konieczka, P.; Gustaw, E.; Wasik, A.; Namieśnik, J.; Anal. Lett.2014, 47, 1449.
36. Lopes, L. G.; Marchi, M. R. R.; Souza, J. B. G.; Moura, J. A.; Lorenzon, C. S.; Cruz, C.; Amaral, L. A.; Quim. Nova2010,
33, 639.
37. Melo, S. M.; Brito, N. M.; Water, Air, Soil Pollut.2014, 225,
1783.
38. de Liz, M. V.; Nagata, N.; Peralta-Zamora, P.; Quim. Nova2012,
35, 1213.
39. Girotto, G.; Nogueira, K. L.; Moura, J. A.; Souza, J. B.; Giacometti, L. L.; Marchi, M. R. R.; Tognolli, J. O.; Eclet. Quim.2007, 32, 61.
40. Thompson, M.; Ellison, S. L. R.; Wood, R.; Pure Appl. Chem.
2002, 74, 835.
41. ICH; ICH Harmonised Tripartite Guideline. Validation of Analytical Procedures: Text and Methodology Q2(R1); 2005.
42. Schäfer, A. I.; Akanyeti, I.; Semião, A. J. C.; Adv. Colloid Interface Sci.2011, 164, 100.
43. Liu, M.; Lai, E. P. C.; Yang, Y.; Int. J. Recent Res. Appl. Stud.
2012, 11, 67.
44. Neale, P. A.; Pronk, W.; Shäfer, A. I.; Environ. Eng. Sci.2009,
26, 1157.
45. Liska, I.; J. Chromatogr. A2000, 885, 3.
46. López de Alda, M. J.; Barceló, D.; J. Chromatogr. A2000, 892,
391.
47. Sodré, F. F.; Pescara, I. C.; Montagner, C. C.; Jardim, W. F.;
Microchem. J.2010, 96, 92.
48. Shrivastava, A.; Gupta, V.; Chron. Young Sci.2011, 2, 21.
49. González, A. G.; Herrador, M. Á.; Asuero, A. G.; Talanta2010,
82, 1995.
50. Montagner, C. C.; Jardim, W. F.; J. Braz. Chem. Soc.2011, 22, 1452.
51. Gabet, V.; Miège, C.; Bados, P.; Coquery, M.; TrAC - Trends Anal. Chem.2007, 26, 1113.
52. Pailler, J.-Y.; Krein, A.; Pfister, L.; Hoffmann, L.; Guignard, C.; Sci. Total Environ.2009, 407, 4736.