Article
Printed in Brazil - ©2017 Sociedade Brasileira de Química0103 - 5053 $6.00+0.00*e-mail: [email protected]
Antimicrobial Screening of Endophytic Fungi Isolated from the Aerial Parts
of Paepalanthus chiquitensis (Eriocaulaceae) Led to the Isolation of Secondary
Metabolites Produced by Fusarium fujikuroi
Felipe Hilário,a Vanessa M. Chapla,b Angela R. Araujo,b Paulo T. Sano,c Taís M. Bauaba
and Lourdes C. dos Santos*,b
aDepartamento de Ciências Biológicas, Faculdade de Ciências Farmacêuticas,
Universidade Estadual Paulista (UNESP), 14800-903 Araraquara-SP, Brazil
bDepartamento de Química Orgânica, Instituto de Química,
Universidade Estadual Paulista (UNESP), 14800-060 Araraquara-SP, Brazil
cDepartamento de Botânica, Instituto de Biociências, Universidade de São Paulo (USP),
05508-090 São Paulo-SP, Brazil
The screening for antimicrobial activity of twenty five endophytic fungi isolated from the aerial parts of Paepalanthus chiquitensis (Eriocaulaceae) was assayed against the bacteria Gram-positive Staphylococcus aureus, Gram-negative Escherichia coli and Salmonella setubal, and the yeast fluconazole-resistant Candida albicans. The ethyl acetate extract produced by Fusarium fujikuroi was the most bioactive and this fungus was chosen for the chemical study, affording the isolation of an alkaloid 2-(4-butylpicolinamide) acetic acid and three known metabolites: fusaric acid, indole acetic acid and the sesterterpene terpestacin. The minimal inhibitory concentration of the extract and of fusaric acid and indole acetic acid for all the tested microorganisms had values from 125 to 1000 µg mL-1.
Keywords: Fusarium fujikuroi, endophytic fungi, antimicrobial activity, Paepalanthus chiquitensis
Introduction
The Paepalanthus chiquitensis Herzog (synonym
Paepalanthus giganteus Sano)1 represents one of the 1200
species belonging to the Eriocaulaceae. Paepalanthus is the
largest genus of this family with approximately 500 species,
of which more than 400 exist only in Brazil.2 Species of this
family represent an important source of income for rural communities, especially in the Jalapão region. The coils of Syngonanthus nitens scapes together with buriti palm strips are used to make traditional handcrafts, acessories
and other decorative items.3
Endophytic fungi are defined as fungi that live
asymptomatically within the tissues of higher plants.4
They are a rich source of secondary metabolites with
novel structures and biomedical potential.5 There is only
one study of endophytes isolated in the Eriocaulaceae.6
Among the endophytes that have been described so far,
there are many Fusarium species7 which are interesting in
the production of bioactive secondary metabolites as well as a source of a variety of chemical structures.
The Fusarium species are able to produce mycotoxins, including the phytotoxic fusaric acid, which may be a component in the pathogenicity of some biotypes of the
Fusarium.7 Contrarily, the class of chemical compounds
called auxin, which are phytohormones and promoters of plant growth can be produced by fungal endophytes as well,
for example the Fusarium tricinctum.8
Herein, we report the antimicrobial screening used as
a tool to select the endophytic fungus of P. chiquitensis.
The investigation of the EtOAc extract resulted in the isolation and structure elucidation of four metabolites
produced by F. fujikuroi: fusaric acid (1), indole acetic
acid (2), 2-(4-butylpicolinamide) acetic acid (3) and the
sesterterpene terpestacin (4). Furthermore, the antibacterial
and antifungal activities of the EtOAc extract and major
Experimental
General experimental procedures
Infrared (IR) spectrum was obtained using a Thermo Scientific Nicolete iS5 FT-IR 17 spectrometer. Circular dichroism (CD) J-815 of Jasco. The nuclear magnetic
resonance (NMR) analyses 1D and 2D experiments of the
secondary metabolites were obtained on Bruker FOURIER 300 MHz and on Bruker AVANCE III 600 MHz (Bruker, Switzerland) spectrometers using the non-deuterated residual solvent signal as a reference. The high resolution mass spectra were recorded on a Q-TOF Bruker MaXis
ImpactTM mass spectrometer with a direct insertion device
in the sample-injection analysis continuous flow of
3.0 µL min-1. The samples were solubilized in MeOH:H
2O
(1:1, v/v) and were ionized by electrospray (ESI) in negative or positive mode. The analyses of the tandem mass spectrometry (MS/MS) were performed by a Mass Spectrometer 3200 QTrap LC/MS/MS (linear ion trap quadrupole mass spectrometer), AB Sciex Instruments operating in a positive mode and turbo ion spray ionization. The analyses were carried out by direct infusion using an
automatic serynge in a 10.0 µL min-1 flow at 0.6 ppm in
MeOH:H2O (1:1, v/v, containing 0.1% formic acid). The
spectra were obtained in the following conditions: ionspray: 5500 V; gas 1:17 psi; declustering potential: 25 V; entrance potential: 10 V and collision energy: 35 V.
Thin layer chromatography (TLC) analyses were performed using a Sorbent Technologies silica gel 60. Spots on the TLC plates were visualized under UV light
and by being sprayed with an anisaldehyde - H2SO4 reagent
followed by heating at 130 °C. The chromatographic column was performed on Sephadex LH-20 (Pharmacia Biotech, Sweden).
Analytical high performace liquid chromatography (HPLC) was performed on a Jasco (Tokyo, Japan) equipped with a photodiode array (PDA) detector. The analytical column used was the Phenomenex Luna (2) RP18 (250.0 × 4.6 mm i.d.; 5 µm). Semi-preparative HPLC was performed on a Jasco (Tokyo, Japan) equipped with a MD-2010 PDA detector, using a Phenomenex Luna (2) RP18 column (250 × 10 mm i.d.; 10 µm), at a flow rate of
3.0 mL min-1. The HPLC-grade acetonitrile was purchased
from JT Baker (Baker Mallinckrodt, Phillipsburg, NJ, USA). HPLC-grade water was prepared with a Millipore (Bedford, MA, USA) Milli-Q purification system.
Plant material
The aerial parts of P. chiquitensis (capitulae, scapes, and
leaves) were collected in February, 2012, in Serra do Cipó, in the Minas Gerais State, Brazil, geographical coordinates of 19°14’58.92’’S, 43°31’04.40’’W, and authenticated by Prof Dr Paulo Takeo Sano from Universidade de São Paulo (USP), Brazil. A voucher specimen (3402 SPF) was deposited at the Herbarium of the IB-USP.
Fungal isolation and identification
The endophytic fungi were isolated from healthy aerial
parts of P. chiquitensis which were subjected to surface
sterilization. The capitulae, scapes, and leaves were first washed with water and soap and immersed in a 70% aqueous ethanol (EtOH) for 1 min, 1% aqueous sodium hypochlorite solution for 2 min and 70% aqueous EtOH for 1 min. Finally,
the vegetal material was immersed in sterile H2O for 2 min.
The sterilized material was cut into 2 × 2 cm pieces and deposited onto a Petri dish containing PDA (potato dextrose
agar) and gentamicin sulfate (100 µg mL-1). Single fungal
strains were obtained following serial transfers on PDA plates and then deposited at the NuBBE fungi collection
in Araraquara, Brazil (stored in sterile water at 25 °C).9,10
Fungal identification was carried out through the DNA extracted and the internal transcribed spacer (ITS) region sequence amplified. The sequence data obtained from the fungal strain was deposited into GenBank. The
phylogenetic tree and the phylogenetic analyses11 were
made in MEGA 6.06.
Fungal growth and extraction
The endophytic fungi isolated from aerial parts of
P. chiquitensis grew up on a solid culture PDA for 14 days. Small pieces of a solid medium PDA from the Petri dish containing biomass were used to inoculate each fungus into three Erlenmeyer flasks (500 mL), each containing 300 mL of liquid culture PDB (potato dextrose broth). The medium was autoclaved at 125 °C for 15 min. After cooled, the medium was inoculated with the endophyte and incubated at 25 °C in static mode for 28 days. The mycelia were separated from the liquid cultures by filtration using filter paper. The filtered were extracted with EtOAc (3 × 1/3 volume filtered). The organic layers were combined and
washed with distilled H2O (3 × 1/5 volume filtered), the
remaining water was removed by the drying agent MgSO4,
and the solid was removed by filtration. The solvent was removed under reduced pressure yielding twenty-five
EtOAc extracts. Besides, the F. fujikuroi grew at a
Fractionation and isolation
The EtOAc extract (680 mg) obtained from a
large-scale culture of F. fujikuroi was dissolved in 100% MeOH
(3 mL) and twice centrifuged for 8 min at 3500 rpm. The combined supernatants were fractionated on a Sephadex LH-20 (Pharmacia) column (85.0 × 2.5 cm) and eluted with 100% MeOH affording 78 fractions (10 mL each) which were analyzed by silica gel TLC eluted with
(CHCl3/MeOH/n-PrOH/H2O, 5:6:1:4, v/v/v/v, organic
phase). The spots were visualized under UV light at 254 nm
and anisaldehyde-H2SO4.
The fractions of the Sephadex LH-20 Fr A (74 mg), Fr B (144 mg) and E (124 mg) were separated by semi-preparative HPLC-PDA Jasco PU 2086 series pump systems equipped with a Jasco MD-2010 PDA detector and Chromnav software, using a Rheodyne 500 µL manual
injector loop, at a flow rate of 3.0 mL min−1. The mobile
phase consisted of H2O (eluent A) and acetonitrile (eluent
B), both containing 0.01% TFA (trifluoracetic acid). The isocratic mode was used to purify the fraction Fr. E (38%
B for 30 min, λ 270 nm) yielding the pure compound (2)
(Rt = 21.93 min, 24.0 mg). The gradient mode was used to
purify the fraction Fr. A (10-100% B for 30 min, λ 270 nm)
affording the compound (1) (Rt = 15.93 min, 12.0 mg);
the fraction B (38-100% B for 30 min, λ 270 nm) yielding
the compounds (3) (Rt = 26.80 min, 1.0 mg) and (4)
(Rt = 35.80 min, 3.0 mg).
All the substances isolated were analyzed by analytical HPLC performed on a Jasco (Tokyo, Japan) equipped with a PU-2089 quaternary solvent pump with degasser, a MD-2010 DAD detector, and a Rheodyne AS-2055 sample injector with a 100 µL sample loop. The analytical column was a Luna (2) RP18 (Phenomenex, Luna (2), 250.0 × 4.6 mm i.d.; 5 µm) equipped with a Phenomenex security guard column (4.0 × 3.0 mm i.d.). The composition
of mobile phases was H2O (eluent A) and ACN (eluent B),
both solvents containing 0.01% TFA (exploratory gradient
run, 60 min, λ 270 nm).
Antibacterial activity and minimum bactericidal concentration (MBC)
The evaluation of the antibacterial activity and the minimal inhibitory concentration (MIC) was determined by the broth microdilution method, as described in the M7-A6 reference guideline of the Clinical and Laboratory
Standards Institute.12 The biological activity was evaluated
against E. coli (ATCC 25922), S. aureus (ATCC 25923) and
S. setubal (ATCC 19196). They were incubated in Muller-Hinton broth (MHB) for 24 h at 37 °C. These inoculums
were standardized at 1.0 × 10⁸ CFU mL-1 (corresponding to
0.5 McFarland standards) by adjusting the optical density to 0.10-0.15 at 620 nm.
The assay was carried out in 96-well microplates
containing 80 µL of MHB. The extracts and the substances 1
and 2 were dissolved in DMSO:H2O (2:8, v/v) to initial
concentration of 2000 µg mL-1. A two-fold serial dilution
was made in order to obtain concentration ranges of
7.8-1000 µg mL-1. As positive control ampicillin was used
and DMSO:H2O (2:8, v/v) as negative control. The plates
were incubated at 37 °C for 24 h. The assay was displayed in triplicate. The MIC of the samples was detected after the
addition of 30 µL of the resazurin solution (100 µg mL-1),
incubated at 37 °C for 2 h. The growth of bacteria changes the blue dye resazurin into a pink color. The pink color indicates positive growth, whereas the blue indicates growth inhibition.
The MIC was defined as the lowest sample concentration which prevented this change and exhibited inhibition of microorganism growth. For the determination of minimum bactericidal concentration (MBC), a portion from each well that showed antibacterial activity was plated on Muller-Hinton agar and incubated at 37 °C for 24 h. The lowest concentration that showed no bacteria growth in the
subcultures was used as the MBC.13
Antifungal activity and minimum fungicidal concentration (MFC)
The evaluation of the antifungal activity and the MIC were determined by the broth microdilution method, as described in the M27-A3 reference guideline of the Clinical
and Laboratory Standards Institute,14 with modifications.15
The biological activity was evaluated against the
fluconazole-resistant C. albicans (ATCC 10231). The yeast
strain was incubated in 100 µL of RPMI 1640 (adjusted
to pH 7.0 with 3-(N-morpholino) propanesulfonic acid
(MOPS) buffer, 0.165 mol L-1) for 48 h at 37 °C. The
inoculum of yeast was standardized at 5.0 × 10⁶ CFU mL-1
(corresponding to 0.5 McFarland standards) by adjusting the optical density to 0.12-0.15 at 530 nm.
The assay was carried out in 96-well microplates containing 100 µL of RPMI 1640. The extracts and the
substances 1 and 2 were dissolved in 20% DMSO and water
to initial concentration of 2000 µg mL-1. Then, a two-fold
serial dilution was made in order to obtain concentration
ranges of 7.8-1000 µg mL-1. As positive controls were
used fluconazole and amphotericin B and the DMSO:H2O
of 20 µL of triphenyl-tetrazolium chloride (TTC) solution
(0.02 g mL-1), and after that incubated at 37 °C for 2 h. Yeast
growth changes the colorless TTC to a red color.
MIC was defined as the lowest sample concentration that prevented this change and exhibited inhibition of microorganism growth. For the determination of minimal fungicidal concentration (MFC), a portion from each well that showed antifungical activty was plated on Sabouroud agar and incubated at 37 °C for 48 h. The lowest concentration that demonstrate no yeast growth in
the subcultures was used as the MFC.13
Results and Discussion
The screening for antimicrobial activity was used as a bioassay-guided strategy to select the most active among the twenty-five EtOAc extracts prepared from endophytic
fungi isolated from the aerial parts of P. chiquitensis.
The MIC was evaluated against four human pathogenic
microorganisms: S. aureus, E. coli, S. setubal and
C. albicans (Table 1).
Overall, the EtOAc extracts demonstrated antimicrobial
activity with an MIC value of 1000 µg mL-1 or above
this concentration (data not displayed). However, only one EtOAc showed moderate activity against all the four
tested microorganisms. The MIC values were 500 µg mL-1
for E. coli and S. setubal, 250 µg mL-1 for S. aureus and
1000 µg mL-1 for the yeast fluconazole-resistant C. albicans.
The literature does not provide a consensus in terms
of the MIC values obtained for natural products.16 These
authors considered the MIC for plants extract with values
lower than 500 µg mL-1 as being potent inhibitors, MIC
between 600 and 1500 µg mL-1 to be moderate inhibitors
and MIC above 1600 µg mL-1 to be weak inhibitors. In
another literature,17 a satisfactory MIC values equal to
or less than 1000 µg mL-1 was established. However,
Ramos et al.18 considered the MIC with values below the
concentration of 1000 µg mL-1 as being representative when
investigating the antifungal potential of the methanolic
extract of the scapes from S. nitens against ATCC and
clinical trains of Candida krusei.
Even though the major compounds 1 and 2 do not
show significant biological activities, there are currently a few articles available to describe their antimicrobial activities. Among these interesting works, we can cite
one with fusaric acid 1, in which the antimycobacterial
activity of copper ion complex and cadmium ion complex
of (1) against M. tuberculosis H37Rv strain is shown, and
the MIC value was 10 µg mL-1.19 Besides this, in another
work, the indole acetic acid complexes were described by
Punitha et al.20 in which the antimicrobial activity against
the strains of S. aureus and Aspergillum niger (A. niger) is
displayed using the agar well diffusion technique. On this, it was found that the metal complexes of IAA (indole acetic acid) are more active than the free ligand against both the bacterial and fungal organisms tested.
The fungal strain isolated from P. chiquitensis was
identified and the ITS sequence showed similarity of
99.0% with the Fusarium fujikuroi (KJ000432.1). The
phylogenetic tree is shown in Figure 1, as well as the comparison among closely related fungal strains with the
F. fujikuroi.
The large scale cultivation of F. fujikuroi afforded the
EtOAc extract used for the fractionation and isolation of the secondary metabolites. The major secondary
metabolites (1) showed MIC of 250 µg mL-1 for all the
microorganisms tested, while the compound 2 displayed
MIC values of 500 µg mL-1 for S. setubal, 250 µg mL-1
for E. coli and S. aureus. The best MIC was for the
fluconazole-resistant C. albicans (125 µg mL-1). In
addition, the results for the MBC and MFC for the EtOAc extract showed bactericidal and fungicidal activities
(1000 µg mL-1). The compound 2 showed MBC of
500 µg mL-1 for E. coli and 1000 µg mL-1 for S. setubal.
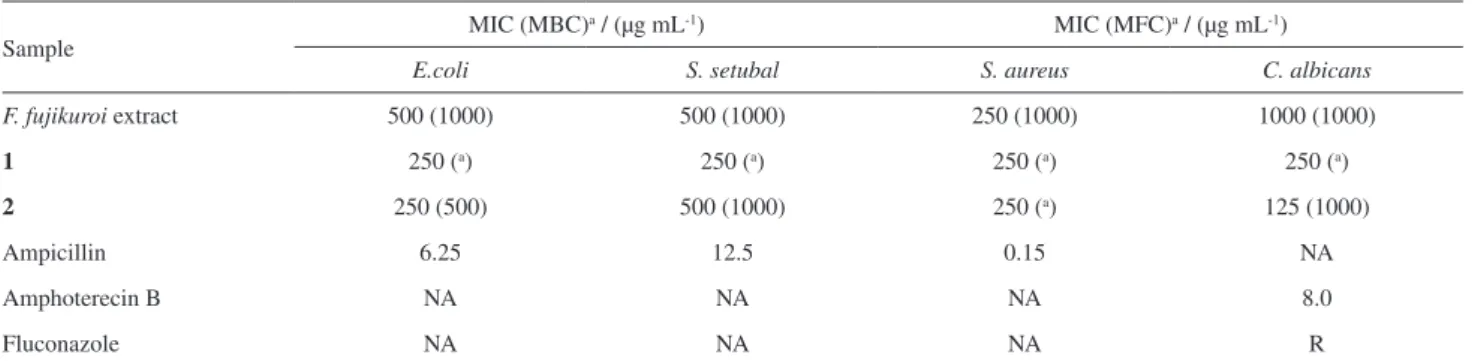
Table 1. Antimicrobial activity of the EtOAc extract and of the major compounds 1 and 2
Sample
MIC (MBC)a / (µg mL-1) MIC (MFC)a / (µg mL-1)
E.coli S. setubal S. aureus C. albicans
F. fujikuroi extract 500 (1000) 500 (1000) 250 (1000) 1000 (1000)
1 250 (a) 250 (a) 250 (a) 250 (a)
2 250 (500) 500 (1000) 250 (a) 125 (1000)
Ampicillin 6.25 12.5 0.15 NA
Amphoterecin B NA NA NA 8.0
Fluconazole NA NA NA R
aMinimal inhibitory concentration (MIC) > 1000.0 µg mL-1. MBC: minimum bactericidal concentration; MFC: minimum fungicidal concentration;
The compound 1 showed a value higher than 1000 µg mL-1,
indicating then bacteriostatic and fungistatic behavior of this compound for all strains tested.
Figure 2 presents the chemical structures of the isolated
compounds 1,212,22,23 and 424 by chromatographic methods
and the HPLC-PDA chromatogram of the EtOAc extract of F.fujikuroi.
Compound 3 was obtained as an amorphous powder. The
UV spectra showed the λ
max in 232 and 272 nm, suggesting
the presence of a pyridine ring. The ESI-QTOF-HRMS
analysis exhibited an ion at m/z 237.1239 [M + H]+
(calcd. 237.1237) evidencing the molecular formula
C12H16N2O3. The ESI-QTrap-MS/MS spectrum showed
fragmentation ions at m/z 191 [M – 46 + H]+, m/z 180
[M – 57 + H]+, m/z 162 [M – 57 – 18 + H]+, m/z 134
[M – 57 – 18 – 28 + H]+. The fragmentation scheme
proposed to the compound 3 is shown in Figure 3.
The 1H NMR spectrum showed three hydrogen aromatic
signals at d 8.37 (brs, H-3), 8.05 (brs, H-6) and 7.60 (brs,
H-5). It is also evident the signals of methyl group at
d 0.92 (t, H-10). Furthermore, four methylene hydrogens
were observed at d 4.09 (H-4), 2.65 (H-7), 1.59 (H-8) and
1.34 (H-9). A broad singlet was observed at d 8.50 (N-1)
as well, suggesting the presence of a hydrogen bonded with nitrogen (Table 2). In the heteronuclear single quantum
correlation (HSQC)-15N-1H NMR was confirmed the
nitrogen value at d 100.
The 1H-1H COSY (correlation spectroscopy) spectrum
showed correlation between the aromatic hydrogens at
d 8.05 (H-6) and at 7.60 (H-5). The spectrum showed
the coupling of methylene hydrogens of the aliphatic
side-chain at d (2.65 ↔ 1.59 ↔ 1.34 ↔ 0.92) and the
H-4’ at d 4.09 and the hydrogen bonded with nitrogen
H-3’ at d 8.50.
The 13C and HSQC NMR data of 3 confirmed the
presence of 12 carbons corresponding to 5 aromatic
carbons, including two quaternary sp2 carbons (C-2, C-4),
four methylene (C-4’, C-7, C-8, C-9), one nitrogen bonded to hydrogen (N-3’) and two carbonyl groups (C-2’, C-5’).
The heteronuclear multiple bond correlations (HMBC) from H-7 to C-3 and C-5 connected the aliphatic side chain to the pyridine ring C-4.
Figure 1. Phylogenetic tree of the fungus FZ04 based on the15.8S ribosomal RNA gene.
The fusaric acid (1) is biosynthesized from acetate units and aspartate, which is a derivative of the picolinic acid
(2-pyridine carboxylic acid).25 The glycine (amino acetic
acid) has the molecular formula NH2CH2COOH and is
the simplest amino acid, optically inactive and exist as a
zwitterion in solution.26
The chemical structure of the compound 3 can be the
combined product of the junction of the 4-butyl-picolinic acid with the glycine resulting in its acidic and basic caractheristics present.
The IR spectrum of the compound 3 displayed the
stretching vibrations of carboxylic anion, ranging from
1545-1362 cm−1 and 1407-1362 cm−1. It exists as a dipolar
ion in which carboxyl group is present as a carboxylate
ion. Because this compound does not show cotton effect in the analysis by circular dichroism (CD), we suggested that the chemical structure of the glicine is bonded to 2-hydroxyoxazolidinone. Finally, the data confirmed that
3 is the 2-(4-butylpicolinamide) acetic acid (Figure 4).
Conclusions
The screening for antimicrobial activity against four human microbial pathogenic strains led to the isolation and identification of four secondary metabolites. The
alkaloid 2-(4-butylpicolinamide) acetic acid (3) is reported
for the first time in the literature. These findings also showed the isolation and determination of the known
compounds fusaric acid (1) and the auxin indole acetic
acid (2). The other known compound isolated was a
sesterterpene known as terpestacin (4). The EtOAc
extract and the compounds 1 and 2 displayed moderate
antimicrobial activity for all the bacterial strains evaluated.
Furthermore, the compound 2 showed activity against the
fluconazole-resistant C. albicans. This is the first ever
report of endophytic fungi isolated from P. chiquitensis
(Eriocaulaceae) and their antimicrobial activity.
Supplementary Information
Supplementary information (1H and 13C NMR and MS
spectra for the isolated compounds 1-4) is available free
of charge at http://jbcs.sbq.org.br as PDF file.
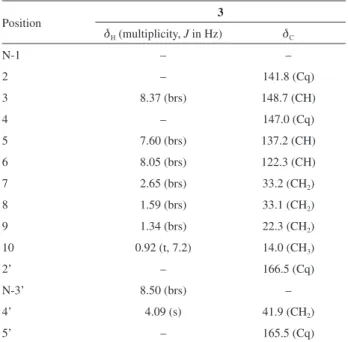
Table 2.1H and 13C NMR data of compound (3) in CDCl
3 (d in ppm at
600 and 150 MHz, respectively)
Position 3
dH (multiplicity, J in Hz) dC
N-1 – –
2 – 141.8 (Cq)
3 8.37 (brs) 148.7 (CH)
4 – 147.0 (Cq)
5 7.60 (brs) 137.2 (CH)
6 8.05 (brs) 122.3 (CH)
7 2.65 (brs) 33.2 (CH2)
8 1.59 (brs) 33.1 (CH2)
9 1.34 (brs) 22.3 (CH2)
10 0.92 (t, 7.2) 14.0 (CH3)
2’ – 166.5 (Cq)
N-3’ 8.50 (brs) –
4’ 4.09 (s) 41.9 (CH2)
5’ – 165.5 (Cq)
d: chemical shift; J: coupling constant.
Figure 3. The fragmentation scheme proposed to the compound 3 by ESI-QTrap-MS/MS.
Acknowledgments
The authors gratefully acknowledge the financial support of Fundação de Amparo à Pesquisa do Estado de São Paulo (FAPESP) which provided a fellowship for F. H. (grant No. 2013/12564-6) and a project for L. C. S. (grant No. 2015/04899-3) and T. M. B. (grant No. 2013/25432-0). We also thank the Conselho Nacional de Desenvolvimento Científico e Tecnológico (CNPq) for grants for V. M. S., A. R. A., T. M. B. and L. C. S. The BPI (Biotecnologia Pesquisa e extensão) which collaborated with the fungal strain identification and phylogenetic tree and Prof Dr Marcelo Trovó Lopes de Oliveira for providing the photo of P. chiquitensis are also acknowledged.
References
1. Trovó, M.; Sano, P. T.; Phytotaxa2010, 14, 49.
2. Giulietti, A. M.; Hensold, N.; Parra, L. R.; de Andrade, M. J. G.; Van Den Berg, C.; Harley, R. M.; Phytotaxa2012, 60, 50. 3. Pacifico, M.; Napolitano, A.; Masullo, M.; Hilario, F.; Vilegas,
W.; Piacente, S.; dos Santos, L. C.; Ind. Crops Prod.2011, 33, 488.
4. Kharwar, R. N.; Mishra, A.; Gond, S. K.; Stierle, A.; Stierle, D.; Nat. Prod. Rep.2011, 28, 1208.
5. Wei, H.; Xu, Y. M.; Espinosa-Artiles, P.; Liu, M. X.; Luo, J. G.; U’Ren, J. M.; Arnold, A. E.; Gunatilaka, A. A. L.; Phytochemistry2015, 118, 102.
6. Amorim, M. R.; Somensi, A.; Araujo, A. R.; Bauab, T. M.; J. Braz. Chem. Soc.2016, 6, 1048.
7. Stipanovic, R. D.; Wheeler, M. H.; Puckhaber, L. S.; Liu, J.; Bell, A. A.; Williams, H. J.; J. Agric. Food Chem.2011, 59, 5351.
8. Khan, A. R.; Ullah, I.; Waqas, M.; Shahzad, R.; Hong, S.-J.; Park, G.-S.; Jung, B. K.; Lee, I.-S.-J.; Shin, J.-H.;World J. Microbiol. Biotechnol.2015, 31, 1461.
9. Chapla, V. M.; Zeraik, M. L.; Ximenes, V. F.; Zanardi, L. M.; Lopes, M. N.; Cavalheiro, A. J.; Silva, D. H. S.; Young, M. C. M.; da Fonseca, L. M.; Bolzani, V. S.; Araújo, A. R.; Molecules
2014, 19, 6597.
10. Silva, G. H.; Teles, H. L.; Zanardi, L. M.; Marx Young, M. C.; Eberlin, M. N.; Hadad, R.; Pfenning, L. H.; Costa-Neto, C. M.; Castro-Gamboa, I.; Bolzani, V. S.; Araújo, A. R.; Phytochemistry2006, 67, 1964.
11. Tamura, K.; Peterson, D.; Peterson, N.; Stecher, G.; Nei, M.; Kumar, S.; Mol. Biol. Evol.2011, 28, 2731.
12. Clinical and Laboratory Standards Institute (CLSI); Methods for Dilution Antimicrobial Susceptibility Tests for Bacteria that
Grow Aerobically, 6th ed., Document M7-A6; CLSI: Wayne,
2006.
13. Araújo, M. G. F.; Hilário, F.; Nogueira, L. G.; Vilegas, W.; dos Santos, L. C.; Bauab, T. M.; Molecules2011, 16, 10479. 14. Clinical and Laboratory Standards Institute (CLSI); Reference
Method for Broth Dilution Antifungal Susceptibility Testing of
Yeasts, Document M27-A3; CLSI: Wayne, 2008.
15. Duarte, M. C. T.; Figueira, G. M.; Sartoratto, A.; Rehder, V. L. G.; Delarmelina, C.; J. Ethnopharmacol.2005, 97, 305. 16. Webster, D.; Taschereau, P.; Belland, R. J.; Sand, C.; Rennie,
R. P.; J. Ethnopharmacol. 2008, 115, 140.
17. Aligiannis, N.; Kalpotzakis, E.; Mitaku, S.; Chinou, I. B.; J. Agric. Food Chem. 2001, 49, 4168.
18. Ramos, M. A. S.; Calixto, G.; Toledo, L. G.; Bonifácio, B. V.; Santos, L. C.; Almeida, M. T. G.; Chorilli, M.; Bauab, T. M.; Int. J. Nanomed. (online) 2015, 10, 7455.
19. Pan, J. H.; Chen, Y.; Huang, Y. H.; Tao, Y. W.; Wang, J.; Li, Y.; Lin, Y. C.; Arch. Pharm. Res. 2011, 34, 1177.
20. Punitha, J. T.; Ananthalakshmi, S.; Gowri, M.; Anu, M.; Int. J. Pharm. Life Sci.2013, 46, 2746.
21. Yin, E. S.; Rakhmankulova, M.; Kucera, K.; de Sena Filho, J. G.; Portero, C. E.; Narváez-Trujillo, A.; Holley, S. A.; Strobel, S. A.; Biometals2015, 28, 783.
22. Chimatadar, S. A.; Basavaraj, T.; Nandibewoor, S. T.; Russ. J. Phys. Chem. A2007, 81, 1046.
23. Wang, C. H.; Zhang, Y.; Jiang, M. M.; Chem. Nat. Compd.2014, 49, 1177.
24. Oka, M.; Iimura, S.; Narita, Y.; Furumai, T.; Konishi, M.; Oki, T.; Gao, Q.; Kakisawa, H.; J. Org. Chem.1993, 58, 1875. 25. Ghannam, I. A. Y.; Roaiah, H. F.; Hanna, M. M.; El-Nakkady,
S. S.; Cox, R. J.; Int. J. Pharm. Technol. 2014,6, 6528. 26. Ambujam, K.; Selvakumar, S.; Prem Anand, D.; Mohamed, G.;
Sagayaraj, P.; Crys. Res. Technol. 2006, 41, 671.
Submitted: July 27, 2016