LONG TERM FISH ASSEMBLAGES AS UNITS OF MANAGEMENT IN A
TEMPERATE ESTUARY (RIO DE LA PLATA - SW ATLANTIC OCEAN)
María Inés Lorenzo1 *, Juan M. Díaz de Astarloa2,Walter Norbis1 and María B. Cousseau 2
1Dirección Nacional de Recursos Acuáticos (DINARA)
Departamento de Biología Poblacional (Constituyente 1497, C.P: 11200. Montevideo, Uruguay)
2Universidad Nacional de Mar del Plata, Facultad de Ciencias Exactas y Naturales
Departamento de Ciencias Marinas, CONICET, Funes 3350, Mar del Plata, Argentina.
A
B S T R A C TDemersal fish assemblages from trawl surveys in the Rio de la Plata estuary and its inner continental shelf were analyzed from 1975 to 1995. The first two factors of Principal Component Analysis explained 48% of the variance in species distribution, and they are consistent with the results of a cluster analysis. The analysis indicated the existence of three spatially and temporally distinct fish assemblages: internal and external estuarine and inner continental shelf (Uruguayan coastal assemblages). These assemblages were persistent considering the environmental characteristics and their species composition. Despite the changes registered in the species density during the period surveyed, the fish assemblages tend to persist over time. It was demonstrated that the assemblages can be considered as open systems and that there exists a reciprocal flow of organisms between adjacent associations. However, each assemblage showed high spatial and temporal persistence in accordance with the environmental characteristics of the system analyzed. Therefore, and according to the multispecies fisheries operating in the system, each assemblage defined could be considered a unit of management.
R
E S U M OForam analisadas as associações dos peixes demersais provenientes de arrastos de prospecção no estuário do Rio de la Plata e sua plataforma interna no período de 1975 a 1995. Os dois primeiros fatores da Análise de Componentes Principais explicaram 48% da variância na distribuição das espécies sendo consistentes com os resultados da análise de agrupamento. Os resultados mostraram a existência de três associações de peixes espacial e temporalmente distintas: uruguaia costeira, estuarina externa e estuarina interna. Essas associações foram consistentes quanto às características ambientais e de composição de espécies. A despeito das mudanças registradas na densidade das espécies ao longo do período analisado, as associações de peixes foram persistentes ao longo do tempo. No presente trabalho foi demonstrado que embora as associações sejam consideradas um sistema aberto, um fluxo recíproco de organismos acontece entre associações adjacentes. Contudo, cada associação apresenta diferentes graus de estabilidade, dependentes da estabilidade física e temporal do habitat, e das interações das espécies nas associações. No entanto, cada associação mostrou alta persistência espacial e temporal, apesar da variabilidade ambiental no sistema analisado. Nesse sentido, e de acordo com a pesca multiespecífica que opera neste sistema, cada associação poderá ser considerada como uma unidade de gestão.
Descriptors: Persistence, Fisheries, Demersal fish assemblages, Uruguay, Multivariate analysis. Descritores: Persistência, Pescarias, Assembléias de peixes demersais, Uruguai, Análise multivarida.
I
NTRODUCTIONEstuaries have been the subject of considerable research,some of which has focused on the key environmental factors affecting estuarine fish community structure (JAUREGUIZAR et al., 2004,
changes in estuaries that are caused by environmental variations and habitat alteration has been shown by James et al. (2008). Those authors found that although individual species showed large interannual variations in abundance, driven primarily by changing environmental conditions, the basic community structure remained relatively stable. The Rio de la Plata is a large estuarine system with a coastal plain, micro tide and naturally rich in nutrients. Because of its large size and morphological diversity it can be divided into fluvial-tidal (internal) and estuarine regions, with different depths, circulation patterns and stratification, sharing B, influx of nutrients, turbidity gradient, mixing state and trophic status (NAGY, 2005). The Rio de la Plata and Uruguayan Atlantic coastal regions are impacted by steadily increasing human pressure and weather, nitrification, change of land use, and soil erosion, supplying urban emissions and leading to rising atmospheric temperature (~ 0.8°C), precipitation (~ 23%), river flows (25-40%), and the El Niño southern oscillation (NAGY et al., 2002).
Long-term studies have shown that the co-occurrence of a given set of fish species over broad geographical areas is usually not an accidental phenomenon (GOMES et al., 2001). Fish assemblages are persistent; they appear to retain their species composition for periods of time that are at least comparable with the life span of most of the species in the assemblage. Examples of long term studies (> 10 years) are those conducted by Gabriel (1992), Mahon; Smith (1989), Mahon et al. (1998), and Gomes et al., (1995), for the north Atlantic, Roel (1987) for the west coast of South Africa, Bianchi (1992 a,b) for both the continental shelf of Angola and the shelf off Congo and Gabon. In the south Atlantic studies have been made by Jaureguizar et al. (2006). In recent years, attention has started to shift towards determining the role of species in their respective ecosystem and the likely impact of fishing them Gislason et al. (2000). New approaches to the study of exploited populations have been suggested, including the study of fish assemblage structures in relation to environmental variables, and the characterization of seasonal changes to improve management practices (LABROPOULOU; PAPACONSTANTINOU, 2005). Trawl fleet fisheries target several demersal and benthic species. The study of exploited populations has been including the analysis of the fish assemblage structure and the characterization of seasonal changes to improve not only management practices (GISLASON et al., 2000) but also the understanding of the dynamics of multispecies stocks (CADDY; SHARP, 1988).
In this study we analyzed seasonally the demersal fish assemblages of the Rio de la Plata and its inner continental shelf from 1975 to 1995 using the
available information of 25 survey assessments in the area surveyed. The analysis resulted in the definition of the persistence of the fish community, its temporal evolution and some of the causes that determine and explain its persistence. We discuss the usefulness of these results in assessing the impact of fisheries on the ecosystem and the use of fish assemblages as management units.
M
ATERIAL ANDM
ETHODSStudy Area and Sampling Procedure
The Rio de la Plata estuary is situated between Argentina and Uruguay (35ºS, 56ºW), is one of the few largest permanently open estuaries of the world, covering an area of 35000 km2. This river drains the second largest basin in South America (the Parana and Uruguay river basins), discharging an average of 22000 m3 s-1 of freshwater over the continental shelf through a 230 km-wide mouth (FRAMIÑAN; BROWN, 1996). Water stratification is determined by the confluence of a high buoyancy continental discharge advecting offshore, lying over denser shelf water that intrudes into the estuary as a topographically controlled wedge. This saline wedge is from 150-250 km in length (GUERRERO et al., 1997). The offshore limit of the saline wedge forms a surface salinity front, wherea high horizontal salinity gradient marks the encounter between the estuarine and marine systems (GUERRERO et al., 1997; MIANZAN et al., 2001). The inner continental shelf is influenced both by the “run-off” of the Rio de la Plata and marine waters (NAGY, 2005).
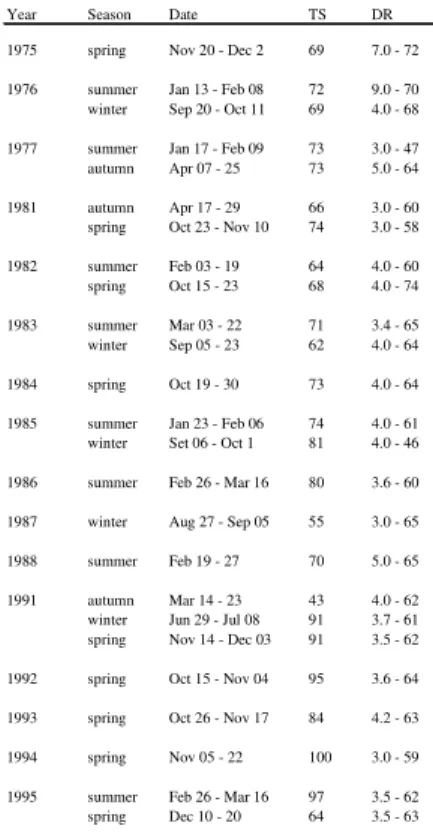
Table 1. Year, season, date, number of trawl stations (TS) and depth range (m) (DR) the survey analyzed.
60° 59° 58° 57° 56° 55° 54° 53° 52° 51° 50°40°
39° 38° 37° 36° 35° 34° 33°
ARGENTINA
URUGUAY
10 m 20 m
50 m
100 m 200 m
1000 m BRASIL
50 m
S
W Rio de la P
lata Pta. B rava
Pta.Piedras
Bahía Samborombon
Pta. Rasa
Pta. d el Es
te
South America
Atlantic Ocean
60° 59° 58° 57° 56° 55° 54° 53° 52° 51° 50°40°
39° 38° 37° 36° 35° 34° 33°
ARGENTINA
URUGUAY
10 m 20 m
50 m
100 m 200 m
1000 m BRASIL
50 m
S
W Rio de la P
lata Pta. B rava
Pta.Piedras
Bahía Samborombon
Pta. Rasa
Pta. d el Es
te
South America
Atlantic Ocean
Fig. 1. Location and bathymetry of the study area: the Rio de la Plata estuary (delimited by broken line) and the adjacent Inner Continental Shelf (ICS).
Year Season Date TS DR
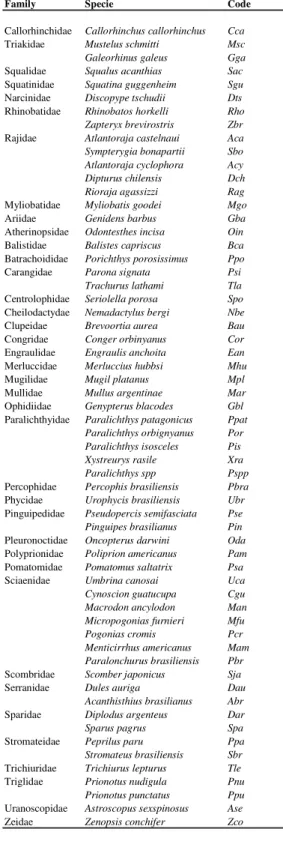
Table 2. List of demersal taxa caught in survey between 1975 and 1995.
Community Multivariate Analysis
A site-species matrix was constructed for each season. At each site, density of individuals (kg/mn2) was calculated using the formula C/A where C= individuals captured per haul and A= area swept (velocity x time x horizontal opening x 1852 m). Species that did not occur in at least 5 % of the samples were not considered in the analysis to prevent their exercising an undue influence on the results (GAUCH, 1982). Data were log-transformed ln (x+1) before the analysis, in order to reduce the variability and the influence of the most abundant taxa on the results (TAYLOR, 1961). This was of considerable importance as regards the effects of the subsequent comparison of the results of each survey on the same scale.
Two different multivariate approaches were used to identify fish assemblages: Cluster Analysis (CA) and Principal Component Analysis (PCA). CA and PCA together provide a powerful statistical tool for identifying the community structure pattern (GAUCH, 1982) and particularly the fish assemblage in accordance with the criteria proposed by Mahon et al. (1998). These analyses allow the identification of fish species groups of similar distribution, characterizing species associations of multispecies matrixes. CA was performed using Pearson´s correlation coefficient similitude (r) and the UPGMA algorithm. Clusters of sites were mapped and geographical continuity of stations belonging to the same group was seen as an indicator of the validity of the group. According to Gomes et al., (2001) the recurring appearance of fish groups with the same composition and geographical location over the years, indicated that these groups were neither sporadic nor an artifact of the method.
PCA is an indirect gradient analysis that employs a linear response model, which is a simple approximation of the species response along an environmental gradient. PCA analysis was conducted using a correlation matrix of fish community abundance. Species loading of principal components was used to identify groups of species that tend to co-occur. The eingenvalues associated with a principal component indicate the relative importance of that component. Principal components with eingenvalues > 1 are considered to represent significant assemblages (JOLLIFFE, 1986). For the selection of variables and/or main sites in the formation of the axes, load factors (or contributions) > 0.5 were considered (MAHON et al., 1998), and those between 0.3 and 0.5 (ARAUJO; COSTA DE AZEVEDO, 2001). Separate analyses were performed for each survey data matrix.
Family Specie Code
Callorhinchidae Callorhinchus callorhinchus Cca
Triakidae Mustelus schmitti Msc
Galeorhinus galeus Gga
Squalidae Squalus acanthias Sac
Squatinidae Squatina guggenheim Sgu
Narcinidae Discopype tschudii Dts
Rhinobatidae Rhinobatos horkelli Rho
Zapteryx brevirostris Zbr
Rajidae Atlantoraja castelnaui Aca
Sympterygia bonapartii Sbo
Atlantoraja cyclophora Acy
Dipturus chilensis Dch
Rioraja agassizzi Rag
Myliobatidae Myliobatis goodei Mgo
Ariidae Genidens barbus Gba
Atherinopsidae Odontesthes incisa Oin
Balistidae Balistes capriscus Bca
Batrachoididae Porichthys porosissimus Ppo
Carangidae Parona signata Psi
Trachurus lathami Tla
Centrolophidae Seriolella porosa Spo
Cheilodactydae Nemadactylus bergi Nbe
Clupeidae Brevoortia aurea Bau
Congridae Conger orbinyanus Cor
Engraulidae Engraulis anchoita Ean
Merluccidae Merluccius hubbsi Mhu
Mugilidae Mugil platanus Mpl
Mullidae Mullus argentinae Mar
Ophidiidae Genypterus blacodes Gbl
Paralichthyidae Paralichthys patagonicus Ppat
Paralichthys orbignyanus Por
Paralichthys isosceles Pis
Xystreurys rasile Xra
Paralichthys spp Pspp
Percophidae Percophis brasiliensis Pbra
Phycidae Urophycis brasiliensis Ubr
Pinguipedidae Pseudopercis semifasciata Pse
Pinguipes brasilianus Pin
Pleuronoctidae Oncopterus darwini Oda
Polyprionidae Poliprion americanus Pam
Pomatomidae Pomatomus saltatrix Psa
Sciaenidae Umbrina canosai Uca
Cynoscion guatucupa Cgu
Macrodon ancylodon Man
Micropogonias furnieri Mfu
Pogonias cromis Pcr
Menticirrhus americanus Mam
Paralonchurus brasiliensis Pbr
Scombridae Scomber japonicus Sja
Serranidae Dules auriga Dau
Acanthisthius brasilianus Abr
Sparidae Diplodus argenteus Dar
Sparus pagrus Spa
Stromateidae Peprilus paru Ppa
Stromateus brasiliensis Sbr
Trichiuridae Trichiurus lepturus Tle
Triglidae Prionotus nudigula Pnu
Prionotus punctatus Ppu
Uranoscopidae Astroscopus sexspinosus Ase
The range, mean and standard deviation of depth, temperature and salinity were calculated to characterize each site group defined by the CA and PCA. To determine the percentage of each species recorded in each site group, and which of these species were predominant in each group, we calculated the relative density of each species in each group with respect to the total area sampled in the survey.
Similarity or percentage analysis (SIMPER) was used to identify the species which typified groups and those responsible for the discrimination between groups (CLARKE, 1993). This procedure indicates the average contribution of each species to the similarity (typifying species) and dissimilarity (discriminating species) between site groups.
R
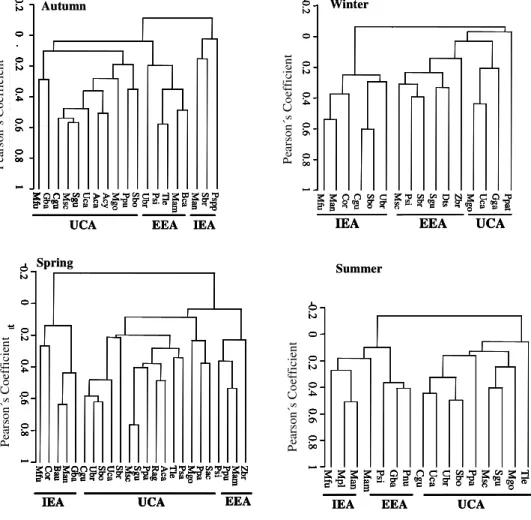
ESULTSOverall two uncorrelated dichotomies formed in the CA that integrated three assemblages of sites and species (r between 0.019 and 0.097) for the 21-year time series analyzed. Species with similar spatial distribution patterns were highly consistent from year to year and constituted three assemblages: Internal Estuarine Assemblage (IEA), External Estuarine Assemblage (EEA) and Uruguayan Coastal Assemblage (UCA) (Fig. 2). These spatial groups were highly persistent over time and seasonally (Fig. 3) and the major dichotomy in the multivariate analysis was always between the sampling stations shallower than 19 m (IEA) and the deeper ones, commonly up to 40 m (UCA).
Fig. 2. Typical result of CA with Pearson´s similarity coefficient. IEA: Internal Estuarine Assemblage; EEA: External Estuarine Assemblage; UCA: Uruguayan Coastal Assemblage. (We have given only four season as an example: Autumn 1991; Winter 1987; Spring 1995, Summer 1983).
P ea rs on C oe ff ic ie nt
IEA EEA UCA
M
fu Man Cor Cgu Sbo Ubr Msc Psi rSb Sgu Dts Zbr Mgo Uca Gga Ppat
-0 .2 0 0.2 0.4 0.6 0.8 1 ---P ea rs on C oe ff ic ie nt
IEA EEA UCA
M
fu Man Cor Cgu Sbo Ubr Msc Psi rSb Sgu Dts Zbr Mgo Uca Gga Ppat
-0 .2 0 0.2 0.4 0.6 0.8 1 ---C
gu Sgu Aca Acy Ppu
P ea rs on C oe ff ic ie nt M
fu Gba Msc Uca Mgo Sbo Ubr siP Tle Mam Bca Man Sbr Pspp
-0 .2 0 0.2 0.4 0.6 0.8 1 M fu -0 .2 0 0.2 0.4 0.6 0.8 1 IEA EEA UCA C
gu Aca
M fu -0 .2 0 0.2 0.4 0.8 1 -C
gu Sgu
C
gu Sgu Aca Acy Ppu
P ea rs on C oe ff ic ie nt M
fu Gba Msc Uca Mgo Sbo Ubr siP Tle Mam Bca Man Sbr Pspp
-0 .2 0 0.2 0.4 0.6 0.8 1 M fu -0 .2 0 0.2 0.4 0.6 0.8 1 IEA EEA UCA C
gu Aca
M fu -0 .2 0 0.2 0.4 0.8 1 -C
gu Sgu
Winter Spring Summer Autumn EEA P ea rs on C oe ff ic ie nt IEA UCA M
fu Cor Bau Man Gba Cgu Ubr Sbo Uca Sbr Msc Sgu Ppa Rag Aca Tle Psa Mgo Ppa Sac Psi Ppu Mam Zbr
0.2 0 0.2 0.4 0.6 0.8 1 EEA P ea rs on C oe ff ic ie nt IEA UCA M
fu Cor Bau Man Gba Cgu Ubr Sbo Uca Sbr Msc Sgu Ppa Rag Aca Tle Psa Mgo Ppa Sac Psi Ppu Mam Zbr
0.2 0 0.2 0.4 0.6 0.8 1 P ea rs on C oe ff ic ie nt IEA UCA M
fu Cor Bau Man Gba Cgu Ubr Sbo Uca Sbr Msc Sgu Ppa Rag Aca Tle Psa Mgo Ppa Sac Psi Ppu Mam Zbr
0.2 0 0.2 0.4 0.6 0.8 1
IEA EEA UCA
P ea rs on C oe ff ic ie nt M
fu Mpl Man Mam Psi Gba Pnu Cgu Uca Ubr Sbo Ppa Msc Sgu Mgo Tle
-0 .2 0 0.2 0.4 0.6 0.8 1
IEA EEA UCA
P ea rs on C oe ff ic ie nt M
fu Mpl Man Mam Psi Gba Pnu Cgu Uca Ubr Sbo Ppa Msc Sgu Mgo Tle
-0 .2 0 0.2 0.4 0.6 0.8 1 P ea rs on C oe ff ic ie nt
IEA EEA UCA
M
fu Man Cor Cgu Sbo Ubr Msc Psi rSb Sgu Dts Zbr Mgo Uca Gga Ppat
-0 .2 0 0.2 0.4 0.6 0.8 1 ---P ea rs on C oe ff ic ie nt
IEA EEA UCA
M
fu Man Cor Cgu Sbo Ubr Msc Psi rSb Sgu Dts Zbr Mgo Uca Gga Ppat
-0 .2 0 0.2 0.4 0.6 0.8 1 ---C
gu Sgu Aca Acy Ppu
P ea rs on C oe ff ic ie nt M
fu Gba Msc Uca Mgo Sbo Ubr siP Tle Mam Bca Man Sbr Pspp
-0 .2 0 0.2 0.4 0.6 0.8 1 M fu -0 .2 0 0.2 0.4 0.6 0.8 1 IEA EEA UCA C
gu Aca
M fu -0 .2 0 0.2 0.4 0.8 1 -C
gu Sgu
C
gu Sgu Aca Acy Ppu
P ea rs on C oe ff ic ie nt M
fu Gba Msc Uca Mgo Sbo Ubr siP Tle Mam Bca Man Sbr Pspp
-0 .2 0 0.2 0.4 0.6 0.8 1 M fu -0 .2 0 0.2 0.4 0.6 0.8 1 IEA EEA UCA C
gu Aca
M fu -0 .2 0 0.2 0.4 0.8 1 -C
gu Sgu
Winter Spring Summer Autumn EEA P ea rs on C oe ff ic ie nt IEA UCA M
fu Cor Bau Man Gba Cgu Ubr Sbo Uca Sbr Msc Sgu Ppa Rag Aca Tle Psa Mgo Ppa Sac Psi Ppu Mam Zbr
0.2 0 0.2 0.4 0.6 0.8 1 EEA P ea rs on C oe ff ic ie nt IEA UCA M
fu Cor Bau Man Gba Cgu Ubr Sbo Uca Sbr Msc Sgu Ppa Rag Aca Tle Psa Mgo Ppa Sac Psi Ppu Mam Zbr
0.2 0 0.2 0.4 0.6 0.8 1 P ea rs on C oe ff ic ie nt IEA UCA M
fu Cor Bau Man Gba Cgu Ubr Sbo Uca Sbr Msc Sgu Ppa Rag Aca Tle Psa Mgo Ppa Sac Psi Ppu Mam Zbr
0.2 0 0.2 0.4 0.6 0.8 1
IEA EEA UCA
P ea rs on C oe ff ic ie nt M
fu Mpl Man Mam Psi Gba Pnu Cgu Uca Ubr Sbo Ppa Msc Sgu Mgo Tle
-0 .2 0 0.2 0.4 0.6 0.8 1
IEA EEA UCA
P ea rs on C oe ff ic ie nt M
fu Mpl Man Mam Psi Gba Pnu Cgu Uca Ubr Sbo Ppa Msc Sgu Mgo Tle
Fig. 3. Fish assemblages of the Rio de la Plata estuary and its inner continental shelf throughout the period analyzed. : Internal Estuarine Assemblage; : External Estuarine Assemblage; : Uruguayan Coastal Assemblage.
60° 59° 58° 57° 56° 55° 54° 53° 52° ARGENTINA URUGUAY 5 m 50 m 100 m 200 m 1000 m BRASIL 50 m WINTER 1983 W 39° 38° 37° 36° 35° 34° 33° ARGENTINA URUGUAY 100 m 200 m 1000 m BRAZIL 50 m AUTUMN 1981 S 39° 38° 37° 36° 35° 34° 33° ARGENTINA URUGUAY 100 m 200 m 1000 m BRASIL 50 m SPRING 1982 S
60° 59° 58° 57° 56° 55° 54° 53° 52°39° 38° 37° 36° 35° 34° 33° ARGENTINA URUGUAY 20 m 100 m 200 m 1000 m BRASIL 50 m SPRING 1984 S w 60° 59° 58° 57° 56° 55° 54° 53° 52°39°
38° 37° 36° 35° 34° 33° ARGENTINA URUGUAY 20 m 100 m 200 m 1000 m BRASIL 50 m SPRING 1984 S w ARGENTINA URUGUAY 100 m 200 m 1000 m BRASIL 50 m SUMMER 1976 ARGENTINA URUGUAY 50 m 100 m 200 m 1000 m BRASIL 50 m SUMMER 1977 ARGENTINA URUGUAY 100 m 200 m 1000 m BRASIL 50 m SUMMER 1982
60° 59° 58° 57° 56° 55° 54° 53° 52° ARGENTINA URUGUAY 50 m 100 m 200 m 1000 m BRASIL 50 m SUMMER 1983 W 39° 38° 37° 36° 35° 34° 33° ARGENTINA URUGUAY 100 m 200 m 1000 m BRASIL 50 m WINTER 1976 S ARGENTINA URUGUAY 50 m 100 m 200 m 1000 m BRASIL 50 m AUTUMN 1977 ARGENTINA URUGUAY 50 m 100 m 200 m 1000 m BRASIL 50 m SPRING 1981 ARGENTINA URUGUAY 50 m 100 m 200 m 1000 m BRASIL 50 m SPRING 1981 ARGENTINA URUGUAY 50 m 100 m 200 m 1000 m BRASIL 50 m SPRING 1975 ARGENTINA URUGUAY 50 m 100 m 200 m 1000 m BRASIL 50 m SPRING 1975
60° 59° 58° 57° 56° 55° 54° 53° 52° ARGENTINA URUGUAY 5 m 50 m 100 m 200 m 1000 m BRASIL 50 m WINTER 1983 W 39° 38° 37° 36° 35° 34° 33° ARGENTINA URUGUAY 100 m 200 m 1000 m BRAZIL 50 m AUTUMN 1981 S 39° 38° 37° 36° 35° 34° 33° ARGENTINA URUGUAY 100 m 200 m 1000 m BRASIL 50 m SPRING 1982 S
60° 59° 58° 57° 56° 55° 54° 53° 52°39° 38° 37° 36° 35° 34° 33° ARGENTINA URUGUAY 20 m 100 m 200 m 1000 m BRASIL 50 m SPRING 1984 S w 60° 59° 58° 57° 56° 55° 54° 53° 52°39°
38° 37° 36° 35° 34° 33° ARGENTINA URUGUAY 20 m 100 m 200 m 1000 m BRASIL 50 m SPRING 1984 S w ARGENTINA URUGUAY 100 m 200 m 1000 m BRASIL 50 m SUMMER 1976 ARGENTINA URUGUAY 50 m 100 m 200 m 1000 m BRASIL 50 m SUMMER 1977 ARGENTINA URUGUAY 100 m 200 m 1000 m BRASIL 50 m SUMMER 1982
Fig. 3. Continuated.
The IEA was localized in the internal estuarine zone. This area had the shallowest depth range (3 to 19 m), temperature between 16.1 and
20.1ºC and salinity between 13.5 and 22.5 ups.
Micropogonias furnieri (Desmarest, 1823), Macrodon ancylodon (Bloch & Schneider, 1801) (with 100%
39° 38° 37° 36° 35° 34° 33°
ARGENTINA
URUGUAY
50 m 100 m
200 m 1000 m
BRASIL
50 m
AUTUMN 1991
S
60° 59° 58° 57° 56° 55° 54° 53° 52°
SPRING 1994
ARGENTINA
URUGUAY
50 m 100 m
200 m 1000 m
BRASIL
50 m
SUMMER 1988
ARGENTINA
URUGUAY
50 m 100 m
200 m 1000 m
BRASIL
50 m
SUMMER 1985
39° 38° 37° 36° 35° 34° 33°
ARGENTINA
URUGUAY
50 m 100 m
200 m 1000 m
BRASIL
50 m
SUMMER 1986
60° 59° 58° 57° 56° 55° 54° 53° 52°39° 38° 37° 36° 35° 34° 33°
ARGENTINA
URUGUAY
50 m 100 m
200 m 1000 m
BRASIL
50 m
SUMMER 1995
S
W ARGENTINA
URUGUAY
50 m 100 m
200 m 1000 m
BRASIL
50 m
WINTER 1987
ARGENTINA
URUGUAY
50 m 100 m
200 m 1000 m
BRASIL
50 m
WINTER 1985
ARGENTINA
URUGUAY
100 m 200 m 1000 m
BRASIL
50 m
SPRING 1991
ARGENTINA
URUGUAY
20 m 5 0 m
100 m 200 m 1000 m
BRASIL
WINTER 1991 39°
38° 37° 36° 35° 34° 33°
ARGENTINA
URUGUAY
100 m 200 m 1000 m
BRASIL
50 m
SPRING 1992
S
ARGENTINA
URUGUAY
100 m 200 m 1000 m
BRASIL
50 m
SPRING 1993
60° 59° 58° 57° 56° 55° 54° 53° 52°39° 38° 37° 36° 35° 34° 33°
ARGENTINA
URUGUAY
100 m 200 m
1000 m BRASIL
50 m
SPRING 1995
S
W
39° 38° 37° 36° 35° 34° 33°
ARGENTINA
URUGUAY
50 m 100 m
200 m 1000 m
BRASIL
50 m
AUTUMN 1991
S
60° 59° 58° 57° 56° 55° 54° 53° 52°
SPRING 1994
ARGENTINA
URUGUAY
50 m 100 m
200 m 1000 m
BRASIL
50 m
SUMMER 1988
ARGENTINA
URUGUAY
50 m 100 m
200 m 1000 m
BRASIL
50 m
SUMMER 1985
39° 38° 37° 36° 35° 34° 33°
ARGENTINA
URUGUAY
50 m 100 m
200 m 1000 m
BRASIL
50 m
SUMMER 1986
60° 59° 58° 57° 56° 55° 54° 53° 52°39° 38° 37° 36° 35° 34° 33°
ARGENTINA
URUGUAY
50 m 100 m
200 m 1000 m
BRASIL
50 m
SUMMER 1995
S
W ARGENTINA
URUGUAY
50 m 100 m
200 m 1000 m
BRASIL
50 m
WINTER 1987
ARGENTINA
URUGUAY
50 m 100 m
200 m 1000 m
BRASIL
50 m
WINTER 1985
ARGENTINA
URUGUAY
100 m 200 m 1000 m
BRASIL
50 m
SPRING 1991
ARGENTINA
URUGUAY
20 m 5 0 m
100 m 200 m 1000 m
BRASIL
WINTER 1991 39°
38° 37° 36° 35° 34° 33°
ARGENTINA
URUGUAY
100 m 200 m 1000 m
BRASIL
50 m
SPRING 1992
S
ARGENTINA
URUGUAY
100 m 200 m 1000 m
BRASIL
50 m
SPRING 1993
60° 59° 58° 57° 56° 55° 54° 53° 52°39° 38° 37° 36° 35° 34° 33°
ARGENTINA
URUGUAY
100 m 200 m
1000 m BRASIL
50 m
SPRING 1995
S
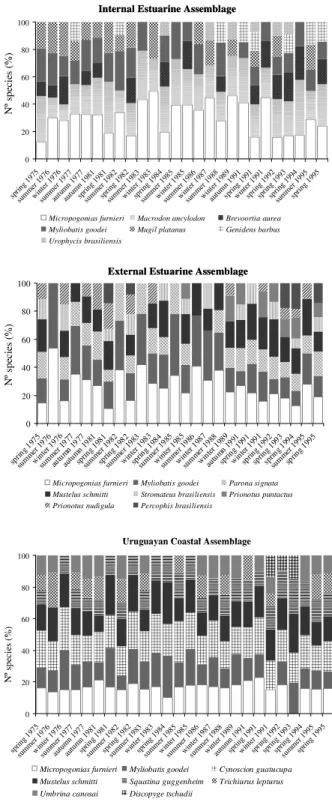
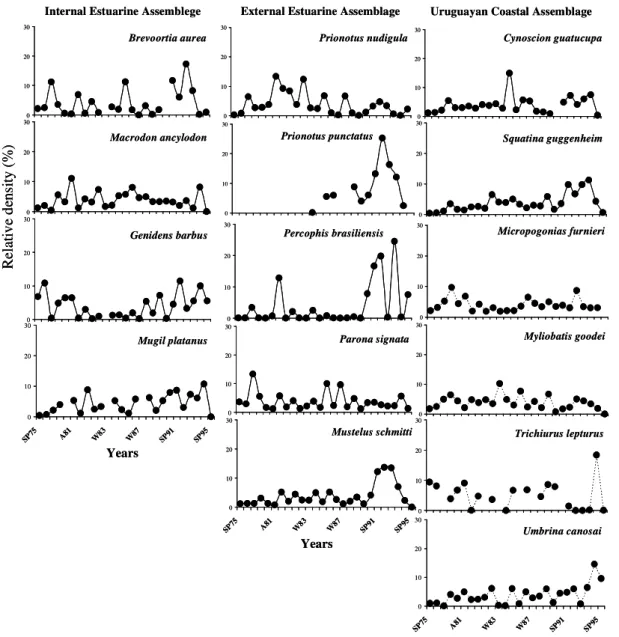
persistence) and Brevoortia aurea (Spix & Agassiz, 1829) (with 57% persistence) were the most abundant species in this assemblage (Fig. 4). Five species occurred in at least 15% of the survey: Trichiurus lepturus (Linnaeus, 1758), Genidens barbus
(Lacepède, 1803), Uropycis brasiliensis (Kaup, 1858), Mugil platanus Gunther, 1880 and Parona signata
(Jenyns, 1841) predominated in spring (Fig. 4).
Micropogonias furnieri and M. ancylodon
characterized this assemblage for 21 and 16 years, respectively. This assemblage was distinguished by B. aurea and M. ancylodon (Table 3). Macrodon ancylodon tended to dominate in winter and spring
and B. aurea in spring, whereas M. furnieri was the
most abundant in autumn and winter. The EEA was located in the external estuarine zone of Rio de la Plata, at depths between 9.8 and 24.2 m; with salinity between 25.6 and 32.8 ups and temperature between 14.2 to 18.4ºC. This assemblage was characterized by eight species with higher abundance: Micropogonias furnieri and Myliobatis goodei (Garman, 1885) (100%
persistence), P. signata and Mustelus schmitti
Springer, 1939 (86% persistence), Percophis brasiliensis Quoy & Gaimard, 1825. Prionotus nudigula Guinsburg, 1950 and Stromateus brasiliensis
Fowler, 1906 (46% persistence), and Prionotus puntactus (Bloch, 1793) (30% persistence) (Fig. 4).
This assemblage was typified mainly by M. furnieri
(for 20 years), M. goodei (for 11 years) and M. ancylodon, M. schmitti, P. signata, S. brasiliensis,
Cynoscion guatucupa (Cuvier, 1830) and Squatina guggenheim (Marini, 1936) over almost six years. This assemblage was distinguished by P. nudigula and P. puntactus (Table 3). The UCA was located on the
inner continental shelf of the Uruguayan Atlantic coast at depths of between 17.3 and 40.3 m, temperature between 12.3 and 17.6ºC and salinity ranging from 28.9 and 33.1°C. The main species with the highest densities were M. goodei, C. guatucupa
and M. schmitti in allthe years analyzed; M. furnieri
(except in spring 1993), Umbrina canosai Berg, 1895,
S. guggenheim (except in summer 1976) and T. lepturus (Fig. 4). The species M. schmitti (for 22 years), C. guatucupa (for 23 year), S. guggenheim and M. furnieri (for 17 years), T. lepturus and Discopyge tschudii Heckel 1846 in all but one survey, typified
the UCA. This assemblage was distinguished by S. guggenheim, T. lepturus, C. guatucupa and U. canosai
(Table 3).
Several species were not clearly affiliated to any of the three major groups. When observations from entire time series were combined, however, those species were seen to be linked to major groups consistent with long term-individual distribution patterns. Myliobatis goodei and Menticirrhus americanus (Linnaeus, 1758) were affiliated to EEA
and Conger orbignyanus Valenciennes, 1837 (minor
group UCA) occurred occasionally as a member of IEA, principally in spring and summer.
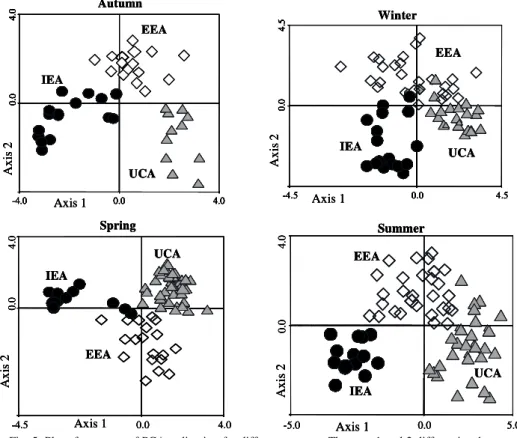
As with the general pattern in all surveys, two principal axes were considered in the PCA, with eigenvalues higher than 1, which explained between 40.6% and 47.7% of the species variance. The sites and species that contributed with values > 0.3 in the formation of factors, always grouped along the depth gradient, ranked between shallow (usually < 12 m) and deeper (usually > 30m) waters (Fig. 5). In general, for the whole period analyzed an examination of the column scores of depth, temperature and salinity in relation to the first axis of the PCA displayed a spatial pattern for both stations and species that conformed to that of the IEA assemblages. No further spatial pattern was found for the first and third axis of the PCA (data not shown). Most of the sites that were negatively correlated with the first axis were located at depths of lessthan20 m (Fig. 5).
The trend in relative abundance of fish increased, for all the three assemblages, only between spring 1991 and spring 1993 (Fig. 6). In the IEA, the greatest increase in abundance was determined principally by G. barbus. In the EEA two increments were observed, both in spring, one in 1981, characterized by P. nudigula and Paralonchurus brasiliensis (Steindachner, 1875), and the second in
1992, determined by P. puntactus and M. schmitti
(Fig. 6). In the UCA the variation in the abundance showed three peaks in the summers of 1977, 1985 and 1995 and another in spring 1992 (Fig. 6).
D
ISCUSSIONabundance of species within each assemblage changed as a result of changes in the abundance of species,
especially in the estuarine assemblages (IEA and EEA). These assemblages retain their species compositions over periods of time at least as long as the average life span of their component species. There is also strong evidence for the mesoscale persistence of the geographical boundaries of the assemblages. The geographical limits were usually relatively predictable and may be associated principally with the bottom topography or other physical features of the area. The results revealed a spatial gradient from shallow to deeper waters determining two major groups with particular characteristics: one estuarine and the other typical of the inner continental shelf. It may, therefore, be assumed that assemblages represented by the CA and PCA are a response to the environmental variation found between shallow estuarine and continental shelf waters with marine influence. These fish assemblages detected in the Rio de la Plata and on its inner continental shelf, generally agreed with the fish groups described by Díaz de Astarloa et al. (1999) based on presence-absence data, and with Jaureguizar et al. (2003, 2004) for the Rio de la Plata estuary. Analysis of springtime data for six different years with a different methodology, showed a temporal persistence of the assemblages with respect to species composition and geographical location (JAUREGUIZAR et al., 2006).
The temperature decrease and salinity increase in the area of the coastal continental shelf, correlated with a greater abundance of marine species. The dominant species in the UCA were Urophycis brasiliensis, Cynoscion guatucupa, Umbrina canosai, Mustelus schmitti and Squatina guggenheim. Within
the inner estuary (IEA) with higher temperature and lower salinity, the dominant species were Brevoortia aurea, Mugil platanus, Menticirrhus americanus and Genidens barbus, while in the section towards the
external estuary (EEA) Prionotus puntactus, Parona signata, M.schmitti and Discopyge tschudii prevailed.
Changes in the dominant species between assemblages could be a result of a temporary partition of resources that reduces competition for food or may also reflect the response of the species to optimal environmental conditions or a combination of both (AKIN et al., 2003). These species have preferences for certain factors, which influence the composition of the assemblages (MAHON et al., 1998, OBERDORFF et al., 2001).
Several factors seemed to contribute to the geographical differentiation between the estuary and the inner continental shelf. These included the influence of fresh water discharge, differences in both temperature and salinity, and differences in the extent and type of background areas (GUERRERO et al.,
1997). The changes in the abundance and species occurrence could be associated with depth (e.g., as with M. schmitti, Stromateus brasiliensis and
Percophis brasiliensis). Other species such as P. puntactus, Micropogonias furnieri, Conger orbignyanus, U. brasiliensis, Paralonchurus brasiliensis, U. canosai, Myliobatis goodei,
Galeorhinus galeus (Linneaus 1758), Cynoscion guatucupa, Mustelus schmitti and Parona signata are linked to more than one assemblage and do not appear to be restricted to just one. While the abundance changed with depth, it was noted that species range distributions overlapped, and the maximum abundance changed according to temperature and salinity ranges. The salinity preferences of C. orbignyanus, U. brasiliensis, U. canosai, M. goodei and R. agassizi
were markedly different. These species prevailed in salinities between 29 and 31 ups and temperatures between 12 and 17.6°C. Although the salinity could be a key factor for identifying assemblages (VORWERK et al., 2003; PAPERNO; BRODIE, 2004), it is difficult to demonstrate the role of a single variablein analyzing the structure of a community of fish in estuaries and especially considering that many species involved several associations at a time. Many of these variables are confused and individual species of fish react differently to changes in each factor. The species composition and structure of the community in estuaries can be deeply influenced by the tide, wind and turbidity (SCULLY et al., 2005). The Rio de la Plata has a northwest-southwest geographical direction, so when is affected by a strong Southeast wind, the water level rises. Furthermore, the shape and size of the estuary and the micro tide regime give atmospheric processes, especially the wind regime, important key roles in the dynamics of the river. In winter, the northward shift of intense pressure in subtropical fronts causes an increase in the frequency of winds from the west, while in spring and summer flows affect the east and southeast. The characteristic Southwest and Southeast winds associated with the passage of meteorological fronts kept the industrial and artisanal fleet in port for 3-4 days (NAGY et al., 2007), but did not affect the distribution of some fish species Although interannual fish assemblage variation may be observed due to environmental variability (mainly salinity and temperature), long term climate trends, such us El Niño events and climatic changes can result in a restructuring of fish assemblages (GARCIA et al., 2001). In this study we have shown that the fish assemblages were persistent throughout the period analyzed although the increment in abundance of the groups IEA and EEA (principally due to the species B. aurea and Macrodon ancylodon)
T
ab
le
3
. T
yp
ify
in
g
sp
ec
ie
s
(g
ra
y)
, d
isc
rim
in
ati
ng
s
pe
cie
s
(u
nd
erl
in
ed
)
in
th
e
tim
e-se
rie
s.
IE
A
: I
nte
rn
al
E
stu
ari
ne
A
ss
em
bla
ge
; E
E
A
: E
xte
rn
al
E
stu
ari
ne
A
ss
em
bla
ge
;
U
C
A
: U
ru
gu
ay
an
C
oa
sta
l A
ss
em
bla
ge
.
SP 75 SU 76 W 76 SU 77 A 77 A 81 SP 81 SU 82 SP 82 SU 83 W 83 SP 84 SU 85 W 85 SU 86 W 87 SU 88 W 89 A 91 W 91 SP 91 SP 92 SP 93 SP 94 SP 95 SU 95
Brevoortia aurea 1.04 1.04 2.69 1.18 1.29 2.23 1.83 1.69 1.37 1.28 1.89 1.92 2.73 2.05 3.55
Macrodon ancylodon 3.14 1.74 1.56 2.47 2.41 3.16 3.15 1.57 2.85 2.78 1.35 3.35 2.84 2.16 2.51 1.88 2.50 1.94 2.52 1.46 3.31 3.06 3.18 3.37 1.77 2.75
Micropogonias furnieri 1.18 3.48 3.66 3.80 3.70 3.77 1.56 3.32 2.03 3.35 2.78 1.95 3.32 3.28 3.46 3.51 3.26 3.11 3.21 2.92 2.18 1.69 2.17 1.44 2.42 1.47
Myliobatis goodei 2.26 2.77 1.95 1.98 2.59 2.16 1.77 2.81 2.63 1.62 1.92 2.29 1.15 2.13 2.87 0.93 0.91 1.91 1.48 1.80 1.50 1.31
Parona signata 1.83 2.63 3.24 1.65 1.47 1.34 1.89 1.15 2.26 1.50 1.57 1.44 0.82 1.58 1.60 1.55
Paralichthys spp. 0.92 1.02 1.14 1.25 1.42 0.96 1.35 0.94 1.52 1.36 0.98 1.83 2.28 2.06 2.07 1.55 1.54 1.06
Cynoscion guatucupa 1.22 1.52 1.33 1.68 2.44 1.39 1.46 1.35
Mustelus schmitti 1.46 1.18 0.95 0.76
Rajidae 1.89
Sympeterygia bonapartii 1.16 1.11
Stromateus brasiliensis 0.88 1.18 0.91
Squatina guggenheim 1.44
Trichiurus lepturus 1.69 1.96 1.59 1.64 1.43 1.25 1.08 1.35 1.89 1.65
Genidens barbus 1.63 0.94 1.76 1.14 1.87 1.72 1.39
Prionotus puntactus 1.71 1.02
Paralonchurus brasiliensis 1.13 0.97
Prionotus nudigula 1.17 1.22 1.64 0.99 1.06
Umbrina canosai
Percophis brasiliensis 1.04
Pagrus pagrus Atlantoraja castelnaui
Conger orbignyanus 0.65 0.82 1.13 1.01
Discopyge tschudii
Urophycis brasiliensis 1.00 1.06 0.86 1.01 1.12 1.15
Zapteryx brevirostris
Paralichthys patagonicus 1.12
Pomatomus saltator
Mugil platanus 0.95 0.81 1.76 1.55 1.48 1.06 0.91
Menticirrhus americanus 1.07
Internal Estuarine Assemblage
B
R
A
Z
IL
IA
N
JO
U
R
N
A
L
O
F O
C
E
A
N
O
G
R
A
PH
Y
, 5
9(
1)
, 2
01
T
ab
le
3
. Co
nti
nu
ate
d.
SP 75 SU 76 W 76 SU 77 A 77 A 81 SP 81 SU 82 SP 82 SU 83 W 83 SP 84 SU 85 W 85 SU 86 W 87 SU 88 W 89 A 91 W 91 SP 91 SP 92 SP 93 SP 94 SP 95 SU 95
Brevoortia aurea 1.95 2.32 1.86 1.60 2.14 1.51 1.41
Macrodon ancylodon 3.05 3.64 3.23 3.07 2.43 3.08 2.92 1.04 3.35
Micropogonias furnieri 1.77 2.63 1.41 3.59 2.83 2.40 1.61 2.95 2.60 2.65 2.56 2.65 3.11 2.56 2.75 2.36 2.09 2.76 3.03 1.87 2.30 3.05 3.00 2.14 2.63 3.31
Myliobatis goodei 2.08 1.32 2.24 1.64 2.89 3.01 1.93 2.51 2.35 2.72 2.14 1.15 1.82 2.09 1.51 2.44 1.75 2.58
Parona signata 2.29 1.36 1.77 1.46 1.81 1.25 2.25 2.00 1.60 1.63 1.31 1.58 1.78 1.23 1.72 1.84 1.48 2.29 2.31 1.83 2.02 1.53 1.73
Paralichthys spp. 1.52 1.36 1.16 2.34 1.97 1.45 2.02 1.20 1.30 1.66 2.00 1.04 1.84 1.99 1.90 1.44
Cynoscion guatucupa 1.21 1.77 1.38 1.63 2.47 1.85 1.39 1.45 2.70 2.10 1.84 2.52 2.23 2.46 1.43 1.56 1.85 2.95 1.39 2.13 1.11 1.29 2.67 1.00
Mustelus schmitti 2.82 1.66 1.39 1.72 1.40 3.07 2.38 1.59 2.74 2.52 1.76 1.23 1.48 2.34 2.24 2.22 3.37 3.86 2.96 3.07 3.13 2.50
Rajidae 0.67 1.35 1.37 1.63 1.94 1.97 2.34
Sympeterygia bonapartii 1.91 2.07 1.66 1.32 1.80 1.67 1.74
Stromateus brasiliensis 1.73 1.60 1.35 2.29 1.29 1.27 1.57 1.22 1.27 1.82 1.13
Squatina guggenheim 1.72 1.17 1.18 1.97 1.23 1.77 1.45 0.99 1.70 2.66 2.40 2.41 2.41 2.57
Trichiurus lepturus 2.25 2.29 1.79 3.05 2.03
Genidens barbus 1.73 0.95 2.61 1.39 1.96 1.72
Prionotus puntactus 1.32 2.20 1.70 1.72 1.91 2.04 2.49 1.74
Paralonchurus brasiliensis
Prionotus nudigula 1.37 1.33 0.86 1.66 2.74 2.19 1.27 1.12 1.32
Umbrina canosai 1.96 0.96 1.61
Percophis brasiliensis 1.24 2.15 1.27 2.96 3.07 2.50
Pagrus pagrus 0.76
Atlantoraja castelnaui 1.34 2.05 1.90 2.42 1.58 1.20
Conger orbignyanus
Discopyge tschudii 1.91 1.11 2.44
Urophycis brasiliensis 0.81 1.33 1.03 2.02
Zapteryx brevirostris 1.70 1.06 2.02 1.15
Paralichthys patagonicus 2.00
Pomatomus saltator 2.28 2.36 2.27 2.67 2.12 1.82 1.88 1.59 1.40
Mugil platanus Menticirrhus americanus
External Estuarine Assemblage
L
O
R
E
N
Z
O
E
T
A
L
.: R
IO
D
E
L
A
P
L
A
T
A
L
O
N
G
T
E
R
M
F
IS
H
A
SS
E
M
B
L
A
G
E
S
5
T
ab
le
3
. Co
nti
nu
ate
d.
SP 75 SU 76 W 76 SU 77 A 77 A 81 SP 81 SU 82 SP 82 SU 83 W 83 SP 84 SU 85 W 85 SU 86 W 87 SU 88 W 89 A 91 W 91 SP 91 SP 92 SP 93 SP 94 SP 95 SU 95
Brevoortia aurea 1.35
Macrodon ancylodon 1.10
Micropogonias furnieri 2.26 1.78 1.55 2.67 3.24 3.62 1.85 3.28 2.75 2.64 2.50 1.86 1.17 2.21 2.35 2.97 2.54 2.70 2.93 2.93 2.42 2.45 2.57 2.89 2.77
Myliobatis goodei 1.80 1.68 2.58 2.81 3.05 1.93 2.75 2.27 1.67 3.04 2.79 2.36 3.05 2.07 2.99 2.06 2.70 2.10 3.17 1.84 2.00 2.62 2.03 2.19 1.87
Parona signata 1.88 1.49 1.23 1.97 1.01
Paralichthys spp. 1.25 1.87 1.37 1.22 1.37 1.38 1.71 1.93 1.93 1.52 1.38 1.89 2.39
Cynoscion guatucupa 3.21 2.41 2.79 3.37 3.19 3.32 2.27 3.04 3.34 3.32 3.13 2.69 2.29 3.43 3.04 2.95 3.46 2.81 2.77 3.01 2.95 2.65 2.54 3.38 2.93 3.29
Mustelus schmitti 2.31 2.74 2.18 2.92 2.99 1.77 2.82 2.59 3.17 3.23 2.21 2.35 3.03 1.93 2.73 2.43 2.35 2.72 2.63 2.52 3.08 2.69 3.30 2.94 2.78 2.75
Rajidae 1.25 1.39 2.17 20.1 2.09 1.88 1.77 1.54 2.00 2.02 1.87 2.02 2.08 1.82 2.05 2.47
Sympeterygia bonapartii 1.12 1.13 1.56 1.69 2.07 2.24
Stromateus brasiliensis 1.26 1.62
Squatina guggenheim 1.21 1.21 2.22 1.63 1.77 1.36 2.17 1.93 1.74 1.92 1.71 1.94 2.10 1.99 1.44 1.57 2.23 2.26 1.19 2.50 2.34 2.93 2.57 2.62 2.61
Trichiurus lepturus 1.35 2.83 1.88 2.25 2.4 2.42 2.61 1.73 1.45 2.30 2.03 1.99 1.20 2.91 2.14
Genidens barbus 1.59 1.08
Prionotus puntactus Paralonchurus brasiliensis
Prionotus nudigula 0.84
Umbrina canosai 1.73 1.37 1.89 2.88 2.31 2.73 1.88 2.07 2.15 2.09 2.40 1.27 1.70 2.64 2.28 1.95
Percophis brasiliensis Pagrus pagrus
Atlantoraja castelnaui 1.51 1.54 1.75 1.93 2.13
Conger orbignyanus 1.11 1.51 1.27
Discopyge tschudii 2.17 1.28 1.98
Urophycis brasiliensis 1.08 1.34 1.17 0.90 1.37 1.61 1.20 1.88 1.56 1.84
Zapteryx brevirostris
Paralichthys patagonicus 1.84 1.76
Pomatomus saltator Mugil platanus Menticirrhus americanus
Uruguayan Coastal Assemblage
B
R
A
Z
IL
IA
N
JO
U
R
N
A
L
O
F O
C
E
A
N
O
G
R
A
PH
Y
, 5
9(
1)
, 2
01
Fig. 4. Species relative compositions (%) of the total catch of the assemblage. Species codes in Table 2.
0 20 40 60 80 100 sprin g 197
5
summe r 197
6
winte r 197
6
summ er 19
77
autum n 197
7
autum n 198
1
sprin g 198
1
summe r 198
2
sprin g 198
2
summ er 19
83
winte r 198
3
sprin g 198
4
summ er 19
85
winte r 198
5
summe r 198
6
winte r 198
7
summe r 198
8
winte r 198
9
autum n 199
1
sprin g 199
1
winte r 199
1
sprin g 199
2
sprin g 199
3
sprin g 199
4
summ er 19
95
sprin g 199
5
Micropogonias furnieri Macrodon ancylodon Brevoortia aurea
Myliobatis goodei Mugil platanus Genidens barbus
Urophycis brasiliensis
Internal Estuarine Assemblage
0 20 40 60 80 100 sprin g 197
5
sum mer 1
976
winte r 197
6
sum mer 1
977
autu mn 19
77
autu mn 19
81
sprin g 198
1
sum mer 1
982
sprin g 198
2
sum mer 1
983
winte r 198
3
sprin g 198
4
sum mer 1
985
winter 1985
sum mer 1
986
winter 1987
sum mer 1
988
winter 1989
autu mn 19
91
sprin g 199
1
wint er 19
91
sprin g 199
2
sprin g 199
3
sprin g 199
4
sum mer 1
995
sprin g 199
5
Micropogonias furnieri Myliobatis goodei Parona signata
Mustelus schmitti Stromateus brasiliensis Prionotus puntactus
Prionotus nudigula Percophis brasiliensis
External Estuarine Assemblage
N º sp ec ie s (% ) N ºs pe ci es (% ) 0 20 40 60 80 100 sprin g 197
5
summ er 19
76
winte r 197
6
summ er 19
77
autum n 197
7
autu mn 19
81
sprin g 198
1
summ er 19
82
sprin g 198
2
summ er 19
83
winte r 198
3
sprin g 198
4
summ er 19
85
winte r 198
5
summ er 19
86
winte r 198
7
summ er 19
88
winte r 198
9
autu mn 19
91
sprin g 199
1
winte r 199
1
sprin g 199
2
sprin g 199
3
sprin g 199
4
summ er 19
95
sprin g 199
5
Micropogonias furnieri Myliobatis goodei Cynoscion guatucupa Mustelus schmitti Squatina guggenheim Trichiurus lepturus Umbrina canosai Discopyge tschudii
Uruguayan Coastal Assemblage
N ºs pe ci es (% ) 0 20 40 60 80 100 sprin g 197
5
summ er 19
76
winte r 197
6
summ er 19
77
autum n 197
7
autu mn 19
81
sprin g 198
1
summ er 19
82
sprin g 198
2
summ er 19
83
winte r 198
3
sprin g 198
4
summ er 19
85
winte r 198
5
summ er 19
86
winte r 198
7
summ er 19
88
winte r 198
9
autu mn 19
91
sprin g 199
1
winte r 199
1
sprin g 199
2
sprin g 199
3
sprin g 199
4
summ er 19
95
sprin g 199
5
Micropogonias furnieri Myliobatis goodei Cynoscion guatucupa Mustelus schmitti Squatina guggenheim Trichiurus lepturus Umbrina canosai Discopyge tschudii
Uruguayan Coastal Assemblage
Fig. 5. Plot of two axes of PCA ordination for differentseasons. The axes 1 and 2 differentiate between shallow and deep stations (assemblages have been indicated according to cluster analysis results). IEA: Internal Estuarine Assemblage; EEA: External Estuarine Assemblage; UCA: Uruguayan Coastal Assemblage. (We have given four seasons as an example: Autumn 1991; Winter 1987; Spring 1995, Summer 1983). See also Figure 3 for spatial distribution of assemblages.)
Our results suggest that other factors, both physical and biological, could be influencing the community structure though not the persistence of assemblages: (e.g. sediment) (GIBBONS et al., 2002), food availability (BARRY et al., 1996), turbidity (ARAUJO et al., 1999), pH (WHITFIELD, 1999) or biological interactions (e.g. competition or predation).
The feeding habits of most species that inhabit the Rio de la Plata estuary cover several trophic levels: planktofagous (B. aurea, Engraulis anchoita);
detritivorous (M. platanus); benthofagous (M. schmitti, Sympterygia bonapartii, M. goodei, U. brasiliensis, M. furnieri, P. puntactus, Prionotus nudigula, U. canosai) and nectopelagic (C. guatucupa, Macrodon ancylodon, Pomatomus saltatrix, P. signata) (COUSSEAU; PERROTTA, 2004) .
However, the species composition in each assemblage structure suggests thatthe trophic relationship among species may be weak.
The persistence of species associations observed over the 21 years analyzed is remarkable, given the history of fishery exploitation and the environmental variability in the Rio de la Plata
(NAGY, 2005). The most striking seasonal patterns in demersal assemblages took place within the assemblages themselves, rather than in the positioning of their geographical limits. The boundaries of the groups, particularly the shallow ones, did not vary substantially over the year. Seasonality was more pronounced within the shallow southern assemblage, but differences between seasons were also observed in the shallow northern and in the intermediate southern assemblage. Patterns of species assemblages could be representative of aquatic eco-regions and may thus be used as important tools for resource management and conservation. Fish groups can be viewed as ecological entities, such as the assemblage production units proposed by Tyler et al., (1982) and management strategies could be adapted to optimize the harvest of assemblages, rather than the harvest of a single species (MAHON et al., 1998). According to the latter authors, additional analysis focusing on trophic studies are required to determine whether or not the groups have a functional relationship (PAULY et al., 2001) and in which ways assemblages are affected by fishing activity. Axis 1 A xi s 2 IEA EEA UCA Autumn
-4.0 0.0 4.0
0.
0
4.
0
-4.0 0.0 4.0
0. 0 4. 0 Axis 1 A xi s 2 IEA EEA UCA Autumn
-4.0 0.0 4.0
0.
0
4.
0
-4.0 0.0 4.0
0. 0 4. 0 Axis 1 A xi s 2 IEA EEA UCA Winter
-4.5 0.0 4.5
0.
0
4.
5
-4.5 0.0 4.5
0. 0 4. 5 Axis 1 A xi s 2 IEA EEA UCA Winter
-4.5 0.0 4.5
0.
0
4.
5
-4.5 0.0 4.5
0. 0 4. 5 Axis 1 A xi s 2 IEA EEA UCA Spring
-4.5 0.0 4.0
0.
0
4.
0
- Axis 1
A xi s 2 IEA EEA UCA Spring
-4.5 0.0 4.0
0.
0
4.
0
- Axis 1
A xi s 2 IEA EEA UCA Summer
-5.0 0.0 5.0
0.
0
4.
0
- Axis 1
A xi s 2 IEA EEA UCA Summer
-5.0 0.0 5.0
0. 0 4. 0 -Axis 1 A xi s 2 IEA EEA UCA Autumn
-4.0 0.0 4.0
0.
0
4.
0
-4.0 0.0 4.0
0. 0 4. 0 Axis 1 A xi s 2 IEA EEA UCA Autumn
-4.0 0.0 4.0
0.
0
4.
0
-4.0 0.0 4.0
0. 0 4. 0 Axis 1 A xi s 2 IEA EEA UCA Winter
-4.5 0.0 4.5
0.
0
4.
5
-4.5 0.0 4.5
0. 0 4. 5 Axis 1 A xi s 2 IEA EEA UCA Winter
-4.5 0.0 4.5
0.
0
4.
5
-4.5 0.0 4.5
0. 0 4. 5 Axis 1 A xi s 2 IEA EEA UCA Spring
-4.5 0.0 4.0
0.
0
4.
0
- Axis 1
A xi s 2 IEA EEA UCA Spring
-4.5 0.0 4.0
0.
0
4.
0
- Axis 1
A xi s 2 IEA EEA UCA Summer
-5.0 0.0 5.0
0.
0
4.
0
- Axis 1
A xi s 2 IEA EEA UCA Summer
-5.0 0.0 5.0
0.
0
4.
0
-Fig. 6. Relative abundance (%) of principal species characteristic of each assemblage throughout the time series 1975-1995.
A
CKNOWLEDGEMENTSWe are grateful to the anonymous reviewers for their valuable comments on the manuscript, to our colleagues of DINARA who collected the data onboard the research vessels “Lamatra”, “Cruz del Sur” and “Aldebaran” during the years 1975 to 1995. The first author is grateful to the UTF/URU/025/UTF, “Proyecto de Gestión Pesquera en el Uruguay”, FAO-DINARA (Montevideo-Uruguay) who gave financial support for this project.
R
EFERENCESAKIN, S.; WINEMILLER, K. O.; GELWICK, F. P. Seasonal and spatial variations in fish and macrocrustacean assemblage structure in Mad Island Marsh estuary, Texas. Estuar. coast. Shelf Sci., v. 57, p. 269-282, 2003. ARAUJO, F. G.; BAILEY, R. G.; WILLIAMS, W. P. Spatial and temporal variations on fish populations in the upper Thames estuary. J. Fish Biol., v. 55, p. 836-853,
1999.
Uruguayan Coastal Assemblage
R
el
at
iv
e
de
ns
ity
(%
)
Brevoortia aurea
0 10 20 30
Macrodon ancylodon
0 10 20 30
Mugil platanus
0 10 20 30
SP75 A81 W83 W87 SP91 SP95
Genidens barbus
0 10 20 30
Prionotus nudigula
0 10 20 30
Prionotus punctatus
0 10 20 30
Parona signata
0 10 20 30
Percophis brasiliensis
0 10 20 30
Mustelus schmitti
0 10 20 30
SP75 A81 W83 W87 SP91 SP95
Cynoscion guatucupa
0 10 20 30
Micropogonias furnieri
0 10 20 30
Myliobatis goodei
0 10 20 30
Squatina guggenheim
0 10 20 30
Trichiurus lepturus
0 10 20 30
Umbrina canosai
0 10 20 30
SP75 A81 W83 W87 SP91 SP95
Years
Years
Years
Internal Estuarine Assemblege External Estuarine Assemblage Uruguayan Coastal Assemblage
R
el
at
iv
e
de
ns
ity
(%
)
Brevoortia aurea
0 10 20 30
Macrodon ancylodon
0 10 20 30
Mugil platanus
0 10 20 30
SP75 A81 W83 W87 SP91 SP95
Genidens barbus
0 10 20 30
Prionotus nudigula
0 10 20 30
Prionotus punctatus
0 10 20 30
Parona signata
0 10 20 30
Percophis brasiliensis
0 10 20 30
Mustelus schmitti
0 10 20 30
SP75 A81 W83 W87 SP91 SP95
Cynoscion guatucupa
0 10 20 30
Micropogonias furnieri
0 10 20 30
Myliobatis goodei
0 10 20 30
Squatina guggenheim
0 10 20 30
Trichiurus lepturus
0 10 20 30
Umbrina canosai
0 10 20 30
SP75 A81 W83 W87 SP91 SP95
Years
Years