Sara Filipa Fagulha Pereira
Bachelor in Chemical and Biochemical Engineering
The thermal effects on the
methanol-to-olefins reaction: A modelling
and experimental approach
TBD: Dissertation submitted in partial fulfillment of the requirements for the degree of
Master in Chemical and Biochemical Engineering
Adviser: Irina Prokopyeva, Master of Science, Delft
University of Technology
Co-advisers: Freek Kaptjein, Full Professor, Delft University of
Technology
Isabel Fonseca, Associate Professor, NOVA
University of Lisbon
Committee:
Chair: Mário Eusébio, Auxiliar Professor, NOVA University of Lisbon Raporteur: Inês Matos, Auxiliar Researcher, NOVA University of Lisbon
The thermal effects on the methanol-to-olefins reaction: A modelling and experi-mental approach
Copyright © Sara Filipa Fagulha Pereira, Faculty of Sciences and Technology, NOVA University of Lisbon
TO BE REVISED: The Faculty of Sciences and Technology and the NOVA University of
Acknowledgements
I would like to take this opportunity to firstly thank Prof. Freek Kapteijn and Prof. Isabel Fonseca, for making this last months in the Catalysis Engineering group possible, where I have been surrounded by amazing and inspiring people.
To my daily supervisor, Irina Prokopyeva, who I am incredibly thankful for including me in her project and for her constant guidance and motivational words every time when I was in need of them. With no less importance, I thank Jorge Gascon for his availability and help, as well as to Filipe Lopes and Rob Berger, without whom I would have never had the vision to pursue my work on modelling.
To all the CE group, with particular relevance to the people who have been such a huge support, not only in terms of my thesis but also whenever I needed a good laugh. Thank you Constantino Maldonado, Evelien Bos, Honza Gubiš, Martijn van den Hul and Rommy Gobardhan.
To Prof. Mário Eusébio, who has always pushed me to be the most complete engineer that I could have become so far.
From all my heart, I am absolutely grateful for the amazing friends with whom I have shared this joyful adventure, providing me the time of my life: Adrien Machado, Frederico Martins, João Almeida, Manuel Ribeiro, Mariana Cruz, Marina Elisiário and Sofia Ferreira.
To the ones I left behind, I will thank you forever for being by my side throughout this five academic years. João Valentim, Nádia Pedro, Rita Ribeiro, Rita Soares, Solange Marques and Tomás Monteiro - you are such an amazing group of people and I am truly proud to be your friend.
To the most lovable people in my life to whom I am forever thankful to be family with. I thank my amazing grandmother Lurdinhas, for always caring about me and for loving me every single day, nurturing me the best one can do. Moreover, I thank the greatest father on this planet, Rui Pereira, for always being by my side, wiping my tears and putting me back on track. To my grandfather Leonel, who believe in me from the moment I was born to the day he passed away. To my incredible and supporting boyfriend, Tomás Calmeiro, for his eternal love and patience, without whom I would not have finished this chapter of my life. To my mother, Elsa Fagulha, to whom I am sure now that will be fully part of my life from here after. Moreover, I would like to especially thank Soledade Duarte and Bruno Prendi, for loving me like a daughter and for always embracing me in their family.
Abstract
With the projection of an increasing world population, hand-in-hand with a journey towards a bigger number of developed countries, further demand on basic chemical building blocks, as ethylene and propylene, has to be properly addressed in the next decades. The methanol-to-olefins (MTO) is an interesting reaction to produce those alkenes using coal, gas or alternative sources, like biomass, through syngas as a source for the production of methanol. This technology has been widely applied since 1985 and most of the processes are making use of zeolites as catalysts, particularly ZSM-5. Although its selectivity is not especially biased over light olefins, it resists to a quick deactivation by coke deposition, making it quite attractive when it comes to industrial environments; nevertheless, this is a highly exothermic reaction, which is hard to control and to anticipate problems, such as temperature runaways or hot-spots, inside the catalytic bed.
The main focus of this project is to study those temperature effects, by addressing both experimental, where the catalytic performance and the temperature profiles are studied, and modelling fronts, which consists in a five step strategy to predict the weight fractions and activity. The mind-set of catalytic testing is present in all the developed assays.
It was verified that the selectivity towards light olefins increases with temperature, although this also leads to a much faster catalyst deactivation. To oppose this effect, experiments were carried using a diluted bed, having been able to increase the catalyst lifetime between 32% and 47%. Additionally, experiments with three thermocouples placed inside the catalytic bed were performed, analysing the deactivation wave and the peaks of temperature throughout the bed. Regeneration was done between consecutive runs and it was concluded that this action can be a powerful means to increase the catalyst lifetime, maintaining a constant selectivity towards light olefins, by losing acid strength in a steam stabilised zeolitic structure. On the other hand, developments on the other approach lead to the construction of a raw basic model, able to predict weight fractions, that should be tuned to be a tool for deactivation and temperature profiles prediction.
Resumo
Com a projeção de uma população mundial crescente, a par do percurso contínuo no sentido de um maior número de países desenvolvidos, a futura procura de building blocks
químicos básicos, como etileno e propileno, deve ser correspondida nas próximas décadas tendo em vista os combustíveis disponíveis. A reação de metanol-a-olefinas (MTO) é um interessante modo de produzir esses alcenos utilizando carvão, gás ou recursos alternativos, como biomassa, a partir de gás de síntese, por sua vez direcionado para metanol. Esta tecnologia tem sido aplicada desde 1985 e na maior parte dos processos utiliza zeólitos, particularmente o ZSM-5. Apesar da sua seletividade não ser tendenciosa para a formação de olefinas leves, é capaz de resistir à rápida desativação por deposição de coque, o que o torna especialmente atrativo no que toca a ambientes industriais; contudo, esta é uma reação extremamente exotérmica, sendo portanto difícil de controlar e antecipar problemas, tais como runwaysde temperatura ou a formação de hot-spots.
O maior foco deste projeto cai sobre o estudo desses efeitos de temperatura, ao abordar ambas as frentes experimental, onde a performancecatalítica e os perfis de temperatura
são estudados, e a de modelação numa estratégia de cinco passos. O paradigma decatalytic testing encontra-se presente em todos os ensaios desenvolvidos.
Foi verificado que a seletividade para olefinas leves aumenta com a temperatura, apesar de levar também a uma mais rápida desativação do catalisador. Para contrariar este efeito, foram levadas a cabo experiências utilizando um leito diluído, tendo sido possível prolongar o seu tempo de vida entre 32% e 47%. Termopares foram colocados ao longo do leito catalítico, analisando a onda de desativação e os picos de temperatura. Foi realizada a regeneração do leito entre ensaios consecutivos e foi concluído que esta ação é um poderoso meio para aumentar o tempo de vida, mantendo uma constante seletividade para as olefinas leves, ao perder a força ácida numa estrutura zeolítica estabilizada por vapor. Foi ainda construído um modelo básico, capaz de prever frações mássicas, que deverá ser afinado para a desativação e perfis de temperatura.
Contents
List of Figures xv
List of Tables xvii
List of Symbols xxi
Notation . . . xxi
Adimensional numbers . . . xxi
Greek letters . . . xxii
Chemical species . . . xxii
Subscripts and superscripts . . . xxii
1 Introduction 3 1.1 The Methanol Economy . . . 3
1.2 Methanol-to-olefins . . . 3
1.3 Zeolites as catalysts: ZSM-5 . . . 4
1.4 Literature review: selectivity, activity and modelling in MTO . . . 5
2 Theoretical background 9 2.1 Catalytic testing . . . 9
2.2 Catalyst deactivation . . . 11
3 Methods and materials 15 3.1 General set-up description . . . 15
3.2 Catalyst preparation . . . 16
3.3 Characterisation . . . 16
3.3.1 Nitrogen adsorption . . . 16
3.3.2 X-ray diffraction . . . 17
3.3.3 Infrared spectroscopy: pyridine adsorption . . . 18
3.3.4 Temperature programmed desorption (TPD) . . . 18
3.3.5 Thermogravimetric analysis (TGA). . . 19
3.3.6 Scanning Electron Microscopy (SEM) . . . 19
3.4 Catalytic performance . . . 19
3.4.1 Selected experiments and their aim . . . 19
CONTENTS
3.5 Modelling . . . 21
4 Results and discussion 25 4.1 Catalytic testing: assumptions and real conditions . . . 25
4.2 Fresh catalyst characterisation . . . 30
4.3 Analysing the first set of experiments. . . 32
4.3.1 Selectivity and activity . . . 32
4.3.2 The effect of dilution . . . 36
4.4 Analysis of the second set of experiments . . . 37
4.4.1 Selectivity and activity . . . 37
4.4.2 Deactivation front and catalyst lifetime . . . 37
4.4.3 Regeneration . . . 40
4.5 Modelling . . . 41
4.5.1 Model 1 - Base-line. . . 43
4.5.2 Model 2 - Complete model (with some restraints). . . 45
5 Conclusions 49
6 Recommendations 53
Bibliography 55
A Catalytic testing relations 59
B Catalytic testing results 61
C Preliminar calculations for the adiabatic temperature rise 71
D Calculations for the global heat transfer coefficient 73
List of Figures
1.1 The methanol-to-olefins scheme of reactions [40] . . . 4
1.2 Zeolite structures: MFI framework type . . . 5
2.1 Major types of deactivation in heterogeneous catalysis [29]. . . 11
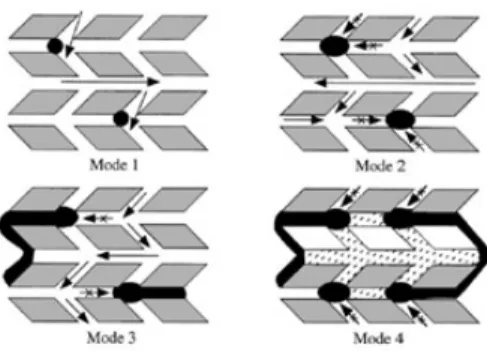
2.2 Four possible modes of deactivation by carbonaceous deposits in ZSM-5: (1) reversible adsorption on acid sites, (2) irreversible adsorption on sites with partial blocking of pore intersections, (3) partial steric blocking of pores, (4) extensive steric blocking of pores by exterior deposits [4] . . . 13
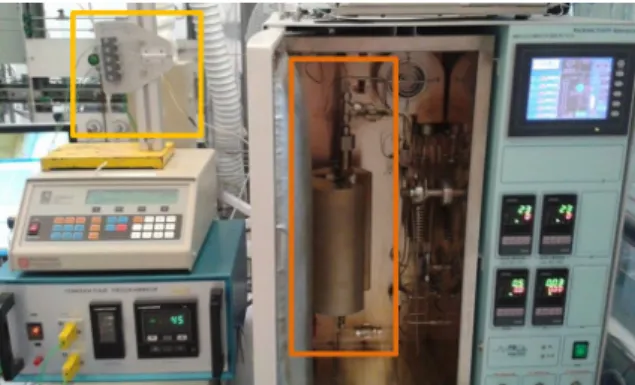
3.1 Experimental set up - yellow square: arrangement for the three thermocouples; orange rectangle: reactor and its external insulation system, surrounded by the hotbox . . . 15
3.2 Schematic representation of the three thermocouples placement throughout the catalytic bed . . . 21
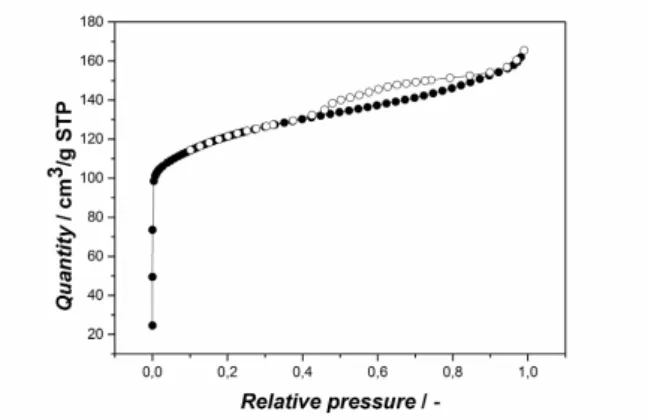
4.1 Fresh ZSM-5 CBV 8014: nitrogen adsorption and desorption isotherms . . . 31
4.2 Fresh ZSM-5 CBV 8014: pyridine adsorption with FT-IR . . . 31
4.3 Fresh ZSM-5 CBV 8014: X-ray diffraction . . . 32
4.4 SEM pictures of fresh zeolite ZSM-5 CBV 8014 at different zooms . . . 33
4.5 First set of experiments: catalyst lifetime for three different temperature, no dilution . . . 34
4.6 Selectivity towards different products for 400 °C, 450 °C and 500 °C (first set, no dilution) . . . 34
4.7 Isotherms of adsorption for fresh and spent catalyst at 400 °C, 450 °C and 500 °C (first set, no dilution) (a), making a close-up over the spent (b) . . . 35
4.8 Comparison of the catalyst lifetime at 400 °C (a) and 450 °C (b), for dilution degree of 0:1, 3:1 and 6:1 of SiC. . . 36
4.9 Study on the effects of regeneration (zero (a,b), one (c,d) and two (e,f)) over the catalyst lifetime and selectivity towards the multiple products; and temperature profiles along the catalytic bed of a 9 mm of diameter fixed bed reactor: black corresponds to inlet, red to the middle and blue at the outlet of the bed . . . . 39
List of Figures
4.11 Resume of the characterization on the two-time regenerated ZSM-5 and com-parison of it with fresh catalyst . . . 40
4.12 Matlab modelling: mass fractions profiles for time zero, function of the length of the reactor. The black curve represents methanol, the dark blue represents water, cyan blue represents DME, green represents light olefins and red is gasoline-range hydrocarbons. . . 41
4.13 Matlab modelling: catalyst activity as function of time and length of the reactor, based on the fractions at the outlet of the catalytic bed - 500 °C, mcat = 0.5 g, no dilution . . . 42
4.14 Model 1 - Weight fractions profiles on both length of the bed and time (0 s (a), 500 s (b), 1000 s (c) and 2000 s (d)), for the different species considered in the model: black for methanol, red for DME, green for light olefins (C2, C3, C4), pink for gasoline-range hydrocarbons, blue for water and purple for nitrogen. . 44
4.15 Model 1 - Methanol weight fractions with time-on-stream . . . 44
4.16 Model 1 - Activity dependence on time-on-stream. . . 45
4.17 Model 2 - Weight fractions profiles on both length of the bed and time (0 s (a) and 2000 s (b)), for the different species considered in the model: black for methanol, red for DME, green for light olefins, pink for gasoline-range hydrocarbons, blue for water and purple for nitrogen . . . 46
4.18 Model 2 - Temperature profiles throughout the length of the bed for 0 s, 1000 s, 2000 s and 5000 s. . . 47
B.1 Summary for the experiment at no dilution, 400℃, 0,5 g of ZSM-5 and a WHSV of 8h-1 . . . 62 B.2 Summary for the experiment at no dilution, 450°C, 0,5g ZSM-5 and a WHSV
of 8h-1 . . . 63 B.3 Summary for the experiment at no dilution, 500°C, 0,5g ZSM-5 and a WHSV
of 8h-1 . . . 64 B.4 Summary for the experiment at a 3:1 dilution, 400°C, 0,5g of ZSM-5 and a
WHSV of 8h-1 . . . 65 B.5 Summary for the experiment at a 3:1 dilution, 450°C, 0,5g of ZSM-5 and a
WHSV of 8h-1 . . . 66 B.6 Summary for the experiment at a 6:1 dilution, 400°C, 0,5g of ZSM-5 and a
WHSV of 8h-1 . . . 67 B.7 Summary for the experiment at a 6:1 dilution, 450°C, 0,5g of ZSM-5 and a
WHSV of 8h-1 . . . 68 B.8 Summary for the experiment at a no dilution, 500°C, 1,75g of ZSM-5 and a
WHSV of 4h-1 (the three thermocouples’ experiment) . . . 69
D.1 Schematic representation on close-up over the experimental set-up, regarding the reaction tube and the insulation system over it . . . 73
List of Tables
3.1 Experimental conditions for the first set of experiments . . . 21
3.2 Experimental conditions for the second set of experiments . . . 22
4.1 Resume some results from literature regarding catalyst lifetime . . . 25
4.2 Resume on the catalytic testing calculations for all the developed experiments. 27
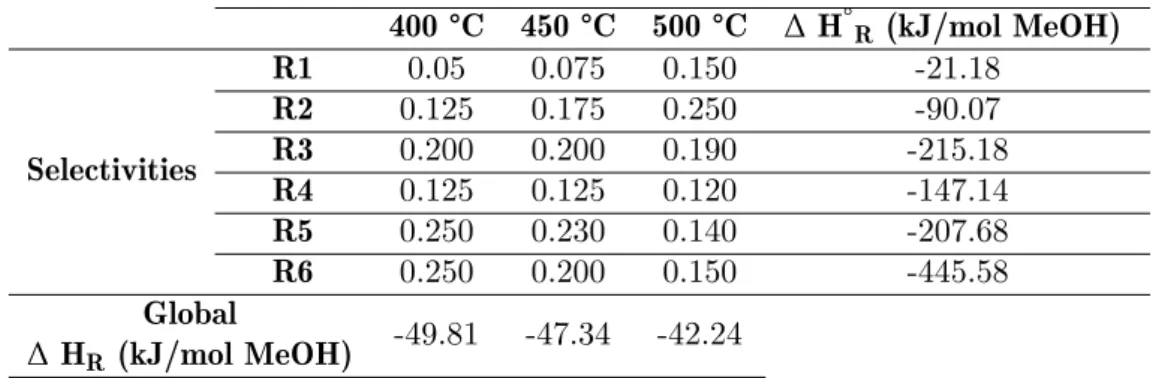
4.3 Resume on the selectivities and enthalpies of reaction (standard and global), for each reaction envolved in the hydrocarbon-pool system considered, for each temperature of operation . . . 30
4.4 Comparison of the catalyst surface area between fresh and spent ZSM-5 . . . . 35
4.5 Comparison on the acid site acidity between fresh and two-times regenerated ZSM-5 . . . 41
C.1 Standard enthalpies of reaction for the six representative in this hydrocarbon-pool system . . . 71
D.1 Resume of the flow characteristics of the gas mixture admitted to the reactor . 74
D.2 Resume of the characteristics of the stagnated air surrounding the external wall 74
D.3 Thermal conductivity for the three insulation materials involved in the reaction system . . . 75
Glossary
ATR adiabatic temperature rise.
BET Brunauer–Emmett–Teller.
DME dimethyl ether.
EDS energy-dispersive spectroscopy.
GC gas chromatography.
HPLC high pressure liquid chromatography.
IR infrared.
IZA International Zeolite Association.
MTG methanol-to-gasoline.
MTH methanol-to-hydrocarbons.
MTO methanol-to-olefins.
MTP methanol-to-propylene.
SEM scanning electron microscopy.
TGA thermogravimetric analysis.
TOS time-on-stream.
TPD temperature programmed desorption.
WHSV weight hourly space velocity.
XRD x-ray diffraction.
List of Symbols
Notation
a’specific surface area of catalyst particle [m-1] A area [m2]
Cconcentration [mol m-3] Cpheat capacity [J kg-1 K-1] Ddispersion coefficient [m2 s-1]
Ddiffusion coefficient [m2 s-1]
Eaactivation energy
kkinetic constant / mass transfer coefficient [m s-1] Kequilibrium constant [-]
Llength [m]
Nnumber of moles [mol]
rreaction rate [mol kgcat-1 s-1]
R universal gas constant (= 8.314) [J mol-1 K-1] h individual heat transfer coefficient [W m-2 K-1] Sselectivity [-]
t time [s]
T temperature [K]
u superficial velocity [m s-1]
Uoverall heat transfer coefficient [W m-2 K-1] Wmass of catalyst [kg]
X conversion [-]
y gas molar fraction [-]
Adimensional numbers
Bi Biot number [-]
BoBodenstein number [-]
CaCarberry number [-] GrGrashof number [-]
LIST OF SYMBOLS
Pr Prandtl number [-] Re Reynolds number [-]
Ra Rayleigh number [-]
Greek letters
β Prater number [-]
∆ HR enthalpy of reaction ∆ P pressure drop [Pa] ǫ porosity [-]
η effectiveness factor [-]
γ dimensionless activation energy [-]
λ thermal conductivity [W m-1 K-1] µdynamic viscosity [kg m s-1]
φThiele modulus [-]
Φ Weisz-Prater criterion [-]
Chemical species
Aoxygenate species (methanol and dimethyl ether)
C light olefins (C2, C3 and C4)
G gasoline range hydrocarbons (long paraffins)
Mmethanol
W water
Subscripts and superscripts
ax axial (in axial direction)
b bulk (when preceded by C) / bed (in any other application)
cross cross section eexternal
eff effective
f fluid phase g gas phase
glassglass material
i internal in inside
ins insulation material
SUBSCRIPTS AND SUPERSCRIPTS
obsobserved outoutside
pparticle
r/reacreaction s surface
SSstainless steel material
tottotal v volume basis
C
h
a
p
t
e
r
1
Introduction
1.1 The Methanol Economy
According to the United Nations’ latest report on population growth , it is expected that by the end of the 21st century that the humankind will have reached around 10.8 billion
individuals [2]. This projection, hand-in-hand with the fact that the standard of living and consequently the demand for energy is steadily increasing in developing countries, especially China and India, has led to discussions by the scientific community concerning feasible, renewable and alternative energy supplies for the last decades, since it is predicted that, at today’s rate of consumption, the oil reserves will last only 40 years more [33,36]. At the moment, these alternatives include biomass, hydro, geothermal, sun, wind, tides and waves energy, as well as, in a smaller proportion and unconventional use, heavy oil deposits (Venezuela), oil shale/shale gas (United States) and tar sand deposits (Canada) [32]. Naturally, oil, natural gas and coal are still the major sources of energy and fuel, but they are also the precursors for a panoply of chemical building-blocks and daily finished products whose demand will be bigger than its sole use in fuels for transportation [25].
1.2 Methanol-to-olefins
CHAPTER 1. INTRODUCTION
polyethylene negative economical balance to positive values. Therefore, their 13.31% and 1.65% share of the global coal and natural gas, respectively, can be very valuable [33,34,
43].
The methanol in this reaction is produced through syngas, a mixture of hydrogen and carbon monoxide, both via steam reforming, natural gas or from coal gasification [36]. In its turn, depending on the catalyst and/or the operation condition, the methanol in an equilibrium mixture with water and dimethyl ether, is processed catalytically through a hydrocarbon-pool mechanism, to either gasoline (methanol-to-gasoline (MTG)) or olefins (MTO) [34,36].
Figure 1.1:The methanol-to-olefins scheme of reactions [40]
The MTO process can be perceived as the further study of the Exxon Mobil’s MTG in the 1970s, which gained momentum with the first and second oil crisis [34]. This technology works with both fixed and fluidized beds, of an acid and alumina-based catalyst, where the methanol sets contact, dehydrates to dimethyl ether and then into olefins and other species, like aromatics, naphtenes, higher alkenes and n/iso-paraffins [8,34]. The operation conditions of Mobil’s process is of 400 °C and pressure surrounding the 20 bar, using ZSM-5 as a catalyst [34]. Other technologies are already developed and in the market, as the TIGAS process of Haldor Topsoe (MTG), the Mobil’s Olefin to Gasoline and Distillate (MTG), the Lurgi’s high focused in maximization of propylene (methanol-to-propylene (MTP)) and also the UOP and Norsk Hydro (now INEOS) MTO’s process, using H-SAPO-34 as a catalyst, enhancing the selectivity towards light olefins [25,34].
1.3 Zeolites as catalysts: ZSM-5
Zeolites are robust and crystalline three-dimensional frameworks, namely microporous aluminosilicates built on tetrahedrons TO4 (SiO4 or AlO4-), connected between them
through the oxygen atoms, forming subunits. These, in their own turn, shape into periodi-cally organized structures, with uniformly sized pores of molecular dimensions (4-10 Å), making them available for diverse applications where they are extensively used as molecular sieves [26]. According to the Database of Zeolite Structures by the International Zeolite Association (IZA), there are 225 framework types, being one of the most important ones the MFI, in which is included the Zeolite Socony Mobil-5 (ZSM-5) commercial zeolite [20]. This zeolite main applications are in heterogeneous catalysis, as for example methanol-to-olefins, methanol-to-gasoline, fluid catalytic cracking, aromatic conversion and other processes [13], having a crystallographic pore diameter of 0.56 x 0.53 nm [24].
1.4. LITERATURE REVIEW: SELECTIVITY, ACTIVITY AND MODELLING IN MTO
Figure 1.2:Zeolite structures: MFI framework type
The zeolites’ selectivity, activity and stability as a catalyst are not only determined by their active sites properties, but also by the dimension and shape of the micropores, openings and channels, which define one of the most important characteristics of these structures: shape selectivity [13]. On the other hand, the activity can be correlated with the strength and localization of the active sites. Nonetheless, even in the case of easy access acid sites, the global activity can be significantly affected by whether diffusional limitations or stereochemical impediments. All these concerns about the activity of the catalyst are strongly linked to deactivation phenomena [13].
Focusing in the reaction of interest to this research project, ZSM-5 is believed to be one of the most suitable for industrial application of the MTO process, not to mention at laboratory scale, mainly because of its high resistance to deactivation by coke deposition and facilitating application as simple fixed-bed reactors [25, 41]. In addition, there are some other inherent advantages of the catalyst, as its 10-ring interconnected channel system, which bestows special shape selectivity, as well as its high catalytic activity and thermal stability [36]. The ZSM-5 zeolite’s structure can be modified in such a way that its acid properties are improved and, therefore, the selectivity towards light olefins, because naturally this catalyst has a much lower selectivity when compared to SAPO-34, other broadly zeolite catalyst, in which its framework is found to easily form coke inside [25, 36,
41].
1.4 Literature review: selectivity, activity and modelling in MTO
The research surrounding the methanol-to-olefins and all its particularities is quite extensive, having been found several different fields of interest just for one process.
CHAPTER 1. INTRODUCTION
the formation of alkenes as an indirect route which uses benzene derivatives, particularly methylbenzenes, as vehicles of propagation. From this aromatic species to alkenes, there are two hypotheses of how it can occur: the paring and the side-chain methylation models. Nevertheless, this is a field in constant research and some alternatives and improvements are being proposed to the established models, as for example the dual-cycle concept, which is the most recent update in this matter as a refinement of the hydrocarbon-pool approach [34].
Another kind of studies is also quite important to address – the kinetics. These include the particular study of the activity, selectivity and lifetime of different catalysts in the MTO reaction, as well as the effect on structural (i.e. defects and shape) [3,9] and chemical modifications [42] on the process catalyst and even different operational conditions (inlet composition, temperature, pressure, etc.) [41] and used reactors (PFR, CSTR) [31].
In what activity is concerned, this matter has received extensive studies, particularly as its loss can be a consequence coke formation in the catalyst [37]. This is indeed the most important problem to address in the MTO reaction, for the fact it leads to the catalyst deactivation. The parameters that affect this phenomenon, other that the topology of the catalyst itself, are its crystal size, acid strength and acid site density [34, 41]. Both ZSM-5 and SAPO-34 have a medium-high Brønsted acidity, which promotes coke forming reactions, as for example hydrogen transfer and carbenium ion reactions, resulting in polycyclic arenes, paraffins and oligomers, which clog the catalyst’s internal channels and the intersections between them [34, 36]. Moreover, the gaseous product molecules or even the dealumination by the water present in the reaction pool can also deactivate the catalysts [16]. As ZSM-5 is a dense zeolite, the deactivation is also associated with gradual coverage of the active sites, and in that case it would be simply considered as a loss of contact time with time on-stream [34]. In spite of this progressive blockage of internal channels, some active sites remain accessible from lateral channels and so deactivation by pore blockage is delayed [36]. Although everything said about deactivation by coke formation, in principle, it is still reversible by combustion at 500-600 °C of the catalyst bed and its activity can be restored [22]. It is important to understand that the regenerated catalyst shows a lower activity than the fresh ones, possibly due to the fact that at elevated temperatures (>500 °C), and in the presence of water, there is some dealumination of the zeolite and, therefore, some active sites are lost and some mesoporosity is gained in the process [17,22].
Adding the kinetic studies to the study of the deactivation effect, one can also model the process, in order to properly simulate the reactor’s performance, which is of great interest in both theoretical and practical aspects [43]. This is of special importance, since, in spite of the considerable technological development of this process in the last decades, the kinetic and temperature modelling are two fields yet to be fully developed, because of the complex reaction scheme of the methanol-to-olefins process [17, 21]. Overall, the kinetic models can be divided in two main classes: the lumped models, where the whole system and diversity of chemical species are simplified to groups of molecules based on their similarity (chemical structure or number of carbons, for example); and the detailed
1.4. LITERATURE REVIEW: SELECTIVITY, ACTIVITY AND MODELLING IN MTO
models, which take in account all the reactions that are found in the hydrocarbon-pool [37].
C
h
a
p
t
e
r
2
Theoretical background
2.1 Catalytic testing
The development of catalysts for new processes, or even for the improvement of existent technology, encloses several progressive stages. The process starts with the combinatorial stages, where several amounts of catalyst formulations are prepared and screened for the best samples, roughly based on their overall performance, including activity, selectivity and stability. In the following steps, the chosen catalysts proceed to a quantification phase, where the kinetic studies, stability tests and eventually scale-up at a pilot plant level, are carried on. Finished this procedure, a new overview over the performance of a specific and especially chosen catalyst is reached. [14,35]
Nevertheless, the procedure of developing new and/or the optimization of commercial catalysts for a process requires for the already mentioned kinetic studies, i.e the extensive description of reaction rates as function of process variables (temperature, pressure, space-time, feed composition, etc.), to be done. For performing this testing, it is recommended to run experiments during long periods of time on stream so the catalyst stability, and therefore its practical application, can be properly evaluated. [35]
CHAPTER 2. THEORETICAL BACKGROUND
features, as its simplicity, easiness of handling, low related costs, being applicable for both gas and liquid phase systems, as well as that its operation requires little amounts of catalyst to yield primarily conversion data (not kinetic rates). Another one of the major advantages of this kind of reactor is the fact that deactivation is noted directly, which in the MTO reaction shows as a front through the reactor making the moment that all the catalytic bed is fully fouled easily detected. However, some drawbacks can be found, especially when it comes to the possibility of existing temperature and concentration gradients over the stagnant layer surrounding the catalyst pellets, or even the care to ensure that plug-flow behaviour is developed. [30,35]
Particularly the problem regarding intra- and extra-particle gradients rise from the presence of non-ideal phenomena inside a reactor that should perform in an ideal way [35]. This means that mass and heat transport limitations cannot be neglected and, therefore, they affect the observed catalytic activities and selectivities. Taking a step back, the following are the stages of a catalytic reaction and that have to be considered in all testing experiments [14]:
• Diffusion of the reactants from the bulk fluid to the external surface of the catalyst pellet;
• Again, diffusion through the boundary layer that surrounds the particles;
• Diffusion of the reactant from the pore mouth through the catalyst pores, to the intermediate vicinity of the internal catalytic surface;
• Adsorption of the reactants onto the catalyst surface, followed by reaction and product desorption;
• Diffusion of the products from the interior of the pellet to the pore mouth at the external surface;
• Mass transfer of the products from the external pellet surface to the bulk fluid, passing through the boundary layer once again.
All of the above steps act as a resistance for both transport and reaction, so they can create internal and/or external diffusional limitations in the overall catalytic performance. Some of these limitations can be avoided by playing with some of the catalyst features, as the particle size and shape, and even with the hydrodynamics of the process. Nonetheless, in order to guarantee that accurate measurements of the intrinsic kinetics are extracted from the catalytic testing experiments, there is a series of recommendations and criteria that should be addressed and verified (see Appendix A). [14,23,30]
Even if all the required criteria is verified and respected, progressively with time-on-stream the catalyst bed loses its initial activity. This catalytic deactivation adds another level of complexity to the catalytic performance in study, for it affects the correct reading
2.2. CATALYST DEACTIVATION
of the rate parameters and reaction pathways. One can say that, if accounting for the activation factor, the reaction rate law becomes [14]:
r′
A=a(t)·k(T)·f(CA, CB, . . .) (2.1) This factor a, in its own turn, is not only a function of time, but also again dependent on the concentration of the diverse species in the reaction mixture in each length of the reactor, having a deactivation kinetic constant of its own. This relation between both catalytic decay and reaction rate complicates the analysis of the catalytic phenomena, especially when it comes to modelling. [14]
2.2 Catalyst deactivation
Focusing on catalyst deactivation, this is one of the major concerns when operating industrial chemical reactors. This phenomenon is extremely complex in terms of the number of reactions and causes that can lead to the activity loss by the catalyst. It is a process of both chemical and physical nature that can occur by a number of different mechanisms, in reactions parallel or in series with the main reaction. The rate of deactivation can vary, according to its origin and process conditions, being clear that the choice of a reactor (fixed-bed, fluidized, slurry, etc.) and the needs for regeneration depend on these, and also on the extent of the deactivation. The study of the field of catalytic deactivation does still face a number of challenges and deserves great attention, because eliminating or limiting the phenomenon leads to catalyst improvement, makes processes more economical and independent from additional capital investment. [4,15,29]
The five main mechanisms of deactivation are poisoning, fouling or coking, thermal degradation (sintering, evaporation), mechanical damage and corrosion/leaching. Both poisoning and fouling can be reversed and the catalyst regenerated; and in the case of sintering, evaporation and leaching, the catalytic material should be redispersed or the active sites restored by chemical vapor deposition (CVD) treatment. [29]
Figure 2.1:Major types of deactivation in heterogeneous catalysis [29]
CHAPTER 2. THEORETICAL BACKGROUND
and the overall catalyst performance. However, poisoning can be advantageous, acting as a strategy to shift the selectivity towards some species, although at the expense of the activity. [4,15,29]
In the case of the reaction being conducted at high temperatures, thermal degradation can occur, affecting the crystallite shape and dispersion, collapsing of the support structure of the catalyst or even generating some solid-state reactions and transformations of the catalyst phase. Regarding the first mentioned consequence, which is referred to as sintering, it leads to the loss of the active surface and occurs in metal phase-including catalysts, where migration of crystallites or atoms and their coalescence are observed [13]. This deactivation mechanism can occur in all stages of the life-cycle of the catalyst, whether during calcination, reduction, reaction or regeneration. [29]
Considering mechanical failure, this can be observed in several forms, as for example crushing of granular, pellet or monolithic catalyst forms due to a certain load over the bed and attrition between the particles, leading to size reduction and breakup of catalyst granules or pellets to produce fines. The mechanical strength of the particles are dependent of their shape (spherical is preferred) and porosity (macropores in the structure reduces its strength). [4,29]
Fouling or coking might be the most studied deactivation mechanism. It is also the most frequent in zeolite ZSM-5, when researching about the MTO reaction. This mechanism covers all phenomena where a surface is covered with a deposit (being its origin not always related to the reaction process) and resulting in the loss of the catalyst activity by blockage of the sites, pores, channels and/or intersections [4]. The material involved in fouling can be defined has either carbon or coke: carbon is considered the product of CO dispropor-tionation (2CO→C+CO), whereas coke has its origin in the decomposition (cracking) or condensation of hydrocarbons. The pathway to coke is rather complex and involve a number of steps, of which the main are the dehydrogenation to olefins, olefin polymerization, olefin cyclization to form substituted benzenes and the formation of polynuclear aromatics from benzene. These reactions proceed via carbenium ions intermediates and are catalysed by the zeolite’s Brønsted acid sites [15]. Also, the extent of the reactions depend on the operation conditions (temperature, pressure, partial pressure of steam, composition of the stream, age of the catalyst), affecting therefore the chemical structure of the carbonaceous deposits. Moreover, the coke takes forms that vary from high molecular weight hydrocarbons to primarily carbons, such as graphite and soot [4].
This mechanism of deactivation covers both acid-site poisoning and pore-blocking: at short contact times, coking is relatively slow and deactivation is mainly due to acid-site poisoning; while at long contact times, coking is much faster because of the high concentration of coke precursors. Moreover, if it is the case that the zeolite has small pores or apertures and/or a mono-dimensional structure, deactivation will happen quickly [4,15].
As it has been mentioned before, the free pathway to access the active sites can be blocked by either direct deposition of carbonaceous species upon the sites and the micropores of the zeolite, or by blocking of the entrance to these micropores, with deposition on the
2.2. CATALYST DEACTIVATION
Figure 2.2:Four possible modes of deactivation by carbonaceous deposits in ZSM-5: (1) reversible adsorption on acid sites, (2) irreversible adsorption on sites with partial blocking of pore intersections, (3) partial steric blocking of pores, (4) extensive steric blocking of pores by exterior deposits [4]
catalyst’s channels and intersection [22]. The first kind of deactivation is called internal and can be easily found at low temperatures, where the coke is mainly formed by condensation and rearrangement reactions; the second one, which can result from hydrogen transfer reactions at temperatures above 350 °C, is coke deposition in the external surface, having been concluded as the major contributor to catalyst deactivation in the MFI category of zeolites [31, 34]. Internal deposition of coke is hard to analyse from the fact that it is difficult to distinguish the coke precursors from the intermediate species involved in the hydrocarbon-pool mechanism (polymethylated benzenes), being even considered by some researchers that these chemical species can play both roles, depending on their local environment inside the ZSM-5 framework. [3]
C
h
a
p
t
e
r
3
Methods and materials
3.1 General set-up description
For the practical part of this research project, the experiments were run making use of a 9 mm of diameter fixed-bed reactor, installed inside the Micrometrics Microactivity Reference unit (PID EngTech®). In Figure 3.1, can be seen a picture of the used set-up,
also including the later addition of the three thermocouples system.
This machine provided the different reactions conditions, namely the hotbox and reaction temperature, the nitrogen and methanol flows and proportions, and also the system’s pressure. To feed the methanol to the reactor system, an high pressure liquid chromatography (HPLC) pump (307 5-SC-type piston pump, Gilson®) was used. Regarding
the effluent stream of the reactor was evaluated throughout the experiment time period by a gas chromatography (GC) device, CompactGC (Interscience®), therefore following the
stream’s composition in real time, which then made possible to detect the deactivation timing. This apparatus was equipped with a 15 m capillary RTX-1 (1% diphenyl-, 99% dimethylpolysiloxane) column and a flame ionization detector.
Figure 3.1:Experimental set up - yellow square: arrangement for the three thermocouples;
CHAPTER 3. METHODS AND MATERIALS
3.2 Catalyst preparation
The chosen catalyst for this study was the ZSM-5 CBV 8014 (Si/Al=40) from Zeolyst International®. This zeolite was chosen for the fact of its role in the MTO reaction has been
widely studied and can be compared to the current literature, regarding its performance. Moreover, although its selectivity towards light olefins is not as high as, for example, when using SAPO-34, its deactivation is slower, which makes possible longer time-on-stream experiments. Nonetheless, this catalyst is the most extensively used in the industry, making very attractive the concept of better understanding its performance and deactivation profiles in order to draw useful conclusions about how to run under better operation conditions.
The commercial catalyst was pelletized to dimensions between 250µm (40 mesh) and
425µm (60 mesh). The resulting pellets were made of use to build the catalytic bed inside the reaction glass tube. Three kinds of beds were created and studied, distinguishing between each other by the amount of silicon carbide (SiC) added: no dilution (purely zeolite), 3:1 and 6:1 (mass basis). These different dilution amounts were used to study the isothermal effect of adding an inert species to the bed. However, one must keep in mind that the mixing of the inert with the zeolite was done by manual agitation, which means that a truly homogeneous bed cannot be guaranteed and the same bed characteristics are not assured between assays.
3.3 Characterisation
A correct characterisation of the catalyst in hands is fundamental for the understanding of its performance during the experiments, and also after its deactivation to verify the extent of coke deposition and the changes in the textural characteristics. From the many existent techniques, the following were selected.
3.3.1 Nitrogen adsorption
One of the most frequently used techniques for the study of the textural aspects of a catalyst is physisorption, namely nitrogen adsorption. This is a quite helpful technique to analyse the micro- and mesoporous structure of the catalyst, as well as to calculate the total surface area and to profile the adsorption and desorption isotherms (including the possible hysteresis effect), which both depend on the particular dimension and shape of the pores. Inside a small range of relative pressures, the Brunauer–Emmett–Teller (BET) analysis can be performed because the adsorption phenomenon is assumed as a modified Langmuir profile, considering both mono- and multilayer adsorption. The experimental data is first fitted with the following expression and for the range of 0,05< p/p0<0,3,
the amount adsorbed at the monolayer coverage is found and this value can be used to
3.3. CHARACTERISATION
calculate the total surface area of the catalyst (SBET). [30]
p
nad(p0−p) = 1
nmC +
C−1
nmC
p
p0 ⇒SBET =nmAmNa (3.1)
Where p is the gas pressure, p0 is the reference pressure, nm is the amount of gas
adsorbed in a monolayer coverage of the zeolite,C is a constant related to the
adsorbate-adsorbent interaction,Am is the occupied area one molecule of adsorbent and NA is the
Avogadro number.
One has to keep in mind that for lower relative pressures, the BET equation is not valid because of the micropore filling, which is diffusion rate dependent, and that some heterogeneity can be observed. In the other hand, at high values of relative pressure, capillary condensation takes place and consequently the BET equation is not valid. [30]
In this research project, adsorption/desorption of nitrogen and associated calculations were performed with the set-up TriStar II 3020 Micrometrics (PID EngTech®) and its
associated software. First, the sample was submitted to degassing, where it is submitted to vacuum with nitrogen overnight (16 h) at 350 °C, liberating all the sample surface from previous molecular contamination. In the next morning, the tube containing the degassed sample was then transferred to the nitrogen adsorption set-up. This technique was used on both used and deactivated catalyst.
3.3.2 X-ray diffraction
For the determination of the chemical and crystalline structure of the catalyst, x-ray diffrac-tion (XRD), the powder method, was performed. This technique consists in bombarding the solid sample with X-rays, which are composed of photons resultant from the irradiation of a metallic source, from the incidence of an intensive beam of high-energy electrons [30]. The collection of data results from the elastic scattered ones that are emitted for different angles of incidence of the beam [30].
This technique is developed based on Bragg’s law.
nλ= 2dsinθ (3.2)
Where n is an integer, λ is the wavelength of the incident X-ray beam, d is the
distance between two atomic layers in the crystal (planes of interference), and θ is the
angle of incidence and the angle of diffraction. The resulting spectra represents the existent crystalline patterns and relates them with the Bragg angle of incidence.
The XRD patterns of the powders of the fresh catalyst were recorded in Bragg–Brentano
geometry with a Bruker D8 Advance® X-ray diffractometer equipped with a LynxEye
CHAPTER 3. METHODS AND MATERIALS
3.3.3 Infrared spectroscopy: pyridine adsorption
In what infrared (IR) spectroscopy is concerned, this is one of the strongest and most important characterisation catalyst techniques, for the fact that it not only displays information about the composition and chemical structures present in the zeolite, as it can also fully identify the acid sites, namely their number, strength and type [13]. This analysis is usually performed using a probe molecule, typically ammonia and pyridine, but nitrogen and carbon monoxides can also be used to extract information on the oxidation state and local environment of the active phase of the catalysts [30].
For this research project, the chosen molecule was pyridine, whose its interaction with the different acidic sites is well studied: when adsorbed on a Brønsted site, it forms a protonated pyridium ion; whereas adsorption on a Lewis site leads to a coordination complex [30].
In this research, the technique was performed by making use of a Nicolet Nexus spectrometer (Thermo Scientific®) at 4 cm-1 resolution, equipped with a an extended KBr
beam splitting and a mercury cadmium telluride (MCT) cryo-detector. Around 0.05 g of a catalyst sample were pressed at 1132 kg/cm2 for 5 s to form a self-supporting wafer
of 1.5 cm of diameter. The sample was then degassed at 120 °C for 2h under vaccuum (2.10-5 mbar). Pyridine vapour was dosed to the sample stepwise via a known volume and pressure. After each step, the sample was heated at 160 °C to allow diffusion of the probe molecule and, subsequently, cooled to room temperature for spectra collection.
3.3.4 Temperature programmed desorption (TPD)
Another characterisation technique performed was temperature programmed desorption (TPD), which can make a quantitative description of the acid site distribution and the site’s strength, essential to correlate the acidity and the catalytic activity of a catalyst, but cannot discern their nature [13].
This characterisation was performed with the help of the Auto Chem II Chemisorption Analyser Micrometrics (PID EngTech®). First, approximately 0.2 g sample were degassed
to desorb any adsorbed species on its surface, which was performed under helium flow at the rate of 10 °C/min. This was carried on until 400 °C was reached and then the sample was saturated with ammonia at 200 °C, during 1 h and using a flow of 1.65% NH3
in helium. Then, the gas mixture was switched back to pure helium and the sample was purged at 200 °C for about 1 h to remove any molecule physisorbed on the surface of the catalyst. At last, a step of 10 °C/min was programmed from 200 °C to 800 °C, also under helium flow, and the ammonia desorption was then followed with a thermal conductivity detector. All flow rates were adjusted to 25 mL/min.
TPD is basically built upon the assumption that each probe molecule is related to one and only acid site, which means that the area below to the TPD curve is proportional to the amount of sites present in the catalyst. A relative analysis of the strength of the sites is also possible, based on the temperature at which ammonia is desorbed. [13]
3.4. CATALYTIC PERFORMANCE
3.3.5 Thermogravimetric analysis (TGA)
A thermogravimetric analysis (TGA) was executed as well, with the main goal of un-derstanding the temperature at which the fresh catalyst collapses, but also to make a quantitative analysis of the coke present in each deactivated sample. This technique was
performed by means of a Mettler Toledo TGA/SDTA851® on samples of roughly 20 mg,
under flowing 100 mL/min of air at a heating rate of 5 °C/min up to 1000 °C.
3.3.6 Scanning Electron Microscopy (SEM)
Finally, the last characterisation technique performed on both fresh and regenerated catalyst was scanning electron microscopy (SEM). This is a powerful microscopy technique which can give information on particle size and distribution of the active phases, allowing direct observation of the sample particles as well. Its operation is based on the irradiation of the sample with an electron beam which then generates the ejection of secondary electrons from the sample or the backscattering of incident electrons which can be detected by specific detectors inside the chamber. The intensity of the signal produced in the respective detectors by these electrons can be used to generate a topographic image of the sample besides other type of analysis, such as energy-dispersive spectroscopy (EDS), which allows to analyse a sample and identify which chemical elements are present in it. [30]
Images for this dissertation were produced using a JEOL JSM-6010LA SEM with
standard beam energy of 10 keV and a Everhart-Thornley® detector. The SEM/EDS
analysis (SEM coupled with an EDS system with a silicon-drift detector) was used to confirm the elemental composition of the sample.
3.4 Catalytic performance
3.4.1 Selected experiments and their aim
Two sets of experiments were taken into practice, each one with different experimental conditions and, naturally, distinct goals.
3.4.1.1 First set – lifetime and selectivity: the effect of temperature and dilution
First of all, both the selectivity and overall lifetime before methanol breakthrough were studied. These experiments were carried on with fresh ZSM-5 CBV 8014, in a 0.50 g bed, to three different temperatures: 400 °C, 450 °C and 500 °C.
CHAPTER 3. METHODS AND MATERIALS
3.4.1.2 Second set – temperature profiling and regeneration
For this second group of experiments, the typical set-up for the previous experiment was improved by placing three thermocouples at different heights inside the catalytic bed, making it possible to read the temperatures at its beginning, middle and bottom.
Regarding the chosen temperature for this second set, it was chosen to be 500 °C, at which the selectivity towards light olefins is higher. Although a shorter time-on-stream for such high temperature can be expected, comparing with the other two developed in the first set, this can be overcome by increasing the length of the bed. Moreover, it is also the chosen temperature for the industrial environmental using this technology nowadays [34], which means that experiments using this condition can be much more comparable with what is daily found in the plants using the MTO reaction, specially in what the temperature profiles throughout the bed are concerned.
Nevertheless, between runs of around 50 h time-on-stream (TOS), the catalyst was regenerated by coke combustion with air at 550 °C during 2 h. Both temperature profiles, during the reaction and regeneration runs, were recorded, and these experiments were performed three times each.
After all the experiments were run, the collected data was analysed to verify if the catalytic testing conditions were satisfied, particularly to evaluate if the assumption for plug flow behaviour was valid and what was the extent of pressure drop, heat transport and diffusional (internal and external) limitations, as well as if the amount of bed dilution is acceptable.
3.4.2 Experimental conditions
Both sets of experiments were initialised in the same fashion. Inside the reaction tube the catalytic bed was built, using quartz wool as a support in its bottom and adding the desired amount of zeolite on top. If a diluted bed was desired, a precise amount of silicon carbide was weighted and add to the catalyst powder already inside the reaction tube. The homogeneity of the bed was achieved by carefully shaking the bed. Then, this reaction tube was placed inside a stainless steel tube, which in its turn is surrounded by an external wall, being everything placed inside the hotbox.
There are two thermocouples placed in the basic set-up: one near the middle of the catalytic bed, outside the reaction tube; and another in the hotbox itself. Both of these temperatures are specified with set-points. Moreover, for the second set of experiments, three thermocouples were placed inside the catalytic bed at specific heights: the first one is at 0.5 cm (T1) from the bed’s inlet, the following is 1 cm bellow (T2) and the last one
is 2 cm under the second (T3). A simple representation of the placement of the three
thermocouples in the catalytic bed is shown in Figure3.2.
Before initiating the reaction, i.e. admitting the nitrogen and methanol (1:1) mixture, the flow had to stabilise in a full cycle of preheating of the hotbox, taking around 2 h, with nitrogen being constantly circulated through the reactor. Then, a mixture of nitrogen
3.5. MODELLING
Figure 3.2:Schematic representation of the three thermocouples placement throughout the
catalytic bed
and methanol was made and bypassed to be analysed using gas chromatography, so it was guaranteed that the stream’s flow and composition was constant and stable, when admitted to the reactor. Moreover, this flow is used to calibrate the system, so it is possible to measure afterwards the amount of methanol that is consumed, as well as it is makes possible to evaluate the selectivity towards the multiple amounts of products.
Each experiment finishes between 10 to 120 hours after the methanol admission to the reactor, depending on the rate at which coke is formed inside the bed, thus this being related with the mass of catalyst, weight hourly space velocity (WHSV), temperature and dilution rate used in each experiment. When the methanol breakthrough was achieved, which is detected by the increase of methanol in the outlet stream by the GC (conversion drops from 100% to 0%), the experiment is disengaged and the data collected.
Particularly in the second set of experiments, there were three reaction runs and between each one the catalytic bed was regenerated.
Both fresh and spent catalyst from the two sets of experiments were submitted to characterization, as it has been thoroughly described in the previous section.
A resume of the experimental conditions for the first set and second set of experiments can be found in Tables 3.1and 3.2.
Table 3.1: Experimental conditions for the first set of experiments
Temperature Pressure Inlet proportion (MeOH:N2)
WHSV (gMeOH/gcath)
Time on stream Mass of ZSM-5 No dilution 400 °C
1.0 - 1.1
bar 1:1 8 h-1
40 h
0.50 g
450 °C 22 h
500 °C 11 h
Dilution
3:1 400 °C450 °C 63 h35 h
6:1 400 °C450 °C 63 h37 h
3.5 Modelling
CHAPTER 3. METHODS AND MATERIALS
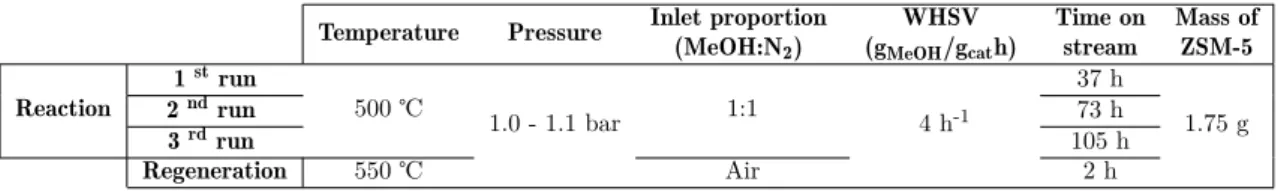
Table 3.2: Experimental conditions for the second set of experiments
Temperature Pressure Inlet proportion (MeOH:N2)
WHSV (gMeOH/gcath)
Time on stream
Mass of ZSM-5
Reaction
1strun
500 ℃ 1.0 - 1.1 bar 1:1 4 h-1
37 h
1.75 g
2ndrun 73 h
3rdrun 105 h
Regeneration 550 ℃ Air 2 h
it should include the simulation for the axial and radial temperature profiles inside the catalytic bed, for the different experimental conditions that were performed.
Nevertheless, for the construction of that model, it was chosen as a reference the lumped model proposed by Gayuboet al., where there are eight generic reactions considered, starting
from the equilibrium reaction between methanol (M) and dimethyl ether (DME) (D), and passing through the production of light olefins (C) and gasoline range hydrocarbons (G). [16]
2Mk←→1/k1′D+H20 (3.3)
M k2
→C (3.4)
Dk3
→C (3.5)
2C k4
→G (3.6)
M+C k5
→G (3.7)
D+C k6
→G (3.8)
Considering the latter reactions, it can also be adapted the following net rate expressions at zero time-on-stream, assuming no deactivation inside the catalytic bed.
• Methanol
rM0= "
dXM d(W/F
M0)
#
0
=−k1XM2+ (k1/K)XDXW−(k2+k5XC)XM
1 +KWXW (3.9)
• Dimethyl ether
rD0= "
dXD d(W/F
M0)
#
0
=k1XM2−(k1/K)XDXW−(k3+k6XC)XD
1 +KWXW (3.10)
3.5. MODELLING
• Light olefins
rC0= "
dXC d(W/F
M0)
#
0
=k2XM2+k3XD−k4XC2+ (k5XM+k6XD)XC
1 +KWXW (3.11)
• Gasoline range hydrocarbons
rG 0=
" dXG d(W/FM0)
#
0
=k4XC2+ (k5XM+k6XD)XC 1 +KWXW
(3.12)
• Water
rW0= "
dXW d(W/F
M0)
#
0
=k1XM2−(k1/K)X
DXW (3.13)
Where ki are kinetic constants and Xi are weight fractions by mass unit of the organic
compounds.
As a consequence of the coke deposition, adjustments on these rates are later performed by introducing the relative catalytic activity in each moment of the experiment:a= ri
ri0. It is also proposed by the authors of this model that this factor for deactivation is partially selective, as it considers the same activity for all the steps of the kinetic scheme except for the first one, the methanol dehydration reaction, which is assumed to be slower than the other steps:aD=a0.25. [16]
Moreover, activity is considered to be the product of recoverable and irreversible activities, being the first related to coke deposition in the zeolite structure and the second with its dealumination by the produced steam in the methanol dehydration reaction [16]. Anyhow, for the span of temperatures used in the experiments, dealumination is not considered for the sake of the simplification of the model. Hence, the activity turns out to become the following expression, being the species A the oxygenates (methanol and dimethyl ether) [16].
−dar
dt =
kdAXA+kdCXC+kdGXG
1 +kdWXW (3.14)
The next step consisted of taking the above expressions and creating a routine in which the both activation and the mass fractions of the species could be intertwined. The first attempt of doing that was performed in Matlab®, having been successful in the
CHAPTER 3. METHODS AND MATERIALS
decided to make a new approach to the model, creating a new routine in Athena Visual Studio 14.0®.
In this new model, not only the above expressions were considered, but also the mass and enthalpy balance to the gas bulk were included (a thorough description on the developed model can be found in [6]):
1. Mass balance in the bulk: accumulation = axial dispersion – convection – reaction;
∂Ci,b
∂t =
Dax,i
εbhb2
∂2Ci,b
∂2z − u0 εbhb
∂Ci,b ∂z −
Ci,b εbhb
∂u0 ∂z −
Wcat Acrossε0hb
ri (3.15)
Where the boundary conditions to solve this equation are the following:
• Left boundary condition (z=0):
Dax,i
hb
∂Ci,b
∂z =− u0,f
εb (Ci,f eed−Ci,z=0) (3.16)
• Right boundary condition (z=1):
∂Ci,b
∂z = 0 (3.17)
2. Heat balance for the gas bulk including the inert packing between the catalyst particles: accumulation = axial conduction – (axial) convection – heat transfer to the catalyst pellets – heat transfer to the wall;
(εbρGCp,G+ (1−εb)bρdilCp,dill)
∂Tb
∂t = (3.18)
=λax
h2
b
∂2Tb
∂z2 −
Cp,GρGu0 hb
∂ Tb
∂z −
Wcat Acrosshb
X
i
(−∆rHiri)−hwAw(Tb−Tw)
Where the boundary conditions to solve this equation are the following:
• Left boundary condition (z=0):
λax hb
∂Tb
∂z =−Cp,G,f eedu0,f eedρG,f eed(Tf eed−Tb) (3.19)
• Right boundary condition (z=1):
∂Tb
∂z = 0 (3.20)
As a result, a model which simulates the product profiles with time on stream and position in the catalytic bed, and also the activity profiles and temperature for the same variables, was successfully built.
C
h
a
p
t
e
r
4
Results and discussion
This chapter includes the analysis of the experimental results and how they are related to the catalytic testing assumptions and conditions, as well as the modelling work developed throughout this project.
4.1 Catalytic testing: assumptions and real conditions
In the Chapter 2, the importance of the catalytic testing mind-set over the engaged experiments was explained. Particularly, its relevance can even be easily underlined through a simple exercise. At the beginning of this research, a preliminary comparison, between our first results of the dependence of selectivity and catalyst lifetime with regards to the operating temperature, and published ones already over this subject, which used ZSM-5 as a catalyst with a similar Si/Al ratio, was performed. This revealed a clear incongruence between the two (Table4.1).
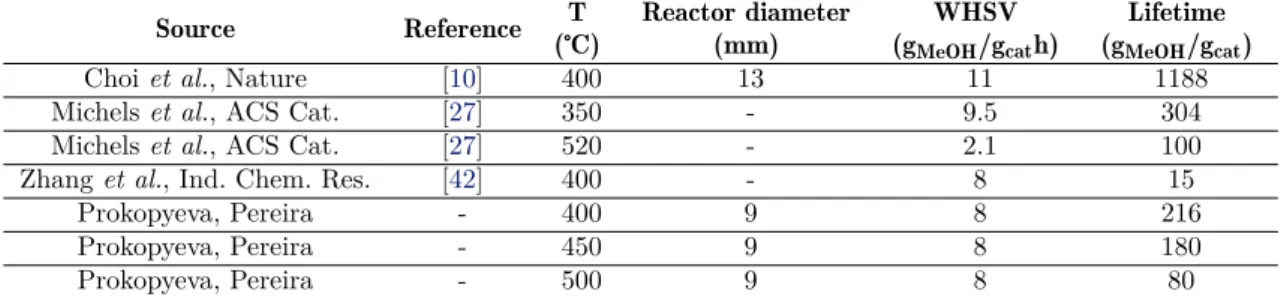
Table 4.1: Resume some results from literature regarding catalyst lifetime
Source Reference T (℃)
Reactor diameter (mm)
WHSV (gMeOH/gcath)
Lifetime (gMeOH/gcat)
Choiet al., Nature [10] 400 13 11 1188
Michelset al., ACS Cat. [27] 350 - 9.5 304
Michelset al., ACS Cat. [27] 520 - 2.1 100
Zhanget al., Ind. Chem. Res. [42] 400 - 8 15
Prokopyeva, Pereira - 400 9 8 216
Prokopyeva, Pereira - 450 9 8 180
Prokopyeva, Pereira - 500 9 8 80
For example, the work of Choi et al. [10] report a lifetime of the catalyst five times
CHAPTER 4. RESULTS AND DISCUSSION
regime. These authors did not take in account the importance of catalytic testing, and that is quite clear when evaluating their experimental approach. Choi’s group used a fixed-bed reactor like in the case of this research project; however, theirs had an internal diameter of 13 mm (in our group it is of 9 mm) and one fifth of the mass it was used as catalytic bed. Clearly, these conditions do not allow plug flow behaviour, even though the pellets size is not mentioned, since the height of the bed is quite small (assuming a standard porosity of 0.38), only 1.05 mm. Those results are not reliable or reproducible, thus justifying the need of developing experiments which respect the catalytic testing conditions, so they can become a reference for future works in this field. Making an overall observation, it is possible to affirm that all the results are dependent not only of the reaction temperature and weight hourly space velocity, but also on the reactor and bed design (e. g. internal diameter and bed height).
In order to reach those trustworthy and reproducible results, one must assure that is working in a combination of conditions which are within perfect catalytic testing requirements. Those include a set of expressions and span of accepted values that govern plug flow behaviour, allow to neglect axial dispersion, guarantee that the amount of dilution agent is appropriate so no bypassing of the catalyst can happen, and many other assumptions (see Appendix A). The summary of those calculations for both set of experiments developed can be found in Table 4.2, having been considered a constant methanol conversion of 99.14%, resulting in observed rates of reaction of 0.6 and 0.3 molMeOH/kgcats for the first and second sets of experiments, respectively.
Making a comprehensive glance over the results, one can firstly realise that not in all developed experiments the criterion for plug flow behaviour was respected. In fact, that was respected in the cases of a high dilution degree and in the three thermocouple experiments.
Moreover, Reynolds, Sherwood and Nusselt numbers are quite close to each other between experiments, which can indicate that not only the developed flow (laminar), but also the mass concentration and heat gradients, are equal between the different sets of experiments.
As expected, the Peclet number differs a great amount in each different experiment. Being directly related with the quality of the heat transfer conditions, the Peclet number is a reflection of the limitations regarding this parameter, thus it is as expected, as higher as the dilution degree or the length of catalytic bed (mass of ZSM-5) is.
Furthermore, the pressure drop for the experimentation systems used is not relevant in any case, surrounding values of the order of magnitude of the millibars. Other parameters in which one cannot perceive much difference between experiments are the internal and external efficiency factors. Those are directly related with the mass transfer gradients and conditions, in which it has been already concluded that those do not vary greatly between different experiments. Particularly, regarding the external efficiency factor, its value is always of 100%, meaning that no external mass transfer limitations are observed in any experiment. On the other hand, internal mass transfer efficiency is consistent within the first set of experiments (62%), but is slightly lower that the value found for the second
4.1. CA T AL YTIC TESTI NG: ASSUMPTIONS AND REAL
Table 4.2: Resume on the catalytic testing calculations for all the developed experiments
Dilution
No dilution 400 °C 450 °C 3TC
400 °C 450 °C 500 °C 3:1 6:1 3:1 6:1 500 °C
Re 0.36 0.34 0.32 0.36 0.36 0.34 0.34 0.56
Pe 20.16 19.12 18.21 42.24 64.32 40.07 61.03 109.93
Bo 0.50 0.48 0.45 0.50 0.50 0.48 0.48 0.77
Sh 2.01 1.98 1.95 2.01 2.01 1.98 1.98 2.27
Nu 1.04 1.02 1.00 1.04 1.04 1.02 1.02 1.25
ATR (°C) 200.47 160.99 100.94 200.47 200.47 160.99 160.99 100.94
Pressure drop (bar) 7.94·10-4 8.90·10-4 9.89·10-4 1.66·10-3 2.54·10-3 1.86·10-3 2.84·10-3 6.72·10-3
ηi 0.62 0.62 0.61 0.62 0.62 0.62 0.62 0.74
ηe 1 1 1 1 1 1 1 1
Plug flow assumption
Not allowed: 32.59 ≯75.92
Not allowed: 32.59≯79.90
Not allowed: 32.59≯83.80
Not allowed: 68.29≯75.92
Allowed: 103.99 > 75.92
Not allowed: 68.29≯79.90
Allowed:
103.99 > 79.90 Allowed:114.05 > 49.69
Mass transfer limitations Internal WP criterionExternal Ca 3.061.29·10-3 2.941.34·10-3 2.841.38·10-3 3.061.29·10-3 3.061.29·10-3 2.941.34·10-3 2.941.34·10-3 1.220.69·10-3
Heat transfer limitations (∆T)
Internal (K) 6.55·10-2 6.23·10-2 5.56·10-2 6.55·10-2 6.55·10-2 6.23·10-2 6.23·10-2 1.22·10-2 External (K) 10.90 9.64 8.03 10.90 10.90 9.64 9.64 3.19
Radial (K) 153.01 136.23 114.34 58.97 35.15 52.17 30.99 56.76
Axial 229.06 208.63 178.98 165.98 126.70 152.85 117.48 197.68
This table is based on the results obtained through the Eurokin’s spreadsheet Fixedbed.xls