HESSD
11, 10515–10552, 2014Effect of year-to-year variability of leaf area index on VIC model
performance
Z. K. Tesemma et al.
Title Page
Abstract Introduction
Conclusions References
Tables Figures
◭ ◮
◭ ◮
Back Close
Full Screen / Esc
Printer-friendly Version Interactive Discussion
Discussion
P
a
per
|
Discus
sion
P
a
per
|
Discussion
P
a
per
|
Discussion
P
a
per
|
Hydrol. Earth Syst. Sci. Discuss., 11, 10515–10552, 2014 www.hydrol-earth-syst-sci-discuss.net/11/10515/2014/ doi:10.5194/hessd-11-10515-2014
© Author(s) 2014. CC Attribution 3.0 License.
This discussion paper is/has been under review for the journal Hydrology and Earth System Sciences (HESS). Please refer to the corresponding final paper in HESS if available.
E
ff
ect of year-to-year variability of leaf
area index on variable infiltration capacity
model performance and simulation of
streamflow during drought
Z. K. Tesemma, Y. Wei, M. C. Peel, and A. W. Western
Department of Infrastructure Engineering, The University of Melbourne, Parkville, Victoria, 3010, Australia
Received: 12 August 2014 – Accepted: 1 September 2014 – Published: 23 September 2014 Correspondence to: Y. Wei ([email protected])
HESSD
11, 10515–10552, 2014Effect of year-to-year variability of leaf area index on VIC model
performance
Z. K. Tesemma et al.
Title Page
Abstract Introduction
Conclusions References
Tables Figures
◭ ◮
◭ ◮
Back Close
Full Screen / Esc
Printer-friendly Version Interactive Discussion
Discussion
P
a
per
|
Discus
sion
P
a
per
|
Discussion
P
a
per
|
Discussion
P
a
per
Abstract
This study assessed the effect of using observed monthly leaf area index (LAI) on hydrologic model performance and the simulation of streamflow during drought using the variable infiltration capacity (VIC) hydrological model in the Goulburn–Broken catchment of Australia, which has heterogeneous vegetation, soil and climate zones. 5
VIC was calibrated with both observed monthly LAI and long-term mean monthly LAI, which were derived from the Global Land Surface Satellite (GLASS) observed monthly LAI dataset covering the period from 1982 to 2012. The model performance under wet and dry climates for the two different LAI inputs was assessed using three criteria, the classical Nash–Sutcliffe efficiency, the logarithm transformed flow Nash–Sutcliffe 10
efficiency and the percentage bias. Finally, the percentage deviation of the simulated monthly streamflow using the observed monthly LAI from simulated streamflow using long-term mean monthly LAI was computed. The VIC model predicted monthly streamflow in the selected sub-catchments with model efficiencies ranging from 61.5 to 95.9 % during calibration (1982–1997) and 59 to 92.4 % during validation (1998–2012). 15
Our results suggest systematic improvements from 4 to 25 % in the Nash–Sutcliffe efficiency in pasture dominated catchments when the VIC model was calibrated with the observed monthly LAI instead of the long-term mean monthly LAI. There was limited systematic improvement in tree dominated catchments. The results also suggest that the model overestimation or underestimation of streamflow during wet and 20
dry periods can be reduced to some extent by including the year-to-year variability of LAI in the model, thus reflecting the responses of vegetation to fluctuations in climate and other factors. Hence, the year-to-year variability in LAI should not be neglected; rather it should be included in model calibration as well as simulation of monthly water balance.
HESSD
11, 10515–10552, 2014Effect of year-to-year variability of leaf area index on VIC model
performance
Z. K. Tesemma et al.
Title Page
Abstract Introduction
Conclusions References
Tables Figures
◭ ◮
◭ ◮
Back Close
Full Screen / Esc
Printer-friendly Version Interactive Discussion
Discussion
P
a
per
|
Discus
sion
P
a
per
|
Discussion
P
a
per
|
Discussion
P
a
per
|
1 Introduction
The challenge of making accurate streamflow predictions using hydrological models under changing or “non-stationary” conditions, due to either changing climate and or human intervention, is a significant issue in hydrology (Peel and Blöschl, 2011; Chiew et al., 2014; Milly et al., 2008). Rainfall-runoffmodels that lack representations 5
of biophysical processes, such as vegetation dynamics, have been found to perform poorly when calibrated in a wet climate period and validated in dry climate period (Coron et al., 2012; Merz et al., 2011; Vaze et al., 2010). To address this problem different studies have suggested approaches including calibrating model parameters on a portion of the record with conditions similar to those of the future period to simulate 10
(Vaze et al., 2010), using temporal clusters (de Vos et al., 2010) and adjusting the parameters according to the aridity of the catchment (Singh et al., 2011). Rather than calibrating parameters that vary with the condition in the system, understanding the catchment processes and effectively incorporating them into the model may help us to improve model performance by considering the various processes that are modified 15
with changing climate.
A large amount of evidence shows that vegetation is an important component of the hydrological process (Ford and Quiring, 2013; Peel, 2009; Peel et al., 2010; Tang et al., 2011). Vegetation has a significant role in the partitioning of rainfall into streamflow and evapotranspiration (ET) mainly through canopy transpiration and interception 20
loss (Vertessy et al., 2001). Transpiration varies according to physiological (stomatal conductance) and structural properties, mainly leaf area index (LAI) of the vegetation (Granier et al., 2000), while interception varies according to structural properties of the vegetation (Muzylo et al., 2009). Changes in LAI not only affect evapotranspiration but the consequent changes in soil moisture impact other catchment processes including 25
HESSD
11, 10515–10552, 2014Effect of year-to-year variability of leaf area index on VIC model
performance
Z. K. Tesemma et al.
Title Page
Abstract Introduction
Conclusions References
Tables Figures
◭ ◮
◭ ◮
Back Close
Full Screen / Esc
Printer-friendly Version Interactive Discussion
Discussion
P
a
per
|
Discus
sion
P
a
per
|
Discussion
P
a
per
|
Discussion
P
a
per
model performance due to underestimation of flow in dry periods and overestimation of flow in wet periods.
Recent developments in remote sensing technology provide spatially and temporally variable LAI datasets that help to capture the vegetation dynamics and can be incorporated in land surface models that include LAI in most evapotranspiration 5
processes. There have been some efforts to exploit remotely sensed vegetation information into hydrological models (Zhang et al., 2009; Tang et al., 2011). In their study of the North American monsoon in Western Mexico, (Tang et al., 2011) applied year to year variable monthly LAI and mean monthly LAI obtained from the Moderate Resolution Imaging Spectroradiometer (MODIS) into the variable infiltration capacity 10
(VIC) model to predict evapotranspiration for the years 2001 to 2008 and validated their results with observations at two eddy covariance tower sites. They found that using mean monthly LAI in VIC biased evapotranspiration estimates by 10 to 30 % due to not representing the year to year differences in vegetation greening onset and dormancy periods.
15
Similarly, Ford and Quiring (2013) investigated the effects of using observed monthly LAI compared with mean monthly LAI on simulated soil moisture from the VIC model for the period 2000–2009 in eastern Oklahoma, USA. The authors also compared VIC-simulated moisture results with in-situ soil moisture at different depths and locations and concluded that the models that incorporated observed LAI could better capture the 20
intensity and duration of droughts. To date no studies have addressed the influence of observed monthly LAI on streamflow simulation in the VIC model.
VIC hydrological model is a distributed physically based model that balances both water and energy budgets over a grid cell. It has been successfully applied in many settings, from global to river basin scale (Nussen et al., 2001; Maurer et al., 25
HESSD
11, 10515–10552, 2014Effect of year-to-year variability of leaf area index on VIC model
performance
Z. K. Tesemma et al.
Title Page
Abstract Introduction
Conclusions References
Tables Figures
◭ ◮
◭ ◮
Back Close
Full Screen / Esc
Printer-friendly Version Interactive Discussion
Discussion
P
a
per
|
Discus
sion
P
a
per
|
Discussion
P
a
per
|
Discussion
P
a
per
|
Sensitivity studies of VIC show LAI has the greatest influence on hydrologic simulations (Maurer et al., 2002). Within VIC, LAI controls the partitioning of the canopy storage into canopy evaporation and throughfall in vegetated areas. In most cases the canopy storage (mm) in VIC is estimated as 20 % of the LAI (Dickinson, 1984) and the storage is depleted using a nonlinear power function as given by (Deardorff, 5
1978). LAI is also used in VIC in the partitioning of water that infiltrates into the ground into evapotranspiration from the root zone soil column and recharge. This influence is through the vegetation canopy resistance as given by Bowling et al. (2004). Hence, neglecting the year to year variability of LAI in the VIC model might lead to lower performance in streamflow prediction and would be expected to be characterized by 10
underestimation of flow in dry periods and overestimation of flow in wet periods, given the specific roles of LAI in the model.
This paper addresses the question of whether including vegetation variations that reflect both variations in climate and human activities into a hydrological model improves model performance in terms of streamflow simulation under changing climate 15
and catchment conditions. Specifically, we examine the effects of using observed monthly LAI compared with long-term mean monthly LAI on VIC model performance in terms of streamflow prediction for the period 1982–2012. Our approach is to calibrate and validate VIC using both observed monthly LAI and long-term mean monthly LAI and compare the model performance in terms of simulated streamflow for thirteen 20
catchments in the Goulburn–Broken region of south-eastern Australia The paper is presented as follows: the study area is described in Sect. 2, followed by the dataset and model setup, the results are presented in Sect. 4, followed by discussion and conclusion sections.
2 Description of the study area
25
HESSD
11, 10515–10552, 2014Effect of year-to-year variability of leaf area index on VIC model
performance
Z. K. Tesemma et al.
Title Page
Abstract Introduction
Conclusions References
Tables Figures
◭ ◮
◭ ◮
Back Close
Full Screen / Esc
Printer-friendly Version Interactive Discussion
Discussion
P
a
per
|
Discus
sion
P
a
per
|
Discussion
P
a
per
|
Discussion
P
a
per
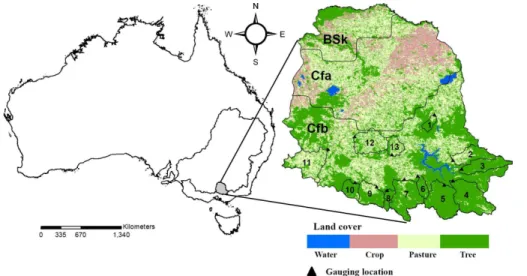
catchment covers approximately 24 000 km2representing about 10.5 % of the total area of the State of Victoria, and 18 % of the water supply for Victoria (www.riverfoundation. org.au). The Goulburn–Broken Catchment contributes about 11 % of the water resources of the MDB. The maximum altitude is approximately 1790 m a.m.s.l. on the southern side of the catchment and the minimum altitude is 86 m a.m.s.l. on 5
the northern side of the catchment. The mean catchment elevation of the selected catchment ranges from 343 to 1001 m a.m.s.l.
The climate of the Goulburn–Broken catchment is influenced by mountain ranges with high rainfall in the southern part and lower rainfall in the flat plains of the northern part (declining rainfall from south to north). The long-term (1982–2012) mean annual 10
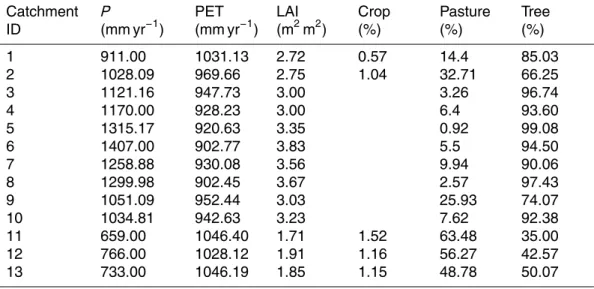
rainfall peaks at 1632 mm yr−1 in the southern mountainous area, and reaches a low of 373 mm yr−1 in the north, and in the selected catchment it ranges from 659 to 1407 mm yr−1. Winter and spring produced about 60 % of the total annual rainfall. About 45 % of the total annual rainfall in the catchments occurs in the four months from June to September. The spatial variation in reference evapotranspiration (PET), using the 15
Food and Agricultural Organization (FAO56) method, is opposite to rainfall and varies from 775 mm yr−1 in the south to 1238 mm yr−1 in the north of the catchment, and in the selected catchment it ranges from 903 to 1046 mm yr−1(Table 1). The catchment covers three climate zones based on the Köppen–Geiger climate classification as shown in Fig. 1. The north lowland part of the catchment experiences low annual 20
rainfall and high potential evaporation is semi-arid (BSk, 9 %). The middle section of the catchment has a hot summer temperate, without a dry season climate (Cfa, 35 %). The southern part of the catchment has a warm summer temperate, also without dry season, climate (Cfb, 55 %) (Peel et al., 2007).
Most of the southern part of the catchment is covered by trees: mainly open 25
HESSD
11, 10515–10552, 2014Effect of year-to-year variability of leaf area index on VIC model
performance
Z. K. Tesemma et al.
Title Page
Abstract Introduction
Conclusions References
Tables Figures
◭ ◮
◭ ◮
Back Close
Full Screen / Esc
Printer-friendly Version Interactive Discussion
Discussion
P
a
per
|
Discus
sion
P
a
per
|
Discussion
P
a
per
|
Discussion
P
a
per
|
land cover types (trees, pasture and crop) which comprise 47, 38, and 12 % of the entire catchment, respectively, with the rest occupied by water bodies and urban areas.
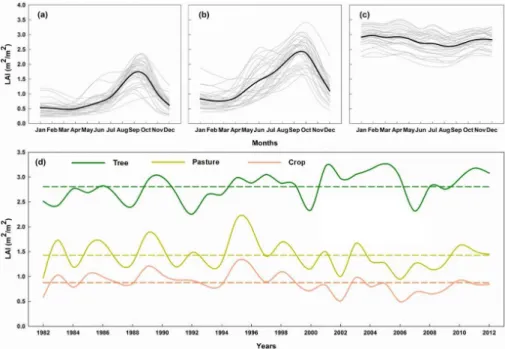
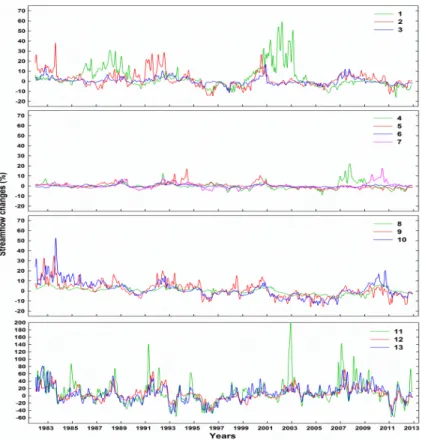
The seasonal and year to year variability of the areal average LAI of the three dominant vegetation types in the study catchment is shown in Fig. 2. Crop (Fig. 2a) and pasture (Fig. 2b) show much higher LAI seasonality than tree (Fig. 2c), which 5
is predominantly an evergreen genus. The minimum LAI for crop and pasture areas occurs during summer when trees reach their maximum LAI. The deviation of the observed monthly LAI from the long-term mean monthly LAI is observed to be significant in all the three vegetation types (Fig. 2d). The annual LAI time series show declines in annual LAI of crop and pasture and to a lesser extent trees during the 10
recent prolonged drought (1997–2009) in the study area. Climatic and land cover type characteristics for the 13 sub-catchments used in this study are presented in Table 1. There is no irrigation in all these study sub-catchments.
3 Dataset and methods
3.1 The VIC model
15
VIC macroscale model is a distributed conceptual based hydrological model that balances both water and energy budgets over a grid cell. It simulates soil moisture, evapotranspiration, snow pack, streamflow, base flow and other hydrologic properties at daily or sub-daily time steps by solving both the governing water and energy balance equations (Liang et al., 1996). VIC independently simulates all processes in each grid 20
cell, which are equally spaced. The infiltration and streamflow are estimated using the variable infiltration capacity model curve, which uses the soil moisture content of the upper two soil layers to approximate the spatial variability of surface saturation. Overall, this allows the model to represent the spatial variability in climate, vegetation and physical properties of soil (Cherkauer et al., 2003; Bowling et al., 2004; Bowling and 25
HESSD
11, 10515–10552, 2014Effect of year-to-year variability of leaf area index on VIC model
performance
Z. K. Tesemma et al.
Title Page
Abstract Introduction
Conclusions References
Tables Figures
◭ ◮
◭ ◮
Back Close
Full Screen / Esc
Printer-friendly Version Interactive Discussion
Discussion
P
a
per
|
Discus
sion
P
a
per
|
Discussion
P
a
per
|
Discussion
P
a
per
river basin scale (Sheffield and Wood, 2007; Nussen et al., 2001; Maurer et al., 2002). In Australia, Sivapalan and Woods (1995) used the VIC model to assess the effects of spatial variability of rainfall on soil moisture and Kalma et al. (1995) applied field measurement of soil moisture into two layers in a VIC model to estimate catchment moisture. Similarly, Western et al. (1999) assessed VIC simulated soil moisture in 5
a small catchment in southern Victoria, Australia and reported the time-series of spatially averaged internal total moisture storage was consistent with observations despite different assumptions in the statistical distribution of soil moisture storage used by VIC and their observed soil moisture dataset. After Liang et al. (1996) modified the VIC model for three layers and spatially varied vegetation, Zhao et al. (2012) 10
assessed the model for prediction of streamflow in a catchment located in south-eastern Australia. The advantage of the VIC model over a simple conceptual rainfall – runoffmodel is that it uses a “mosaic” scheme that allows spatial representation of gridded topography, infiltration rate, soil properties, climate variables and land cover which are important attributes in modelling streamflow under spatially heterogeneous 15
conditions.
3.2 Dataset
The input data used for the hydrological modelling include the daily precipitation, maximum and minimum temperature, vapour pressure and solar exposure data. They were obtained from the Australian Water Availability Project (AWAP) of the Bureau of 20
Meteorology (Jones et al., 2009). The gridded daily wind run data were obtained from (McVicar et al., 2008) that was generated from point measurements. All data have a spatial resolution of 0.05◦
×0.05◦(approximately 5 km×5 km), and the period 1982–
2012 was selected for this study based on the availability of LAI data. The elevation data were collected from the GEODATA 9 Second Digital Elevation Model (DEM-9S) 25
Version 3 (Geoscience Australia, 2008) with a spatial spacing of 9 s (approximately 250 m). The elevation data were resampled to a resolution of 0.05◦
×0.05◦ using the
HESSD
11, 10515–10552, 2014Effect of year-to-year variability of leaf area index on VIC model
performance
Z. K. Tesemma et al.
Title Page
Abstract Introduction
Conclusions References
Tables Figures
◭ ◮
◭ ◮
Back Close
Full Screen / Esc
Printer-friendly Version Interactive Discussion
Discussion
P
a
per
|
Discus
sion
P
a
per
|
Discussion
P
a
per
|
Discussion
P
a
per
|
catchments were obtained from the Victorian water resources warehouse (http://data. water.vic.gov.au/monitoring.htm).
The land cover input data were derived from the National Dynamic Land Cover Dataset which provides a land cover map for the whole of Australia at a resolution of 0.00235◦
×0.00235◦ (approximately 250 m×250 m) and can be accessed at (http:
5
//www.ga.gov.au/metadata-gateway/metadata/record/gcat_71071). The dataset was developed using the MODIS satellite and validated using a field-generated land cover map (Lymburner et al., 2011). For this study the land cover class was regrouped into three dominant classes: trees or forest, grass or pasture and crop, in each AWAP grid cell to be spatially consistent with the other input data. Then the fraction of each 10
land cover type inside each VIC model grid cell was computed and provided as an input to the VIC model. LAI data were collected from the Global Land Surface Satellite (GLASS) product which is available for download from the Normal University of Beijing (http://www.bnu-datacenter.com). The dataset was derived by combining the MODIS and the Advanced Very High Resolution Radiometer (AVHRR) satellite products at 15
0.05◦ resolution for the globe (Liang et al., 2013). The dataset has been compared with other remotely-sensed LAI products and found to be in good agreement (Fang et al., 2013). The root distribution in three soil layers was derived from the global ecosystem root distribution dataset (Schenk and Jackson, 2002). The soil parameters in the VIC model running resolution were derived from the five minute resolution Food 20
and Agriculture Organization dataset (FAO, 1995). The first soil layer was set to 10 mm and the other two layer depths were calibrated. The empirical Arno curve was used to generate the base flow based on the soil moisture content in the bottom layer (Cherkauer et al., 2003). The total streamflow at each grid cell was routed through a defined river network that was generated from the digital elevation model using the 25
HESSD
11, 10515–10552, 2014Effect of year-to-year variability of leaf area index on VIC model
performance
Z. K. Tesemma et al.
Title Page
Abstract Introduction
Conclusions References
Tables Figures
◭ ◮
◭ ◮
Back Close
Full Screen / Esc
Printer-friendly Version Interactive Discussion
Discussion
P
a
per
|
Discus
sion
P
a
per
|
Discussion
P
a
per
|
Discussion
P
a
per
3.3 Model calibration and validation
After all the necessary input data for the model were collected and prepared, the VIC (version VIC 4.1.2g) model was calibrated on selected unregulated catchments in the Goulburn–Broken catchment (Fig. 1). The seven most sensitive model parameters (b, Ds, Ws, Dsmax, d2, d3 and exp) in the VIC model (Demaria et al., 2007) were calibrated 5
for each catchment separately but were considered uniform within a catchment. The physical meaning and possible ranges of values of these parameters are listed in Table 2. These parameters ranges were used as a boundary to guide the calibration algorithm.
This study employed the Multi-Objective Complex Evolution (MOCOM-UA) algorithm 10
(Yapo et al., 1998), which uses a multi-objective, rather than a single objective, function and is an advancement over the Shuffled Complex Evolution Metropolis (SCEM-UA) global optimization algorithm (Vrugt et al., 2003). The MOCOM-UA algorithm searches for optimal parameter values by minimizing, or maximizing, the objective function specified by the user. The user sets the initial population size and the 15
number of samples to be taken from that initial population to evolve towards a set of solutions stemming from a stable distribution Pareto set based on the concept of pareto dominance (Yapo et al., 1998). The MOCOM-UA algorithm was implemented on each of the selected catchments separately to calibrate the model against the observed streamflow. The model was first calibrated for the entire period (1982–2012), then using 20
the calibrated parameters as initial guesses, the model was re-calibrated for the period 1982–1997 and validated for the period 1998–2012. During the calibration, VIC ran on a daily basis but the objective function was calculated on a monthly basis. Three criteria (objective function) were used to evaluate the model’s performance during calibration: the Nash–Sutcliffe efficiency (NSE) (Nash and Sutcliffe, 1970) between observed and 25
HESSD
11, 10515–10552, 2014Effect of year-to-year variability of leaf area index on VIC model
performance
Z. K. Tesemma et al.
Title Page Abstract Introduction Conclusions References Tables Figures ◭ ◮ ◭ ◮ Back Close
Full Screen / Esc
Printer-friendly Version Interactive Discussion Discussion P a per | Discus sion P a per | Discussion P a per | Discussion P a per |
observed mean flow Eq. (3).
NSE =100· 1− n P i=1
Qobsi −Qsimi 2
n P i=1
Qobsi −Qmean 2 (1)
log NSE =100· 1− n P i=1
logQobsi −log
Qsimi 2
n P i=1
logQobsi −log (Qmean) 2 (2) PBIAS = 100· n P i=1
Qsimi −Qobsi
n P
i=1
Qiobs
(3) 5
WhereQobsi is theith observed flow,Qsimi is the respectiveith simulated flow from the model,Qmeani is the mean of the observed flow for the calibration period andnis the total number of observed flows. Here the MOCOM-UA algorithm was set to maximize the NSE and logNSE and minimize the PBIAS in search for the optimal parameter set.
3.4 Effect of observed monthly LAI on model performance
10
To assess the effects of using observed monthly LAI (hereafter LAI) compared with long-term mean monthly LAI (hereafter LAImean) on VIC model performance
a systematic test was performed in validation mode for the data from 1998 to 2012 at each of the sub-catchments. Model calibration was undertaken twice, once using LAI and once using LAImean for the period 1982–1997. Each set of calibrated parameters
15
HESSD
11, 10515–10552, 2014Effect of year-to-year variability of leaf area index on VIC model
performance
Z. K. Tesemma et al.
Title Page
Abstract Introduction
Conclusions References
Tables Figures
◭ ◮
◭ ◮
Back Close
Full Screen / Esc
Printer-friendly Version Interactive Discussion
Discussion
P
a
per
|
Discus
sion
P
a
per
|
Discussion
P
a
per
|
Discussion
P
a
per
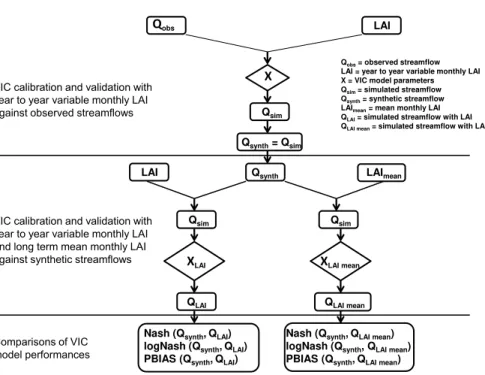
the matching LAI (LAI or LAImean) data. Model performance criteria were calculated from observed and simulated streamflows for each run and catchment separately and compared to assess differences in model performance. In order to minimise the impact on our results of errors in model structure and input data we adopt a synthetic data methodology similar to Oudin et al. (2005), where they assessed the effect of using 5
mean monthly or observed monthly potential evapotranspiration on model performance (Fig. 3). Simulated streamflow from the calibrated VIC model fed with observed monthly LAI was used as “synthetic” data to calibrate VIC twice, once using LAI and once using LAImean input data. For the case where we calibrate using LAI the model performance
criteria are expected to approach 100 % as the model is capable of reproducing the 10
synthetic streamflows. However, for the case where we calibrate with LAImean the model performance is expected to be reduced and the degree of performance reduction reflects the impact of using LAImeanto calibrate and run the model rather than LAI.
3.5 Effect of LAI on streamflow simulation
To investigate the effect of using the two LAI inputs on simulated monthly streamflow 15
over time, two modelling experiments were conducted using the VIC model calibrated with LAI on the study catchments. In the first experiment VIC was fed with LAI and then fed with LAImeanto produce monthly streamflow from each of the respective LAI inputs. The percentage change in streamflow (PCS), the monthly leaf area index elasticity of streamflow (εi) and the root mean square of monthly leaf area index elasticity of
20
streamflow (εrms) were calculated between the two simulated streamflow series on
a monthly basis as follows:
PCS =
100·
QLAIi −QLAIi mean
QLAImean
i
HESSD
11, 10515–10552, 2014Effect of year-to-year variability of leaf area index on VIC model
performance
Z. K. Tesemma et al.
Title Page
Abstract Introduction
Conclusions References
Tables Figures
◭ ◮
◭ ◮
Back Close
Full Screen / Esc
Printer-friendly Version Interactive Discussion
Discussion
P
a
per
|
Discus
sion
P
a
per
|
Discussion
P
a
per
|
Discussion
P
a
per
|
εi(LAI,Q)=
QLAIi −QLAIi mean
QLAImean
i
(LAIi−LAImean)/LAIi
(5)
εrms=
v u u u t
n P i=1
(εi(LAI,Q))2
n (6)
WhereQLAI is the simulated streamflow from VIC using LAI,QLAImean is the simulated streamflow from VIC using LAImean,i is the month andnis the number of all months. 5
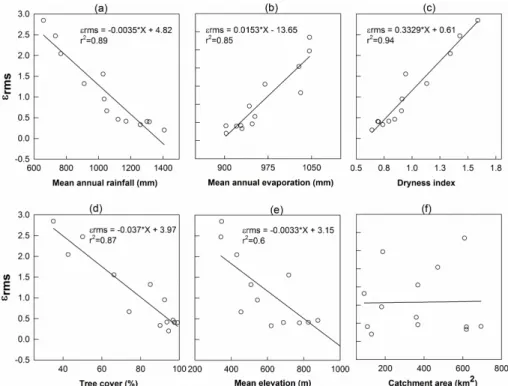
The root mean square the leaf area index elasticity of streamflow was then plotted in a series of scatter plots against the various catchment characteristics: mean annual rainfall, mean potential evapotranspiration, dryness index, percentage of tree cover, mean elevation, and catchment area.
A sensitivity analysis was also conducted using a variety of levels of LAI. This was 10
done by calculating the sensitivity of the hydrologic response of selected catchments for different levels of mean annual LAI from the observed base line period (1981–2012) while all other inputs were kept constant. Catchments with low, medium or high mean annual rainfall for either highly forested or sparsely forested land cover were selected. Then the difference in mean annual runoffresponse to changes in mean annual LAI 15
input was assessed and compared.
4 Results
4.1 Model calibration results
VIC was calibrated for thirteen sub-catchments with different climate and land cover composition that are representative of the main runoff producing regions of the 20
HESSD
11, 10515–10552, 2014Effect of year-to-year variability of leaf area index on VIC model
performance
Z. K. Tesemma et al.
Title Page
Abstract Introduction
Conclusions References
Tables Figures
◭ ◮
◭ ◮
Back Close
Full Screen / Esc
Printer-friendly Version Interactive Discussion
Discussion
P
a
per
|
Discus
sion
P
a
per
|
Discussion
P
a
per
|
Discussion
P
a
per
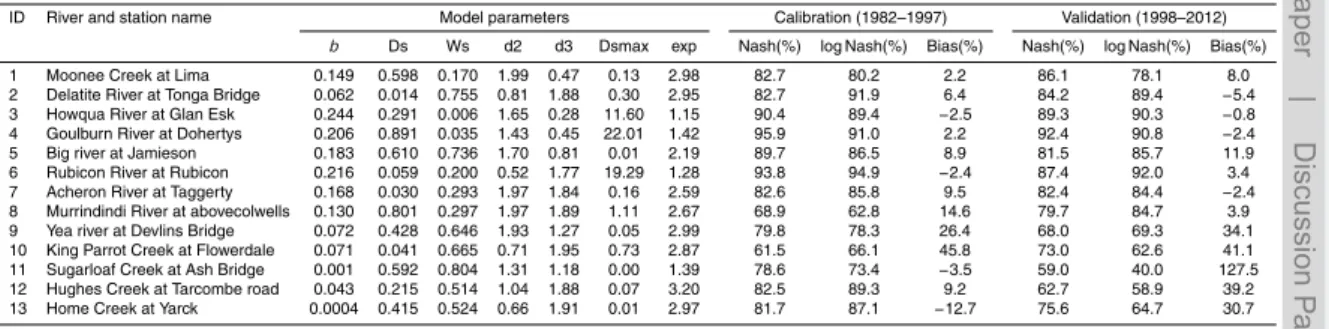
listed for each catchment together with the three model performance criteria during both the calibration (1982–1997) and validation (1998–2012) periods. Most of the calibrated catchments have NSE of more than 70 % during both calibration and validation periods.
In almost all of the catchments the simulated streamflow for both calibration and 5
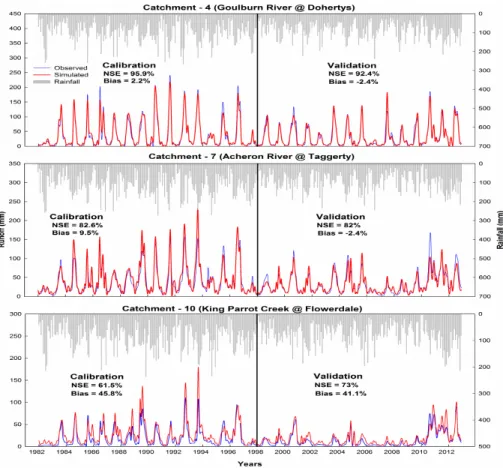
validation periods met the “satisfactory” criteria according to (Moriasi et al., 2007), with NSE>50 % and the percentage absolute bias is generally less than 25 % during calibration and validation periods. The few catchments that did not meet this criterion showed high biases in both calibration and validation. The temporal variability of streamflow was well captured by the model in all calibrated catchments. The simulated 10
and observed streamflow for the three catchments where VIC performed best, average and the worst are shown in Fig. 4. Although VIC captured the temporal variability of streamflow well, there were some systematic biases in the streamflow simulated. The model overestimates peak flow in a few cases and underestimates low flow in most of the catchments. The sources of these biases need to be investigated in order to 15
understand the performance of the model. To do this, the estimated monthly biases are plotted against the monthly climate inputs: precipitation, temperature and leaf area index (not shown here). The calibrated catchments showed no relationship between AWAP gridded climate data and simulated streamflow biases. The biases are likely related to the model structure (Kalma et al., 1995) rather than model inputs.
20
The spatial distribution of the calibrated parameters varies from catchment to catchment mainly due to large differences in annual precipitation. Catchments with high annual precipitation (see Table 1) have higher values for the infiltration curve shape parameter (b), which indicates catchments with lower infiltration and higher event runoff (see Table 1). This parameter varies from 0.0004 for catchment 13 to 25
HESSD
11, 10515–10552, 2014Effect of year-to-year variability of leaf area index on VIC model
performance
Z. K. Tesemma et al.
Title Page
Abstract Introduction
Conclusions References
Tables Figures
◭ ◮
◭ ◮
Back Close
Full Screen / Esc
Printer-friendly Version Interactive Discussion
Discussion
P
a
per
|
Discus
sion
P
a
per
|
Discussion
P
a
per
|
Discussion
P
a
per
|
value derived from the FAO soil map dataset. The smaller the value of the parameter (exp) the catchment has, the larger the drainage between the layers, for the same soil moisture, which then produces larger baseflow. The amount of moisture stored in the soil depends on the thickness of the second soil layer. The thickness of the second layer (d2) influences the plant transpiration which contributes the largest component 5
of evapotranspiration. d2 varied from 0.52 m (in catchment 6) to 1.99 m (in catchment 1). The third layer depth (d3), which is not accessible to the plants, determines the baseflow and varies from 0.28 in (catchment 3) to 1.95 (in catchment 10). A weak inverse correlation was found between the thickness of the second layer and the third layer which might be due to a parameter identifiability issue.
10
4.2 Effect of LAI on VIC model performance
In Sect. 4.2.1 we first investigate the sensitivity of the validation performance of VIC streamflow predictions to the LAI input data. In Sect. 4.2.2 we investigate the ability of VIC to reproduce the synthetic streamflow produced by the model calibrated with LAI when VIC is re-calibrated using synthetic streamflow and the two forms of the LAI data. 15
In Sect. 4.2.3 we investigate the influences on the sensitivity to LAI variability.
4.3 Comparing model performance using LAI and LAImean
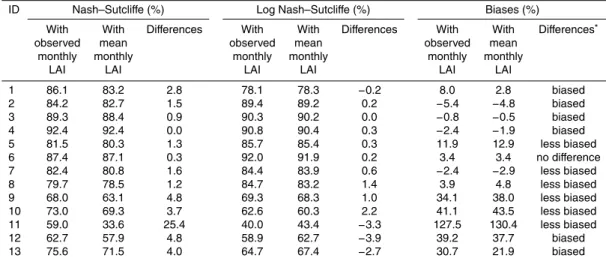
The three assessment criteria (Nash–Sutcliffe, logarithm Nash–Sutcliffe and percentage bias) are shown in Table 4 and were calculated using observed and simulated streamflow in validation mode with inputs of LAI and LAImean. The three
20
criteria have slightly different behaviours since the Nash–Sutcliffe is more influenced by peak flows, the logarithm Nash–Sutcliffe gives more emphasis to low flows, while the percentage bias provides the tendency of the model to overestimation or underestimation. In terms of Nash–Sutcliffe efficiency the results show that calibrating VIC using LAI yields better or equivalent model performance than calibrating the 25
HESSD
11, 10515–10552, 2014Effect of year-to-year variability of leaf area index on VIC model
performance
Z. K. Tesemma et al.
Title Page
Abstract Introduction
Conclusions References
Tables Figures
◭ ◮
◭ ◮
Back Close
Full Screen / Esc
Printer-friendly Version Interactive Discussion
Discussion
P
a
per
|
Discus
sion
P
a
per
|
Discussion
P
a
per
|
Discussion
P
a
per
efficiency was found to be 25 % in catchment 11, which is covered predominantly by pasture, while no improvement was found in catchment 4, which is dominated by trees. In addition, some of the catchments also show some improvement in the other two model efficiency criteria when LAI is used (Table 4). In interpreting these results it is important to recall that maximising Nash–Sutcliffe efficiency was the consistent 5
calibration objective. The other two objectives (logarithm of Nash–Sutcliffe efficiency and percentage bias) were used when no difference in the Nash–Sutcliffe efficiency exist. The observed monthly LAI streamflow produced less bias prediction in most of the catchments, however highly forested catchments showed some bias.
4.4 Model performance against synthetic flows
10
To assess the validity of the results in Sect. 4.2.1 we consider a separate analysis where VIC is re-calibrated against synthetic streamflow data generated from the model calibrated with LAI, once with LAI and once with LAImean. The reason for doing this
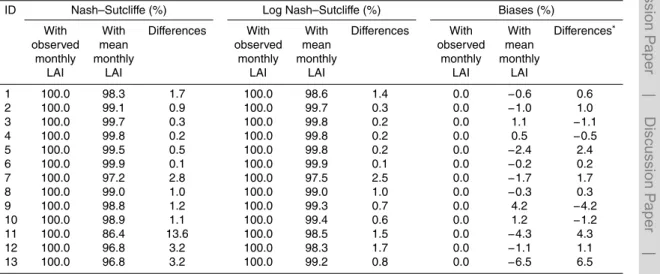
is that it eliminates model input uncertainty and model structural uncertainty from the comparisons. The degradation in model performance when LAImean is used instead
15
of LAI is shown in Table 5. Catchments located in the high annual precipitation zone covered dominantly with trees showed less than 3 % degradation in NSE model performance using LAImean. In contrast, catchments 11–13 (Tables 1 and 5) where the dominant land cover is pasture, showed more than 3 % degradation in NSE model performance. The other performance criteria (logNSE and PBIAS) showed little change 20
when the model was fed with either form of LAI data, which indicates that the low flows and runoffratio are insensitive to the year to year changes in monthly LAI.
4.5 Influences on the sensitivity to LAI variability
The spatial pattern of LAI sensitivity is found to be related to the spatial patterns of rainfall and the distribution of land cover type. The percentage change in monthly 25
HESSD
11, 10515–10552, 2014Effect of year-to-year variability of leaf area index on VIC model
performance
Z. K. Tesemma et al.
Title Page
Abstract Introduction
Conclusions References
Tables Figures
◭ ◮
◭ ◮
Back Close
Full Screen / Esc
Printer-friendly Version Interactive Discussion
Discussion
P
a
per
|
Discus
sion
P
a
per
|
Discussion
P
a
per
|
Discussion
P
a
per
|
the “Millennium Drought” (1997–2009 in the Goulburn–Broken), monthly streamflow from VIC forced with LAImean underestimates streamflow from VIC forced with LAI and
overestimates streamflow during wet periods such as 1990, 1994, 1996 and 2011, as shown in Fig. 5. The spatial distribution of these percentage changes in monthly streamflow varied between the catchments. Among the calibrated catchments, use 5
of LAImean compared with LAI overestimated flows by up to 60 % during wet periods
and underestimated flow by up to 200 % during dry periods. When pasture dominated catchments are compared with tree dominated catchments, the later showed the smallest deviations in simulated monthly streamflow whether LAI or LAImean were
used. The leaf area index elasticity of streamflow is highly correlated related to the 10
dryness index (R2=0.94), mean annual rainfall (R2=0.89), percentage of forest cover (R2=0.87) and mean annual potential evapotranspiration (R2=0.85) (Fig. 6a–d). Mean catchment elevation also influence the elasticity of streamflow to leaf area index (Fig. 6e), although these two variables are highly cross-correlated with mean annual precipitation (R2=0.7). However the size of the catchment has found not to have an 15
influence on the leaf area index elasticity of streamflow.
Figure 7 shows the sensitivity of simulated mean annual runoffto changes in mean annual LAI for catchments with a high proportion of area covered by trees (Fig. 7a) and a low proportion of area covered by trees (Fig. 7b) for low, medium and high mean annual rainfall. Comparing Fig. 7a and b shows that there is a significant difference 20
in the sensitivity of mean annual runoff to mean annual LAI between highly forested and sparsely forested catchments. Highly forested catchments (1, 4 and 6) exhibited lower sensitivity than sparsely forested catchments (11–13) for small difference in their mean annual rainfalls. Both land cover groups showed some increase in sensitivity to LAI at lower LAI values. A spatial difference in simulated mean annual runoff in 25
HESSD
11, 10515–10552, 2014Effect of year-to-year variability of leaf area index on VIC model
performance
Z. K. Tesemma et al.
Title Page
Abstract Introduction
Conclusions References
Tables Figures
◭ ◮
◭ ◮
Back Close
Full Screen / Esc
Printer-friendly Version Interactive Discussion
Discussion
P
a
per
|
Discus
sion
P
a
per
|
Discussion
P
a
per
|
Discussion
P
a
per
5 Discussion
The performance of the VIC model was found to be good for the vast majority of catchments in terms of Nash–Sutcliffe efficiency of flows and log flows (Table 3). In a few cases, bias in simulated streamflow was significant which appears to be due to the model structure rather than the model inputs. Some catchments only respond to 5
precipitation events after the catchment becomes sufficiently wet and saturated areas develop (Kalma et al., 1995) and connect to the stream network (Western et al., 1999, 2001). The former can be addressed by modification of the relationship between soil moisture and runoff with addition of one parameter as suggested by (Kalma et al., 1995); however, the issue of connectivity is related to dynamic changes in moisture 10
patterns, which implies that the soil moisture–runoff relationship changes over time and this would be harder to incorporate into VIC (Western et al., 1999).
Previous studies have reported that rainfall-runoff models calibrated using a long period of record and tested for sub-periods with above long-term average rainfall perform well, but the performance of the rainfall-runoff model starts to deteriorate 15
when tested for sub-periods with below long-term average rainfall in the same region of this study (Vaze et al., 2010). This observation was not consistently evident for VIC in this study. In fact some catchments (4 of 13) showed better performance in term of NSE when model parameters calibrated for a wet period (1982–1997) were used in the predominantly dry validation period (1998–2012) (see Table 4). 20
This might be due to using the observed monthly LAI, rather than long-term mean monthly LAI. It is clear that smaller LAI during dry periods were due to drier moisture conditions that decreased actual evapotranspiration, and increased LAI during wet conditions might increase actual evapotranspiration. Using long-term mean monthly LAI tends to underestimate streamflow during predominantly dry periods (1998–2012) 25
HESSD
11, 10515–10552, 2014Effect of year-to-year variability of leaf area index on VIC model
performance
Z. K. Tesemma et al.
Title Page
Abstract Introduction
Conclusions References
Tables Figures
◭ ◮
◭ ◮
Back Close
Full Screen / Esc
Printer-friendly Version Interactive Discussion
Discussion
P
a
per
|
Discus
sion
P
a
per
|
Discussion
P
a
per
|
Discussion
P
a
per
|
conceptual hydrological models such as VIC. Previous findings (Coron et al., 2012; Merz et al., 2011; Vaze et al., 2010) obtained with different catchment sets and models, emphasised the lack of robustness of conceptual rainfall-runoffmodels when calibrated during wet periods and validated in dry periods. In most rainfall-runoff models the inability to vary LAI of the vegetation might be the cause of reduced model performance 5
during drought due to change in LAI given that using observed monthly LAI was shown to improve model performance in some catchments. In support of this, (Zhang et al., 2009) showed an improvement in model performance when a rainfall-runoffmodel was coupled with actual evapotranspiration estimates from Penman–Monteith equation and remotely sensed MODIS LAI.
10
Based on Nash–Sutcliffe efficiency the VIC hydrological models tested here revealed better performance when driven with observed monthly LAI than mean monthly LAI. Catchments located in high annual precipitation zones that are covered predominantly with trees showed less than 3 % degradation in model performance since those areas are more likely to be energy limited (Fig. 7c). In this case the actual evapotranspiration 15
is triggered by energy availability rather than the leaf area index. Catchments numbered 11–13, where the dominant land cover type is pasture, showed more than 3 % degradation in NSE model performance criterion, which might be related to mean monthly LAI not representing year to year variability in LAI due to fluctuations in phenological cycles or timing of planting or harvesting. The degradation in model 20
efficiency from using mean monthly LAI impacts soil moisture simulation in the VIC model as shown by Ford and Quiring (2013).
A sensitivity analysis was conducted by changing mean annual LAI. The results indicated that decreasing mean monthly LAI has more effect than increasing mean annual LAI consistently across all calibrated catchments. The differences in the rate 25
HESSD
11, 10515–10552, 2014Effect of year-to-year variability of leaf area index on VIC model
performance
Z. K. Tesemma et al.
Title Page
Abstract Introduction
Conclusions References
Tables Figures
◭ ◮
◭ ◮
Back Close
Full Screen / Esc
Printer-friendly Version Interactive Discussion
Discussion
P
a
per
|
Discus
sion
P
a
per
|
Discussion
P
a
per
|
Discussion
P
a
per
related by LAI, which increases surface runoff. This effect of LAI is very important to model especially during prolonged drought when rainfall is low and unrealistic LAI input can result in unrealistic soil moisture status, with consequent impacts on runoff. The sensitivity of the model to mean annual LAI was found to depend on the climatic conditions and vegetation type of the catchment. The lower the mean annual rainfall the 5
catchment received, the higher the sensitivity of the mean annual streamflow to change in the mean annual LAI and vice versa. And also for a given mean annual rainfall, the lower the proportion of trees to pasture the higher the sensitivity of streamflow to change in the mean annual LAI and vice versa. Thus the effect of land cover change on mean annual runoffvaries across catchments with similar mean annual rainfall. 10
6 Summary and conclusion
The variable infiltration capacity (VIC) model was calibrated for thirteen gauged catchments located in the Goulburn–Broken catchment, south-eastern Australia. Two sets of experiments were conducted to assess the effect of the observed monthly LAI on the VIC model performance and the simulated monthly streamflow. In addition the 15
impact of catchment characteristics including vegetation cover type and mean rainfall on the sensitivity of catchment streamflow to changes in LAI was assessed. The most notable findings are:
1. The VIC model simulated streamflow reasonably well with high Nash–Sutcliffe model efficiency in the Goulburn–Broken catchment with proper calibration of the 20
seven sensitive parameters.
2. Improvement in Nash–Sutcliffe model efficiency of between 4 and 25 % was obtained in catchments predominantly covered in pasture through applying observed monthly LAI rather than monthly mean LAI in the VIC model. Catchments predominantly covered in trees showed limited improvement from 25
HESSD
11, 10515–10552, 2014Effect of year-to-year variability of leaf area index on VIC model
performance
Z. K. Tesemma et al.
Title Page
Abstract Introduction
Conclusions References
Tables Figures
◭ ◮
◭ ◮
Back Close
Full Screen / Esc
Printer-friendly Version Interactive Discussion
Discussion
P
a
per
|
Discus
sion
P
a
per
|
Discussion
P
a
per
|
Discussion
P
a
per
|
3. Applying the long term mean monthly LAI overestimated monthly streamflow by up to 60 % during wet periods and underestimated monthly streamflow by up to 200 % during dry period when compared with the streamflow simulated using the year to year variable monthly LAI.
4. The difference in spatial patterns of the effect of observed monthly LAI over the 5
mean monthly LAI is most strongly related to differences in vegetation type but is also influenced by mean annual rainfall differences.
Making accurate streamflow predictions using hydrological models under changing or “non-stationary” conditions is a challenge in hydrology. It seems difficult to provide general guidelines for which model should be used for which purpose but our 10
results do indicate the importance of accounting for potential vegetation changes in climate change impact studies. That is models that consider both first order forcing, precipitation and potential evaporation drivers and the second order forcing of vegetation, could provide better predictions than models that only consider the first order forcing for projecting streamflow with projected climate inputs. This implies a need 15
to predict vegetation changes in response to climate change in studies which assess the impact of future climate change on streamflow.
Acknowledgements. This work was funded by the Australian Research Council (ARC) (Project
Nos: ARC LP100100546 and ARC FT120100130), the Natural Science Foundation of China (Project No: 91125007) and the Commonwealth of Australia under the Australia China Science
20
and Research Fund (Project No: ACSRF800). We would like to thank the University of Melbourne for providing a scholarship to the first author.
References
Bowling, L. C. and Lettenmaier, D. P.: Modeling the effects of lakes and wetlands on the water balance of Arctic environments, J. Hydrometeorol., 11, 276–295,
25
HESSD
11, 10515–10552, 2014Effect of year-to-year variability of leaf area index on VIC model
performance
Z. K. Tesemma et al.
Title Page
Abstract Introduction
Conclusions References
Tables Figures
◭ ◮
◭ ◮
Back Close
Full Screen / Esc
Printer-friendly Version Interactive Discussion
Discussion
P
a
per
|
Discus
sion
P
a
per
|
Discussion
P
a
per
|
Discussion
P
a
per
Bowling, L. C., Pomeroy, J. W., and Lettenmaier, D. P.: Parameterization of blowing-snow sublimation in a macroscale hydrology model, J. Hydrometeorol., 5, 745–762, doi:10.1175/1525-7541(2004)005<0745:pobsia>2.0.co;2, 2004.
Cherkauer, K. A., Bowling, L. C., and Lettenmaier, D. P.: Variable infiltration capacity cold land process model updates, Global Planet. Change, 38, 151–159,
doi:10.1016/s0921-5
8181(03)00025-0, 2003.
Chiew, F. H. S., Potter, N. J., Vaze, J., Petheram, C., Zhang, L., Teng, J., and Post, D. A.: Observed hydrologic non-stationarity in far south-eastern Australia: implications for modelling and prediction, Stoch. Env. Res. Risk A., 28, 3–15, doi:10.1007/s00477-013-0755-5, 2014. Coron, L., Andreassian, V., Perrin, C., Lerat, J., Vaze, J., Bourqui, M., and Hendrickx, F.: Crash
10
testing hydrological models in contrasted climate conditions: an experiment on 216 Australian catchments, Water Resour. Res., 48, W05552, doi:10.1029/2011wr011721, 2012.
Deardorff, J. W.: Efficient prediction of ground surface temperature and moisture, with inclusion of a layer of vegetation, J. Geophys. Res.-Oceans, 83, 1889–1903, doi:10.1029/JC083iC04p01889, 1978.
15
Demaria, E. M., Nijssen, B., and Wagener, T.: Monte Carlo sensitivity analysis of land surface parameters using the Variable Infiltration Capacity model, J. Geophys. Res.-Atmos., 112, D11113, doi:10.1029/2006JD007534, 2007.
de Vos, N. J., Rientjes, T. H. M., and Gupta, H. V.: Diagnostic evaluation of conceptual rainfall–runoff models using temporal clustering, Hydrol. Process., 24, 2840–2850,
20
doi:10.1002/hyp.7698, 2010.
Dickinson, R. E.: Modeling evapotranspiration for three-dimensional global climate models, in: Climate Processes and Climate Sensitivity, Geophys. Monogr. Ser., AGU, Washington, DC, 58–72, 1984.
Fang, H., Jiang, C., Li, W., Wei, S., Baret, F., Chen, J. M., Garcia-Haro, J., Liang, S., Liu, R.,
25
Myneni, R. B., Pinty, B., Xiao, Z., and Zhu, Z.: Characterization and intercomparison of global moderate resolution leaf area index (LAI) products: analysis of climatologies and theoretical uncertainties, J. Geophys. Res.-Biogeosci., 118, 529–548, doi:10.1002/jgrg.20051, 2013. Food and Agriculture Organization of the United Nations (FAO): Digital Soil Map of the World,
Version 3.5. FAO, Rome, Italy, 1995.
30
HESSD
11, 10515–10552, 2014Effect of year-to-year variability of leaf area index on VIC model
performance
Z. K. Tesemma et al.
Title Page
Abstract Introduction
Conclusions References
Tables Figures
◭ ◮
◭ ◮
Back Close
Full Screen / Esc
Printer-friendly Version Interactive Discussion
Discussion
P
a
per
|
Discus
sion
P
a
per
|
Discussion
P
a
per
|
Discussion
P
a
per
|
Geoscience Australia: GEODATA 9 Second Digital Elevation Model (DEM-9S) Version 3, available at: http://www.ga.gov.au/metadata-gateway/metadata/record/gcat_66006 (last access: 20 December 2013), 2008.
Granier, A., Loustau, D., and Bréda, N.: A generic model of forest canopy conductance dependent on climate, soil water availability and leaf area index, Ann. For. Sci., 57, 755–
5
765, 2000.
Jones, D. A., Wang, W., and Fawcett, R.: High-quality spatial climate data-sets for Australia, Australian Meteorological and Oceanographic Journal, 58, 233–248, 2009.
Kalma, J. D., Bates, B. C., and Woods, R. A.: Predicting catchment-scale soil moisture status with limited field measurements, Hydrol. Process., 9, 445–467,
10
doi:10.1002/hyp.3360090315, 1995.
Liang, S., Zhao, X., Liu, S., Yuan, W., Cheng, X., Xiao, Z., Zhang, X., Liu, Q., Cheng, J., Tang, H., Qu, Y., Bo, Y., Qu, Y., Ren, H., Yu, K., and Townshend, J.: A long-term Global LAnd Surface Satellite (GLASS) data-set for environmental studies, International Journal of Digital Earth, 6, 5–33, doi:10.1080/17538947.2013.805262, 2013.
15
Liang, X., Wood, E. F., and Lettenmaier, D. P.: Surface soil moisture parameterization of the VIC-2L model: evaluation and modification, Global Planet. Change, 13, 195–206, doi:10.1016/0921-8181(95)00046-1, 1996.
Lohmann, D., Raschke, E., Nijssen, B., and Lettenmaier, D. P.: Regional scale hydrology: I. Formulation of the VIC-2L model coupled to a routing model, Hydrolog. Sci. J., 43, 131–
20
141, doi:10.1080/02626669809492107, 1998.
Lymburner, L., Tan, P., Mueller, N., Thackway, R., Lewis, A., Thankappan. M., Randall, L., Islam, A., and Senarath, U.: The Dynamic Land Cover Datset, GA Record 2011/31, 95 pp., Geoscience Australia, Canberra, 2011.
Maurer, E. P., Wood, A. W., Adam, J. C., Lettenmaier, D. P., and Nijssen, B.: A long-term
25
hydrologically based dataset of land surface fluxes and states for the conterminous United States, J. Climate, 15, 3237–3251, doi:10.1175/1520-0442(2002)015<3237:althbd>2.0.co;2, 2002.
McVicar, T. R., Van Niel, T. G., Li, L. T., Roderick, M. L., Rayner, D. P., Ricciardulli, L., and Donohue, R. J.: Wind speed climatology and trends for Australia, 1975–2006: capturing the
30
HESSD
11, 10515–10552, 2014Effect of year-to-year variability of leaf area index on VIC model
performance
Z. K. Tesemma et al.
Title Page
Abstract Introduction
Conclusions References
Tables Figures
◭ ◮
◭ ◮
Back Close
Full Screen / Esc
Printer-friendly Version Interactive Discussion
Discussion
P
a
per
|
Discus
sion
P
a
per
|
Discussion
P
a
per
|
Discussion
P
a
per
Merz, R., Parajka, J., and Blöschl, G.: Time stability of catchment model param-eters: implications for climate impact analyses, Water Resour. Res., 47, W02531, doi:10.1029/2010WR009505, 2011.
Milly, P. C. D., Betancourt, J., Falkenmark, M., Hirsch, R. M., Kundzewicz, Z. W., Lettenmaier, D. P., and Stouffer, R. J.: Stationarity is dead: whither water management?,
5
Science, 319, 573–574, doi:10.1126/science.1151915, 2008.
Moriasi, D. N., Arnold, J. G., Van Liew, M. W., Bingner, R. L., Harmel, R. D., and Veith, T. L.: Model evaluation guidelines for systematic quantification of accuracy in watershed simulations, T. ASABE, 50, 885–900, 2007.
Muzylo, A., Llorens, P., Valente, F., Keizer, J. J., Domingo, F., and Gash, J. H. C.: A review of
10
rainfall interception modelling, J. Hydrol., 370, 191–206, doi:10.1016/j.jhydrol.2009.02.058, 2009.
Nash, J. E. and Sutcliffe, J. V.: River flow forecasting through conceptual models part I – A discussion of principles, J. Hydrol., 10, 282–290, doi:10.1016/0022-1694(70)90255-6, 1970.
15
Nussen, B., Schnur, R., and Lettenmaier, D. P.: Global retrospective estimation of soil moisture using the variable infiltration capacity land surface model, 1980–93, J. Climate, 14, 1790– 1808, 2001.
Oudin, L., Hervieu, F., Michel, C., Perrin, C., Andréassian, V., Anctil, F., and Loumagne, C.: Which potential evapotranspiration input for a lumped rainfall–runoff model?: Part 2
20
– Towards a simple and efficient potential evapotranspiration model for rainfall–runoff
modelling, J. Hydrol., 303, 290–306, doi:10.1016/j.jhydrol.2004.08.026, 2005.
Peel, M. C.: Hydrology: catchment vegetation and runoff, Prog. Phys. Geog., 33, 837–844, doi:10.1177/0309133309350122, 2009.
Peel, M. C. and Blöschl, G.: Hydrological modelling in a changing world, Prog. Phys. Geog.,
25
35, 249–261, doi:10.1177/0309133311402550, 2011.
Peel, M. C., Finlayson, B. L., and McMahon, T. A.: Updated world map of the Köppen–Geiger climate classification, Hydrol. Earth Syst. Sci., 11, 1633–1644, doi:10.5194/hess-11-1633-2007, 2007.
Peel, M. C., McMahon, T. A., and Finlayson, B. L.: Vegetation impact on mean annual
30
HESSD
11, 10515–10552, 2014Effect of year-to-year variability of leaf area index on VIC model
performance
Z. K. Tesemma et al.
Title Page
Abstract Introduction
Conclusions References
Tables Figures
◭ ◮
◭ ◮
Back Close
Full Screen / Esc
Printer-friendly Version Interactive Discussion
Discussion
P
a
per
|
Discus
sion
P
a
per
|
Discussion
P
a
per
|
Discussion
P
a
per
|
Schenk, H.-J. and Jackson, R. B.: The global biogeography of roots, Ecological Monographs, 72, 311–328, 2002.
Sheffield, J. and Wood, E. F.: Characteristics of global and regional drought, 1950–2000: analysis of soil moisture data from off-line simulation of the terrestrial hydrologic cycle, J. Geophys. Res., 112, D17115, doi:10.1029/2006jd008288, 2007.
5
Singh, R., Wagener, T., van Werkhoven, K., Mann, M. E., and Crane, R.: A trading-space-for-time approach to probabilistic continuous streamflow predictions in a changing climate – accounting for changing watershed behavior, Hydrol. Earth Syst. Sci., 15, 3591–3603, doi:10.5194/hess-15-3591-2011, 2011.
Sivapalan, M. and Woods, R. A.: Evaluation of the effects of general circulation models’ subgrid
10
variability and patchiness of rainfall and soil moisture on land surface water balance fluxes, Hydrol. Process., 9, 697–717, doi:10.1002/hyp.3360090515, 1995.
Tang, Q., Vivoni, E. R., Muñoz-Arriola, F., and Lettenmaier, D. P.: Predictability of evapotranspiration patterns using remotely sensed vegetation dynamics during the North American Monsoon, J. Hydrometeorol., 13, 103–121, doi:10.1175/JHM-D-11-032.1, 2011.
15
Vaze, J., Post, D. A., Chiew, F. H. S., Perraud, J. M., Viney, N. R., and Teng, J.: Climate non-stationarity – validity of calibrated rainfall-runoff models for use in climate change studies, J. Hydrol., 394, 447–457, doi:10.1016/j.jhydrol.2010.09.018, 2010.
Vertessy, R. A., Watson, F. G. R., and O’Sullivan, S. K.: Factors determining relations between stand age and catchment water balance in mountain ash forests, Forest Ecol. Manag., 143,
20
13–26, doi:10.1016/S0378-1127(00)00501-6, 2001.
Vrugt, J. A., Gupta, H. V., Bastidas, L. A., Bouten, W., and Sorooshian, S.: Effective and efficient algorithm for multiobjective optimization of hydrologic models, Water Resour. Res., 39, 1214, doi:10.1029/2002wr001746, 2003.
Western, A. W., Grayson, R. B., and Green, T. R.: The Tarrawarra project: high resolution
25
spatial measurement, modelling and analysis of soil moisture and hydrological response, Hydrol. Process., 13, 633–652, doi:10.1002/(SICI)1099-1085(19990415)13:5<633::AID-HYP770>3.0.CO;2-8, 1999.
Western, A. W., Blöschl, G., and Grayson, R. B.: Toward capturing hydrologi-cally significant connectivity in spatial patterns, Water Resour. Res., 37, 83–97,
30
doi:10.1029/2000WR900241, 2001.
HESSD
11, 10515–10552, 2014Effect of year-to-year variability of leaf area index on VIC model
performance
Z. K. Tesemma et al.
Title Page
Abstract Introduction
Conclusions References
Tables Figures
◭ ◮
◭ ◮
Back Close
Full Screen / Esc
Printer-friendly Version Interactive Discussion
Discussion
P
a
per
|
Discus
sion
P
a
per
|
Discussion
P
a
per
|
Discussion
P
a
per
Zhang, Y., Chiew, F. H. S., Zhang, L., and Li, H.: Use of remotely sensed actual evapotranspiration to improve rainfall-runoff modeling in Southeast Australia, J. Hydrometeorol., 10, 969–980, doi:10.1175/2009jhm1061.1, 2009.
Zhao, F., Chiew, F. H. S., Zhang, L., Vaze, J., Perraud, J.-M., and Li, M.: Application of a macroscale hydrologic model to estimate streamflow across southeast Australia,
5
HESSD
11, 10515–10552, 2014Effect of year-to-year variability of leaf area index on VIC model
performance
Z. K. Tesemma et al.
Title Page
Abstract Introduction
Conclusions References
Tables Figures
◭ ◮
◭ ◮
Back Close
Full Screen / Esc
Printer-friendly Version Interactive Discussion
Discussion
P
a
per
|
Discus
sion
P
a
per
|
Discussion
P
a
per
|
Discussion
P
a
per
|
Table 1.Characteristics of selected sub-catchments for this study: mean annual precipitation (P), FAO56 reference evapotranspiration (PET), mean annual leaf area index (LAI) and the percentage of the three land cover type (crop, pasture and tree).
Catchment ID
P
(mm yr−1)
PET (mm yr−1)
LAI (m2m2)
Crop (%)
Pasture (%)
Tree (%)
HESSD
11, 10515–10552, 2014Effect of year-to-year variability of leaf area index on VIC model
performance
Z. K. Tesemma et al.
Title Page
Abstract Introduction
Conclusions References
Tables Figures
◭ ◮
◭ ◮
Back Close
Full Screen / Esc
Printer-friendly Version Interactive Discussion
Discussion
P
a
per
|
Discus
sion
P
a
per
|
Discussion
P
a
per
|
Discussion
P
a
per
Table 2.VIC model parameters that need calibration, their physical meaning and possible value range.
VIC parameter
Physical meaning of model parameter Possible range of parameter value
b Infiltration shape controlling surface runoff 0–0.5 Ds Fraction of DSmaxwhere non-linear (rapidly
increasing) baseflow begins
0–1
Ws Fraction of the maximum soil moisture (of the lowest soil layer) where non-linear base flow begins
0–1
d2 Thickness of the second soil layer 0–2 d3 Thickness of the third soil layer 0–2 Dsmax The maximum base flow that can occur from the
lowest soil layer
0–30
exp Exponent of the Brooks–Corey drainage equation factors
To be multiplied with FAO based generated exponent value
HESSD
11, 10515–10552, 2014Effect of year-to-year variability of leaf area index on VIC model
performance
Z. K. Tesemma et al.
Title Page
Abstract Introduction
Conclusions References
Tables Figures
◭ ◮
◭ ◮
Back Close
Full Screen / Esc
Printer-friendly Version Interactive Discussion
Discussion
P
a
per
|
Discus
sion
P
a
per
|
Discussion
P
a
per
|
Discussion
P
a
per
|
Table 3.Calibrated model parameters and model performance during calibration (1982–1997) and validation (1998–2012) periods.
ID River and station name Model parameters Calibration (1982–1997) Validation (1998–2012)
HESSD
11, 10515–10552, 2014Effect of year-to-year variability of leaf area index on VIC model
performance
Z. K. Tesemma et al.
Title Page
Abstract Introduction
Conclusions References
Tables Figures
◭ ◮
◭ ◮
Back Close
Full Screen / Esc
Printer-friendly Version Interactive Discussion
Discussion
P
a
per
|
Discus
sion
P
a
per
|
Discussion
P
a
per
|
Discussion
P
a
per
Table 4.Comparison of model performance from applying observed monthly LAI and mean monthly LAI in validation mode against observed streamflow.
ID Nash–Sutcliffe (%) Log Nash–Sutcliffe (%) Biases (%)
With With Differences With With Differences With With Differences∗
observed mean observed mean observed mean monthly monthly monthly monthly monthly monthly
LAI LAI LAI LAI LAI LAI
1 86.1 83.2 2.8 78.1 78.3 −0.2 8.0 2.8 biased 2 84.2 82.7 1.5 89.4 89.2 0.2 −5.4 −4.8 biased
3 89.3 88.4 0.9 90.3 90.2 0.0 −0.8 −0.5 biased
4 92.4 92.4 0.0 90.8 90.4 0.3 −2.4 −1.9 biased
5 81.5 80.3 1.3 85.7 85.4 0.3 11.9 12.9 less biased 6 87.4 87.1 0.3 92.0 91.9 0.2 3.4 3.4 no difference 7 82.4 80.8 1.6 84.4 83.9 0.6 −2.4 −2.9 less biased
8 79.7 78.5 1.2 84.7 83.2 1.4 3.9 4.8 less biased 9 68.0 63.1 4.8 69.3 68.3 1.0 34.1 38.0 less biased 10 73.0 69.3 3.7 62.6 60.3 2.2 41.1 43.5 less biased 11 59.0 33.6 25.4 40.0 43.4 −3.3 127.5 130.4 less biased
12 62.7 57.9 4.8 58.9 62.7 −3.9 39.2 37.7 biased
13 75.6 71.5 4.0 64.7 67.4 −2.7 30.7 21.9 biased ∗