Artigo
*e-mail: [email protected]
DEVELOPMENT AND VALIDATION OF A METHOD FOR THE ANALYSIS OF OCHRATOXIN A IN ROASTED COFFEE BY LIQUID CHROMATOGRAPHY/ELECTROSPRAY-MASS SPECTROMETRY IN TANDEM (LC/ESI-MS/MS)
Raquel D. C. C. Bandeira*
Instituto de Tecnologia, Universidade Federal Rural do Rio de Janeiro, Seropédica, BR 465, km 7, 23890-000 Seropédica – RJ, Brasil / Diretoria de Metrologia Científica e Industrial, Instituto Nacional de Metrologia Normalização e Qualidade Industrial, Divisão de Metrologia Química, Distrito de Xerém, Av. Nossa Sra. das Graças, 50, 25250-020 Duque de Caxias – RJ, Brasil
Thais M. Uekane, Carolina P. da Cunha, Luths R. O. Geaquinto,Valnei S. Cunha e Janaina M. R. Caixeiro
Diretoria de Metrologia Científica e Industrial, Instituto Nacional de Metrologia Normalização e Qualidade Industrial, Divisão de Metrologia Química, Distrito de Xerém, Av. Nossa Sra. das Graças, 50, 25250-020 Duque de Caxias – RJ, Brasil
Ronoel Luiz O. Godoy
Embrapa Agroindústria de Alimentos, Guaratiba, Av. das Américas, 29501, 23020-470 Rio de Janeiro – RJ, Brasil
Marcus Henrique C. de la Cruz
Instituto Nacional de Controle de Qualidade e Saúde, Fundação Oswaldo Cruz, Manguinhos, Av. Brasil, 4365, 21040-900 Rio de Janeiro – RJ, Brasil
Recebido em 19/1/11; aceito em 21/5/11; publicado na web em 22/7/11
A method using LC/ESI-MS/MS for the quantitative analysis of Ochratoxin A in roasted coffee was described. Linearity was demonstrated (r = 0.9175). The limits of detection and quantification were 1.0 and 3.0 ng g-1, respectively. Trueness, repeatability and intermediate precision values were 89.0-108.8%; 2.4-13.7%; 12.5-17.8%, respectively. To the best of our knowledge, this is the first report in which Ochratoxin A in roasted coffee is analysed by LC/ESI-MS/MS, contributing to the field of mycotoxin analysis, and it will be used for future production of Certified Reference Material.
Keywords: coffee; Ochratoxin A; LC/ESI-MS/MS.
INTRODUCTION
Coffee is an extremely complex food matrix and has an important role in the world´s economy, especially in producing and exporting countries like Brazil, which is the third largest consumer of coffee, according to the Brazilian Association of Coffee Industry. However, this product may suffer technical barriers imposed to exportation because of the possible presence of ochratoxin A.1
Ochratoxin A (OTA) is classified by International Agency for Research on Cancer (IARC) as a potent nephrotoxic and nephrocarcinogenic mycotoxin. It is produced by several Asper-gillus and Penicillium species; being A. westerdijkiae the most common found in Brazilian coffee (84.0%). OTA is related to Balkan Endemic Nephropathy (BEN) an endemic fatal disease in south-eastern Europe and to the development of urinary tract tumors (ITT) in humans.2-6 This mycotoxin has been found in
food commodities such as cereals, oleaginous seeds, wine, meat, cocoa, spices, dried fruits, grapes, beer, green, roasted and instant coffee.7-23
Once OTA is formed, it survives in most of food-processing steps, such as cooking, fermenting and roasting, as in the case of coffee beans. Roasted coffee produces the most different results in terms of OTA stability, since losses were reported in the range of 0-100%.1,24,25
According to a report from 2002 on the assessment of dietary intake of OTA by the population of the EU members states, the participa-tion of coffee was estimated in 10%. This contributes significantly to human intake of this mycotoxin.3
The maximum limits for OTA are regulated in many countries but not in Brazil. A regulatory limit of 5.0 ng g-1 for OTA in roasted
coffee has been established by European Union (EU, 2005/123/
EC). This reference value was followed because main markets for Brazilian coffee are in european countries, like Italy and Germany (EU). This established limit is very important as it aimes to protect consumers’ health.26,27
Several techniques have been described for determining OTA in food matrix using thin-layer chromatography (TLC), gas chro-matography (GC), enzyme-linked immunosorbent assay (ELISA), high performance liquid chromatography with fluorescence detector (HPLC-FLD) and liquid chromatography–mass spectroscopy (LC/
MS).7,16,19,28-31 The Official Methods of Analysis of AOAC
Interna-tional (AOAC) recomends a method for the determination of OTA is based on TLC and HPLC-FLD. Method proposed by Ministério da Agricultura, Pecuária e Abastecimento (MAPA) is based on HPLC--FLD. Sometimes, positive findings are confirmed by methylation of OTA and a second HPLC experiment. Due to its robustness and cost-effective handling thin-layer chromatography (TLC) with FLD detection is still routinely used in countries outside Europe and North America. The major disadvantage of this technique is the comparable low sensitivity towards OTA (ppb range) and frequently interferences with the sample matrix.6,8,32 GC-based methods found
Elisa or HPLC-FLD. Only few new LC/MS studies were published for OTA applying different liquid injection. They are focused on the mass spectrometric properties such as ionization efficiency and in-source fragmentation. LC/ESI-MS/MS is especially help-ful in confirming doubthelp-ful “Ochratoxin A positive” results and the sensitive is enhanced by operating the MS in the selected reaction monitoring mode (SRM). Coelution problem of interfering com-pounds and retention time shifts could lead to erroneous positive or negative results can be overcome by structural elucidation provided by coupling of LC and mass spectrometry (MS).33
In general, and no matters the applied detection technique, there is a need for a careful sample clean up. The extract is usually puri-fied by solid-phase extraction, or by using immunoaffinity absorbent materials, or by a combination of both. An overview of the process is such that the toxin is usually extracted with water, organic solvents, salt aqueous solution and acids or several mixtures. Specially for coffee, it is important to have an adequate clean up to remove sub-stances like lipids and pigments that could interfere in the analytical techniques.13,34,35
Validation procedures of analytical method are necessary for legislation implementation to show that the method produces reliable results, provide accurate and reproducible results for monitoring and risk-assessment studies.3,29 The absence of available Certified
Refer-ence Material (CRM) of OTA in roasted coffee is also an issue related to the validation of methods.5,28
Due to the possible risk of Ocratoxina A as a contaminant in coffee (human health problem), as well as the important role of this product in the world´s economy, there is a strong need of a validated method in this area that could be used by coffee-producing and -exporting countries to check the compliance of consignments with criteria set by importing countries. The purpose of this study was to develop and validate new analytical method to analyse OTA in roasted coffee. This method will be modern, fast and efficient, us-ing matrix-matched calibration by Liquid Chromatography Tandem Mass Spectrometry coupled with electrospray ionization (LC/ESI-MS/MS). This procedure was based on the European Union decision 2002/657/EC and INMETRO´s document DOC-CGCRE-008/2010. This study is the first step in producing a CRM for OTA in food samples, such as coffee.
EXPERIMENTAL
Material
One kilogram of commercial brazilian roasted coffee was aqui-red (from the same brand) at local market, and was stoaqui-red at room temperature.
The reagents used were sodium bicarbonate (Tedia, USA, 99.7%), potassium dihydrogen phosphate (Merck, Germany, 99.0%), anhydrous disodium hydrogen phosphate (Merck, Germany, 99.0%), sodium chloride (Spectrum, USA, 99.0%), potassium chloride (Mer-ck, Germany, 99.5%) and potassium dichromate (Mer(Mer-ck, Germany, 99.5%). The solvents used were methanol HPLC grade (Tedia, USA, 99.9%), sulfuric acid (Merck, Germany, 97.0%), trifluoroacetic acid HPLC grade (Tedia, USA, 99.8%), acetone pesticide grade (Tedia, USA, 99.8%), glacial acetic acid (Tedia, USA, 99.9%), toluene HPLC grade (Tedia, USA, 99.8%), benzene (Merck, Germany, 99.5%), acetone A.C.S. grade (Tedia, USA, 99.8%), ethyl alcohol (Quimes, Brazil, 95.0%) and sodium hypochlorite (Invema, Brazil, 12.0%).
The Mill-Q water system was used, in which Ultrapure water (conductivity under 0.056 mScm) generated by the Milli-Q water system (Millipore Inc., Paris, France, type I) was used for the prepa-ration of all aqueous solution and for HPLC.
Saline phosphate buffer water solution (PBS) at pH 7 was used (0.020% potassium dihydrogen phosphate, 0.110% anhydrous di-sodium hydrogen phosphate, 0.800% di-sodium chloride and 0.020% potassium chloride).
Crystalline Ochratoxin A standard was obtained from Sigma-Aldrich (St Louis, 98.0%, USA).
The immunoaffinnity columns (IA) were OchratestTM WB (Vicam
Inc.,Watertown, USA).
Standard solution
Stock standard solution (40 µg mL-1) was prepared in a mixture of
toluene and glacial acetic acid (99:1). The nominal concentration was calculated by UV spectrophotometry at INCQS/FIOCRUZ assuming a molar absorption coefficient of 5440 M-1 cm -1 (333 nm), according
to the recommendation of AOAC.36 This solution was stored in a
fre-ezer at -18 ºC. More diluted solutions of 100.0 ng g-1 were prepared
by weighting an appropriate mass of the intermediate solution as it follows. In a 4.0 mL glass flask, previously tared, a mass of 0.14748 g of intermediate solution was weighted. In a 250 mL amber bottle, previously tared, weighted 100.096 g of mobile phase. Next, the 4.0 mL flask was carefully inserted inside the bottle containing the mobile phase and homogenized to obtain a final solution.
Extraction of OTA from roasted coffee
The sample preparation procedure was based on Pittet’s work.37
An aliquot of 25.0 g of roasted coffee samples was weighted into a 250 mL amber glass flask and fortified with standard solution and kept at room temperature overnight. Then, it was transferred quantitatively, in addtion of 190.0 g of a mixture of methanol and an aqueous sodium bicarbonate solution 3.0% (1:1), and mixed in a blender for 5 min at low speed. The homogenated sample was filtered through three filters under vacuum using a qualitative paper JP41 28 µm (J.Prolab,
Germany), followed by a fiberglass (Whatman, EUA) and a cellulose membrane 0.45 µm (Millipore, EUA).
For further purification, the ochratest immunoaffinity column (IA) was placed at room temperature. On the top of this column a 60.0 mL syringe was attached. A vacuum Manifold Vac Elut 20 (Varian, Walnut, USA) was connect to the IA column as well. A 4.6 g aliquot of the filtrate was weighted into a 100.0 mL volumetric flask, diluted with a saline phosphate buffer and homogenized. This extract was eluted into the IA column at a flow rate of 2.0-3.0 mL min -1. After that, the IA column was flushed with 10.0 mL of Milli-Q
water at the same flow rate and then slightly dried by vacuum for 30 s. An aliquot of 4.0 mL of methanol HPLC was added and then a period of 3 min was waited to allow the solvent to permeate the gel before elution step. The OTA was collected in a test tube. The solvent was removed under nitrogen stream at 37 oC. Finally, the
extract was reconstituted with 1.0 g of mobile phase and homoge-nized in a vortex (Phoenix, USA).
Calibration curve
After optimization’s method, two calibration curves were deve-loped: one with the matrix (fortified samples) and another without the matrix. Both of them were prepared by gravimetric dilution at 5 levels (3.0; 4.0; 5.0; 6.0 and 7.0 ng g-1).
The standard calibration curve was prepared by adding OTA standard solution (100.0 ng g-1) in mobile phase. Whereas, the
LC/ESI-MS/MS analysis
Analyses were performed with a 1200L LC/ESI-MS/MS triple quadrupole (Varian, Walnut, Creek, CA, USA). The mass spectrome-ter detector was equipped with an electrospray (ESI) ionization ope-rating in the positive mode. The LC was equipped with mobile phase pumps (ProStar 210), a degassit on line, an auto sampler (ProStar 410) and a column thermostat. The ESI interface was calibrated using a polypropyleneglycol solution (PPG) provided by manufacturer, and ESI parameters were optimized by direct infusion of standard solution into the mass spectrometer.
The mass spectrometer was operated in Selective Reaction Mo-nitoring (SRM) mode with positive electrospray ionization (ESI+) to confirm the identity of OTA. The LC/MS/MS parameters were obtained throught direct infusion of the standard solution of OTA: needle voltage 5000 V, shield voltage 600 V, capillary voltage 50 V, housing temperature at 40 ºC and detector voltage 1600 V. High purity nitrogen was used as nebulizer gas (40 psi) and as drying gas (21 psi; 340 oC). After, standard solution breakdown curves were
construc-ted. Through these curves, precursor-to-product ions were selected according to the most abundant colision energy and high mass. The precursor ion (pseudo-molecular) [M+H]+m/z 404 was selected in the
first quadrupole (Q1). After this ion was fragmented, using ultrapure argon at 2.0 mTorr as collision gas in the second quadrupole (Q2). The product ions [M+H]+m/z 239 and m/z 358 were obtained in the
third quadrupole (Q3) and were used for SRM mode.
Separations were conducted using a Synergi Hydro C18 column (75
mm x 2.0 mm i.d.; 4 µm, Phenomenex, Torrance, California, USA) with a Security guard column (KJO-4282, AQ C18, 4 x 2.0 mm) at 25
oC.
Mobile phase was water with 0.05% trifluoracetic acid and methanol with 0.05% trifluoracetic acid (20:80) at flow rate of 0.3 mL min -1, in
an isocratic elution (20:80). This solution was filtered with a LCR PTFE membrane 0.45 µm (Millipore, EUA) and degassed by ultrasonic bath Model USC 1400 (Unique, Brasil). The injection volume was 50 µL.
Validation
The selected parameters for method validation were linearity, specificity, accuracy, limit of detection (LOD) and quantification (LOQ) and precision. The validation parameters were based on Na-tional Institute of Metrology, Standardization and Industrial Quality (INMETRO, The Brazilian National Metrology Institute - NMI) do-cument (DOC-CGCRE-008) and on the European Union Commission Decision (EC-657/2002).38,39
All results were checked for the presence of outliers using Grubbs test and any value considered as an outlier was excluded.
Specificity means the ability of a method to distinguish between the measured analytes and other substances, which can change accor-ding to the compound class or matrix. The presence of peaks that could interfere in the identification and quantification of OTA was verified by analyzing representative blank roasted coffee samples (n = 20).40
Any matrix effects may interfere the quantification of target analytes in complex samples. The absolute matrix effect was calcu-lated by comparing the slope of matrix-matched standard curve with the slope of the standard calibration curve.
The linearity of the method was obtained by linear correlation coeffi-cient (r) from the calibration curve. A reference value higher than 0.90 is recommended, according to the orientative document of the INMETRO.38
For homoscedasticity, the results from the calibration curve were submitted to a Cochran’stest to verify that random errors in the instrumental signal measurements are constant and independent of the predicted value.41
The limit of quantification (LOQ) was determined from the lowest
concentration of the working range (3.0 ng g-1). The chromatograms
of samples that produced a signal-to-noise ratio equal to ten were considered as the LOQ. For confirmation purposes, three roasted coffee samples were spiked with OTA at the same concentration level and the signal-to-noise ratio was calculated. Then, the limit of detection (LOD) was calculated.
The accuracy was expressed by trueness and precision. Trueness means the closeness agreement between the average value obtained from a large series of test results and an accepted reference value. When no Certified Reference Material (CRM) is available, it is acceptable that trueness of measurements is assessed through recovery of additions of known amounts of the element to the unknown samples. 39,42
The recovery of OTA in roasted coffee was obtained from spiked samples of roasted coffee at three levels of contamination (3.5, 5.0 and 6.5 ng g-1). The mean recovery values calculated in the roasted coffee
was compared with the theoretical concentration. The acceptance criterion is a recovery between 70 and 110% according to Codex Alimentarius Commission.27
The precision was expressed by repeatability and intermediate precision by the relative standard deviation. The repeatability (RSDr %)
was obtained from analysis conducted by the same analyst on the same day and the intermediate precision (RSDR %) was obtained by a different
condition (different analyst on different day) at the same concentration level as the recovery. According to the Codex Alimentarius Commission, the acceptance criterion is equal or lower than 20% for RSDr and equal or
lower than 30% for RSDR. Furthermore, the intermediate precision was
also assessed by test F and t Student for variances analysis and averages in the same concentration that was used for recovery.27
RESULTS AND DISCUSSION
First, the selective ion monitoring (SIM) mode was tested and good results were obtained. However, in the working range of the calibration curve the ions monitored were not well observed due to high noise and poor peak resolution. Thus, the SIM mode was not used for further development and method validation for OTA analysis (data not shown).
Therefore, the standard solution breakdown curves were obtained by direct infusion of OTA and precursor-to-product ions in the posi-tive electrospray mass spectra (ESI-MS) were observed and used for the selective reaction monitoring (SRM) mode using the protonated molecule [M+H]+m/z 404, presented in Figure 1. After analysis of
the breakdown curves, precursor-to-product transitions were obtained for the performance of the SRM.
The European Union Commission Decision (EC-657/2002) states that confirmatory methods for residue analysis should provide infor-mation on chemical structure of analyte.39 For liquid chromatography
coupled with a mass spectrometry detector four identification points are required that can be accomplished by monitoring one precursor ion and two product ions. The method developed and validated in this study monitored two ions according to their collision energies: m/z 404>239 (-20.5 V) and m/z 404>358 (-10.5 V) for quantification and confirmation of OTA. The product ion showing the highest intensity was used for quantification, m/z 239, which corresponded to the loss of phenylalanine for OTA.8
The experimental results were checked for the presence of outliers through Grubbs test before the validation process, and none of the results were considered an outlier.
Linearity
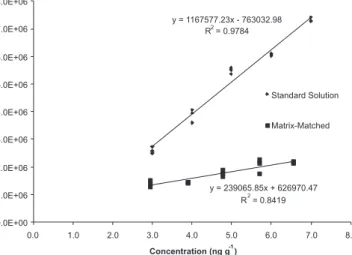
The linearity for OTA was good as shown by the linear correlation coefficient (r) above 0.9891 and 0.9175 for standard solution and matrix-matched calibration of OTA, respectively. Figure 2 shows the results of the regression parameters of the OTA standard solution and matrix-matched calibration curves.
The calibration line was plotted with the residuals (the diffe-rence of the experimental points from the fitted line) as a function of concentration. An acceptable fit from the matrix-matched cali-bration curve showed a random pattern of residues in the working range (Figure 3), indicating a system free of bias confirming the method’s linearity.33
The value of Cochran’s test was 0.58 (Ccalc), lower than the value
of 0.68 (Ctab) for the 5 levels of matrix-matches calibration curve
with three replicates, proving the homoscedasticity.
Specificity
Figure 4 shows a chromatogram of spiked roasted coffee in 3.0 ng g-1 and an example for blank roasted coffee. No interference from
the matrix around the retention time of OTA was observed, thus the method is considered specific for this analysis.
Matrix effect
Comparing the slope values from both calibration curves, it can
be observed that the values are different, indicating significant di-fferences between the calibration curves of matrix and solvent. This means that there is a matrix effect on the response to the linearity. In this case, all subsequent validation parameters were accomplished using a matrix-matched calibration curve.
Limit of quantification (LOQ) and limit of detection (LOD)
The limit of quantification (LOQ) was 3.0 ng g-1 in roasted coffee
samples, which is the first concentration level of the matrix-matched calibration curve proposed by this study. The limit of detection (LOD) was 1.0 ng g-1. This value was higher than determined by other Figure 1. Standard solution breakdown curves of protonated molecule [M+H]+ m/z 404
Figure 2.Standard solution and matrix-matched calibration curves of OTA
Figure 3.Distribution of residues in the working range 3.0-7.0 ng g-1
techniques already described in the literature, such as fluorescence detector. 6,8,35
Accuracy
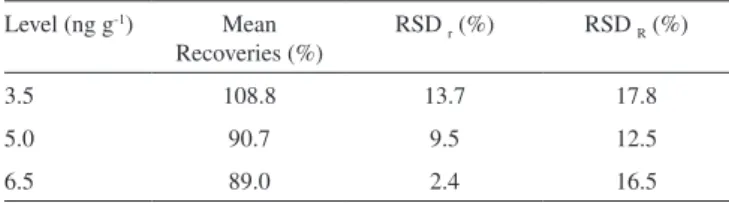
The trueness values obtained in the present study for diffe-rent concentrations of OTA were between 89.0 and 108.8% and they are in accordance to Codex Alimentarius Commission for a contamination level less than 10.0 ng g-1.27 Higher recovery
rates were found for the low contamination level. Table 1 shows recovery values, which were considered satisfactory for roasted coffee samples in all fortification levels, and were similar to those obtained with fluorescence detection methods currently in use, such as Enterwilse et al. (65-97%) and Pittet et al. (89-100%).37,43
On the other hand, this method presents recovery values higher than those reported by Ahmed et al., 73-86%; Ventura et al., 82%; Sibanda, De Saeger and van Peteghem, 72-84% and Gilbert and Anklam, 85%.28,30,35,44
All RSDr values are within acceptable levels for repeatability,
ranging between 2.4 and 13.7 that are lower than 20% according to Codex Alimentarius Commission.27 The RSD
R values for intermediate
precision, ranging between 12.5 and 17.8 are lower than 30%; both RSDr and RSDR were better than the values obtained from Gilbert
and Anklam and from Enterwilse et al..28,43 According to test t and F,
intermediate precision was equivalent since the Fcal value (1.3) was
lower than the Ftable value (19.0) for OTA, so it can be concluded that
the two analysts are not significantly different from each other and the method has adequate intermediate precision.
Sixteen samples of roasted coffee acquired from the local market were analyzed, 31% contained detectable levels of OTA, ranging be-tween 0.09 and 9 ng g-1, with two samples showing detectable level of
OTA above 5.0 ng g-1, which is the accepted limit for roasted coffee. CONCLUSIONS
The analytical methodology purposed provides good results in term of linearity, specificity, accuracy, precision, limit of detection and quantification for determination of OTA in roasted coffee.
LC/ESI-MS/MS in combination with SRM mode is a very sensitive and useful method and has several advantages compared to established methods. First, the sensitivity is comparable to that obtained with fluorescence detection, currently in use. Next, the problem of coelution of interfering compounds can be overcome by the structure information provided by tandem mass spectrometry. LC/ ESI-MS/MS is especially helpful to confirm doubtful “OTA positive” results obtained by other techniques.
The validation parameters measured are within acceptable limits and were considered satisfactory. Linearity was demonstrated for contamination levels between 3.0 and 7.0 ng g–1. LOD and LOQ
were 1.0 and 3.0 ng g–1 respectively. Trueness, RSD
r and RSDR values
were between 89.0-108.8%; 2.4-13.7%; 12.5-17.8%, respectively.
Table 1. Mean recoveries (%), repeatability (RSDr %) and intermediate
precision (RSDR %) values from matrix-matched calibration curve at three different levels of fortification (n=3)
Level (ng g-1) Mean Recoveries (%)
RSD r (%) RSD R (%)
3.5 108.8 13.7 17.8
5.0 90.7 9.5 12.5
6.5 89.0 2.4 16.5
The analytical procedure is adequate enough to be used in the analysis of OTA contamination in roasted coffee samples, not only for ensuring compliance with tolerances and guidelines, but also for monitoring, surveying study and researching. To the best of our knowledge, this is the first report in which Ochratoxin A in roasted coffee is analysed by LC/ESI-MS/MS using the matrix-matched calibration method. The study proposed in this article contributes to the field of mycotoxin analysis that will be used for future production of Certified Reference Material (CRM).
ACKNOWLEDGEMENTS
The authors thank for Financial Support of CNPq and FINEP; for assistance with UV spectrophotometric analysis (INCQS/FIOCRUZ).
REFERENCES
1. http://www.abic.com.br/, acessada em Maio 2010 e Março 2011. 2. Noonim, P.; Mahakarnchanakul, W.; Nielsen, K. F.; Frisvad, J. C.;
Sam-son, R. A.; Int.J. Food Microbiol.2008, 28, 197.
3. Vatinno, R.; Aresta, A.; Zambonim, C. G.; Palmisano, F.; J. Chromatogr., A2008, 1187, 145.
4. Pena, A.; Cerejo, F.; Silva, L. J. G.; Lino, C. M.; Talanta2010, 82, 1556.
5. Monaci, L.; Palmisano, F.; Anal. Bioanal. Chem.2004, 378, 96. 6. Zollner, P.; Mayer-Helm, B.; J. Chromatogr., A2006, 1136, 123. 7. Almeida, A. P.; Alaburda, J.; Shundo, L.; Ruvieri, V.; Navas, S. A.;
Lamardo, L. C. A.; Sabino, M.; Braz. J. Microbiol.2007, 38, 300. 8. Becker, M.; Degelmann, P.; Herderich, M.; Schreier, P.; Humpt, H. U.;
J. Chromatogr., A1998, 818, 260.
9. Bresh, H.; Urbanek, M.; Hell, K.; Archiv für Lebensmittelhygiene2000,
51, 89.
10. Buchelli, P.; Taniwaki, M. H.; Food Addit. Contam. 2002, 19, 655. 11. Bullerman, L. B. In Encyclopedia of Food Sciences and Nutrition;
Caballero, B.; Trugo, L. C.; Finglas, P., eds.; Academic Press: London, 2003.
12. Fujji, S.; Ono, E. Y. S.; Hirooka, E. Y.; Semina: Ci. Agrárias2002, 23, 273.
13. Fujii, S.; Ono, E. Y. S.; Ribeiro, R. M. R.; Assunção, F. G. A.; Taka-bayashi, C. R.; Oliveira, T. C. R. M.; Itano, E. N.; Ueno, Y.; Kawamura, O.; Hirooka, E. Y.; Braz. Arch. Biol. Technol.2007, 50, 349.
14. Furlani, R. P. Z.; Soares, L. M. V.; Oliveira, P. L. C.; Rev. Inst. Adolfo Lutz1998, 58, 87.
15. Gollucke, A. P. B.; Taniwaki, M. H.; Tavares, D. Q.; Ciênc. Tecnol. Ali-ment. 2004, 24, 641.
16. Masoud, W.; Kaltoft, C. H.; Int. J. Food Microbiol. 2006, 106, 229. 17. Mantle, P. G.; Int. Biodeterior. Biodegrad. 2002, 50, 143.
18. Patel, S.; Hazel, C. M.; Winterton, A. G. M.; Gleadle, A. E.; Food Addit. Contam. 1997, 14, 217.
19. Prado, G.; Oliveira, M. S.; Abrantes, F. M.; Santos, L. G.; Veloso, T.; Barroso, R. E. S.; Ciênc. Tecnol. Aliment.2000, 20, 192.
20. Pohland, A. E.; Nesheim, S.; Friedman, L.; Pure Appl. Chem.1992, 64, 1029.
21. Sforza, S.; Dall´Asta, C. E.; Marchelli, R.; Mass Spectrom. Rev. 2006, 25, 54.
22. Studer-Rohr, I.; Dietrich, D. R.; Schlatter, J.; Schlatter, C.; Food Chem. Toxicol.1995, 33, 341.
23. Taniwaki, M. H.; Pitt, J. I.; Teixeira, A. A.; Iamanaka, B. T.; Int. J. Food Microbiol. 2003, 82, 173.
24. Lobeau, M.; De Saeger, S.; Sibanda, L.; Barna-Vetró, I.; van Peteghem, C.; Anal. Chim. Acta2005, 538, 57.
26. European Comission; Official Journal of the European Union L25, 5, 2005.
27. World Health Organization (WHO); Joint FAO/WHO Food Standards Programme Codex Committee on Contaminants in Food; Discussion paper on Ochratoxin A in coffee; First Session, April 16-20, 2007. 28. Gilbert, J.; Anklam, E.; Trends Anal. Chem. 2002, 21, 468.
29. Pardo, E.; Marin, S.; Ramos, A. J.; Sanchis, V.; Food Sci. Technol. Int.
2004, 10, 45.
30. Ahmed N. E.; Farag, M. M.; Soliman, K. M.; Abdel-Samed, A. K. M.; Naguib, Kh. M.; J. Agric. Food Chem.2007, 55, 9576.
31. Sugita-Konish, Y.; Tanaka, T.; Nakajima, M.; Fujita, K.; Norizuki, H.; Mochizuki, N.; Takatori, K.; Talanta2006, 69, 650.
32. Ministério da Agricultura, Pecuária e Abastecimento (MAPA); Instrução Normativanº 9, 2000.
33. Diaz, G. J.; Ariza, D.; Perilla N. S.; Mycotox. Res. 2004, 20, 59. 34. Vargas, E. A.; Santos, E. A.; Pittet, A.; J. AOAC Int.2005, 88, 773. 35. Ventura, M.; Vallejos, C.; Anaya, I. A.; Broto-Puig, F.; Agut, M.;
Co-mellas, L.; J. Agric. Food Chem.2003, 51, 7564.
36. AOAC Official Method 2000.09; Official Methods of Analysis, 18th ed.; AOAC Internacional: Washington, DC, 2005.
37. Pittet, A.; Tornare, D.; Huggett, A.; Viani, R.; J. Agric. Food Chem.
1996, 44, 3564.
38. Instituto Nacional de Metrologia. Normatização e Qualidade Industrial (INMETRO); Orientações sobre Validação de Métodos de Ensaios Químicos; DOQ-CGCRE-008, Revisão: 03, fevereiro de 2010. 39. European Comission; Official Journal of the European Union L221, 36,
2002.
40. Rogastsky, E.; Stein, D.; J. Am. Soc. Mass Spectrom.2005, 16, 1757. 41. Cuadros-Rodriguez, L.; González-Casado, A.; García-Campanã, A. M.;
Vilchez, J. L.; Chromatographia1998, 47, 550.
42. Amézqueta, S.; González-Peñas, E.; Murillo, M.; López de Cerain, A.; Food Addit. Contam. 2004, 21, 1096.
43. Enterwilse, A. C.; Williams, A. C.; Mann, P. J.; Russell, J.; Slack, P. T.; Gilbert, J.; J. AOAC Int.2001, 84, 444.