Artigo
*e-mail: [email protected]
METHANOL STEAM REFORMING OVER Cu/CeO2 CATALYSTS. INFLUENCE OF ZINC ADDITION
Franco Tonelli, Osvaldo Gorriz, Luis Arrúa and Maria Cristina Abello*
Instituto de Investigaciones en Tecnología Química, Universidad Nacional de San Luis - Consejo Nacional de Investigaciones Cientíicas y Técnicas, Chacabuco y Pedernera, 5700 San Luis, Argentina
Recebido em 20/10/10; aceito em 17/3/11; publicado na web em 5/5/11
Methanol steam reforming reaction was studied over Cu(5 wt.%)/CeO2 with and without the presence of Zn. The Zn addition
decreased the Cu+2 reducibility and increased the oxygen mobility of ceria. The main products were CO
2 and H2 with small amount
of CO. Selectivity to CO decreased with the Zn addition and it was lower at lower reaction temperatures and lower space velocities. At 230 ºC and W/FMeOH = 648 g min mol-1 selectivities to H2 and to CO2 were 100% on Zn/Cu/Ce. The catalytic results indicated that
CO was mainly a secondary product formed from reverse water gas shift reaction. Keywords: hydrogen; methanol; CO formation.
INTRODUCTION
In a near future the fuel cells are going to play an important role for electric power generation applications. The fuel cells have high eficiency and low emission label. In particular, polymer electrolyte fuel cells (PEM) have been proposed for the portable devices due to their compactness and mild operation conditions.
The supply, storage and handling of hydrogen are problems which should be solved. One of the solutions is the use of hydrocarbons or alcohols as hydrogen carriers. Hydrogen could be obtained in on-board reformers through three consecutive catalytic processes: reforming of hydrocarbons or alcohols (steam reforming, partial oxidation or autothermal reforming) to mainly produce H2, CO2 and CO; water gas shift reaction (CO + H2O → CO2 + H2) to increase H2 yield and to decrease CO, and inally, selective partial oxidation of CO in the presence of a rich mixture of H2 (CO + ½ O2 → CO2) to decrease CO to a level less than 10 ppm.1 Formation of CO should be avoided as much as possible, since CO is poison to the platinum cathode in the PEM assembly.2,3
Methanol is considered an attractive raw material due to the high hydrogen/carbon ratio (4:1) equal to that of methane, no C C bond, low required temperatures in the steam reforming reaction (SRM), low sulfur content and high availability as a worldwide commodity.4 Besides, it is a liquid at atmospheric pressure and room temperature and it has a low boiling point (65 °C) which allows a facile vapori-zation in the near temperature range as that for water.
Methanol steam reforming has been studied over Cu based catalysts, such as Cu/ZnO/Al2O3 at temperatures lower than 300 ºC.5-9 Cu-ZnO interactions have been reported to have a marked effect in catalytic activity due ZnO improved the metal dispersion and reducibility of Cu2+ species.8 However, these catalysts presen-ted some inconveniences: high CO formation, low stability with time due to the tendency of copper sintering and their pyrophoric nature when they are exposed to oxidizing environments. The effects of CeO2 and ZrO2 on CuO-ZnO-Al2O3 catalysts have been also studied.10,11 Recently, a review about copper-based catalysts has been published.12
The use of CeO2- based catalysts has shown a rapid increase in the last decade. The high mobility of oxygen and the strong interactions with the supported metal have rendered the CeO2 a very attractive catalytic support.13-17 Patel and Pant have reported the use of CeO
2 to increase the copper dispersion and the thermal stability.18 Besides, CeO
2 could decrease the CO concentration in the reformer efluent,7,19 and favor the coke gasiication.20 It is also reported in literature that the Ce
1-xCuxO2-x solid solution could lead to a high Cu dispersion after reduction.19
The activity in SRM over CuO-CeO2 catalysts was signiicantly affected by the copper amount. Liu et al.19 have reported an optimal composition of 26.9 wt.% Cu substantially lower than the optimum (80 wt.%) proposed by Oguchia et al..21 We have studied supported catalysts with a lower loading (around 5 wt.%Cu) which have turned out to be very active in the methanol steam reforming.22
In this work, the preparation, characterization and catalytic activi-ty of Cu supported CeO2 are discussed. The inluence of Zn addition in the steam reforming of methanol is also studied.
EXPERIMENTAL
Catalyst preparation
CeO2 used as support was prepared by precipitation method from an aqueous solution of Ce(NO3)3.6H2O. NH4OH (0.9 M) was added dropwise until pH = 9 at room temperature under vigorous stirring. The precipitate was iltered, washed with bi-distilled water and dried under vacuum at 80 °C overnight. The dried solid was calcined at 500 °C for 4 h in air. The support calcination temperature was chosen with the aim to avoid possible changes in speciic surface area induced by operation conditions. Then, it was impregnated with an aqueous so-lution of Cu(NO3)2.2H2O by dry impregnation method. The nominal copper composition was 5 wt.%. This solid dried in vacuum at 80 °C overnight and calcined in static air at 400 °C for 4 h was named Cu/Ce.
Catalyst characterization
All samples were characterized using different physical_chemical methods.
X-ray luorescence (XRF)
The chemical composition was determined by XRF, with a Philips PW 1400 equipment.
BET surface area
BET surface areas were measured using a micromeritics Gemini V instrument by nitrogen adsorption at –196 °C on 200 mg of sample previously degassed at 250° C for 3 h.
X-ray diffraction (XRD)
XR diffraction patterns were obtained with a Rigaku diffractome-ter operated at 30 kV and 20 mA by using Ni-ildiffractome-tered CuKα radiation (λ= 0.15418 nm) at a rate of 3° min-1 from 2θ = 20 to 100°. The powdered samples were analyzed without previous treatment after deposition on a glass sample holder. The identiication of crystalline phases was made by matching with the JCPDS iles.
Thermal gravimetry (TG)
The analyses were recorded using TGA 51 Shimadzu equipment. The samples, c.a. 15 mg, were placed in a Pt cell and heated from room temperature to 800 °C at a heating rate of 10 °C min-1 with an air low of 50 mL min-1.
Temperature programmed reduction (TPR)
Studies were performed in a conventional TPR equipment. This apparatus consists of a gas handling system with mass low control-lers (Matheson), a tubular reactor, a linear temperature programmer (Omega, model CN 2010), a PC for data acquisition, a furnace and various cold traps. Before each run, the samples were treated in He at 300 °C for 30 min. After that, the system was cooled down to 25 °C. The samples were subsequently contacted with a 30 mL min-1 low of 5 vol.% H2 in N2, heated at a rate of 10 °C min-1 from 25 °C to a inal temperature of 350 °C and held at 350 °C for 1 h. The TPR of support was carried out from room temperature to 650 °C. Hydrogen consumption was monitored by a thermal conductivity detector after removing the water formed.
Catalytic test
The methanol steam reforming reaction was carried out in a glass tubular reactor operated at atmospheric pressure between 230 and 300 °C. The reactor was placed in a vertical furnace, which was controlled by a programmable temperature controller. The reaction temperature was measured with a coaxial K thermocouple. The feed to the reactor was a gas mixture of methanol, water and nitrogen (free of oxygen). Methanol and water were fed through independent saturators before mixing. The low rates of N2 gas stream were con-trolled by mass lowmeters. The total low rate was 80 mL min−1 at room temperature with an methanol molar composition of 5%. The H2O:CH3OH molar ratio was 1.2 in all the experiments. This value slightly higher than the stoichiometric one was chosen taking into account that the net energy density of methanol is roughly the same as that for the hydrocarbon fuels when the stoichiometrically requerid water is considered. The catalyst weight was varied from 100 and 300 mg (0.3-0.5 mm particle size range selected after preliminary mass transport experiments to minimize diffusional resistances). The cata-lyst without pre-reduction was heated to reaction temperature under N2 low, then the mixture with CH3OH + H2O was allowed to enter
into the reactor to carry out the catalytic test. The reactants and reac-tion products were analyzed on-line by gas chromatography. H2, CO2, CH3OH and H2O were separated by a 1.2 m Porapak T column and analyzed by TC detector. CO, CO2, CH2O, CH3OH and other carbon compounds were analyzed by a lame ionization detector after passing through a methanizer and a 1.2 m Porapak T column. The activity was measured at each temperature for 400 min. The performance of the catalysts was analized in terms of methanol conversion and selectiv-ity to products. The methanol conversion was deined as the ratio of reacted mol to the fed methanol. The homogeneous contribution was tested with empty reactor. This run showed very low activity at 300 °C being the methanol conversion around 5%.
RESULTS AND DISCUSSION
Some characteristics of the samples are shown in Table 1. The chemical composition determined by XRF is near the nominal values. Non signiicant differences in speciic surface areas of catalysts are found and they are lower than the support. The copper or zinc-cooper deposition causes a decrease in the speciic surface area around 10 and 20%, respectively. The SBET value of support is also lower than that reported by Tang et al.23 in spite of the use of a similar synthesis method. The discrepancies could be attributed to different calcination temperatures.
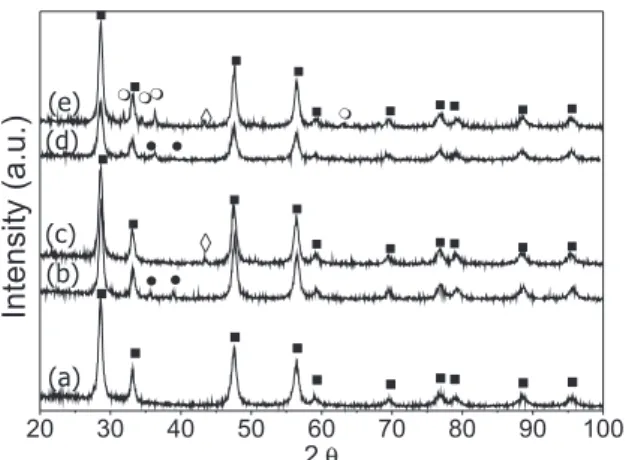
The diffraction patterns of support and catalysts are illustrated in Figure 1. XRD of support indicates the presence of the luorite struc-ture of CeO2 (2θ= 28.5, 33.1, 47.5 and 56.3°, JCPDS-34-394). Weak peaks at 2θ= 38.9, 35.7° corresponding to CuO (JCPDS-41-254) are observed in fresh Cu/Ce sample. In addition peaks at 2θ= 31.7, 34.5, 36.3° assigned to ZnO (JCPDS-05-664) are also detected in fresh Zn/ Cu/Ce sample. From a normalized analysis of XRD patterns between 2θ= 30 and 45° the intensity and width of CuO relection lines are similar in both catalysts. In the all cases, XRD of catalysts used in SRM under different operation conditions and 400 min in time on stream, show the relection line of Cu0 at 2θ= 43.5º (JCPDS-04-0836) whereas the peaks associated with CuO are not longer observed. From these results it could be inferred that Cu2+ species are early reduced under the presence of methanol. In Figure 1 (c and e) XRD of samples used at 300 °C are shown as example.
TPR proiles shown in Figure 2 are characterized by two peaks: a high intensity peak and the well deined shoulder peak in the lower temperature side. The proiles of both catalysts are similar. For Cu/ Ce, the irst peak (α) at 154 °C could be assigned to small particles of CuO and the second one (β) at 190 °C could be attributed to the reduction of CuO particles in a higher size. These results are in agre-ement with others in literature assuming that Cu2+ species reduce to metallic copper in a single step. Besides, the surface oxygen reduction of CeO2 also contributes to the observed hydrogen consumption. On CuO(5%)-CeO2 catalyst prepared by coprecipitation, a similar TPR proile with two maximum peaks at 152 and 175 °C was reported.24-26
Table 1. Characteristics of samples
Sample SBET
m2 g-1
Chemical composition*,
Cu wt.%
TPR results T peak α
°C T peak β
°C
H2/Cu mol/mol
CeO2 42 --- 535
The authors have also attributed the irst peak to disperse copper oxide clusters and the second arising from CuO particles strongly interacting with support but not incorporated into the support struc-ture. Tang et al.23 have also reported two peaks at 140 and 173 °C for CuO(5 wt%)/CeO2 whereas Wu et al.27 have observed three reduction peaks on CuO (10 wt.%)/CeO2 catalysts with maxima at 148, 173 and 209 °C. The last authors have suggested that the irst two peaks correspond to the reduction of CuO species while the third one was ascribed to the reduction of surface lattice oxygen in CeO2 support. The TPR proile for Zn/Cu/Ce also shows two peaks which are shifted in 37 °C at higher temperature, Table 1. The Zn addition decreases the reducibility of Cu2+ species but the extent of reduction measured as H2/Cu molar ratio is not signiicantly affected. In both cases the H2/Cu is 1.1 greater than that required for the quantitative reduction of Cu+2 to Cu0. From TPR proiles the areas of α (or α´) and β (or β´) peaks are estimated by deconvolution into two Gaussian peaks. They are different which could represent differences in the copper species abundance. The α/(α+β) ratio is 18% for Cu/Ce and 11.5% for Zn/Cu/ Ce. It could be thought that a higher fraction of tiny particles (which could no be detected by XRD) is present on Cu/Ce than Zn/Cu/Ce sample, then the Zn addition should decrease the copper dispersion.
Other explanation could be found assuming that Zn should favor the surface CeO2 reduction at low temperature (increasing the β peak). In the insert of Figure 2, TPR experiments for Zn/CeO2 and pure
CeO2 are shown. No peak is observed below 300 °C whereas one intense peak appears at 535 °C for CeO2 and 431 °C for Zn/CeO2. In literature it was reported one or two TPR peaks for pure CeO2 depending on the temperature range where the TPR experiment is carried out.23,28 Tang et al.23 have reported one peak around 430 °C, whereas Markaryan et al.28 have informed two peaks. The irst one at 500 ºC was assigned to the surface Ce+4 reduction, and the second one at about 850 ºC was attributed to reduction of bulk Ce+4. In our case, this second peak could not be observed since the TPR equipment used in this work does not allow sample reduction at temperatures higher than 700 °C. From the igure, the presence of Zn promotes the CeO2 reduction. The reduction temperature decreases from 535 to 431 °C and the H2 consumption is slightly higher to that of bare support. These results are in agreement with other the literature where it is reported that the presence of metals promotes the CeO2 reduction, specially the surface ceria.23,29
On CuO-ZnO mixed oxides catalysts prepared by coprecipitation it was reported that ZnO promotes the copper reduction.30 The Zn addition to Cu(30wt%)/SiO2 catalysts also caused an increase in the copper reducibility.31 The discrepancies can be ascribed to the pre-sence of Cu_Ce interactions which are signiicantly modiied by Zn addition. Then, the addition of Zn on Cu/CeO2 causes two effects: decreasing the dispersion of Cu and its reducibility and increasing the surface reduction and oxygen mobility of ceria.
In Figure 3, catalytic results obtained using Cu/Ce and Zn/Cu/ Ce catalysts are presented. The catalysts are used, without a previous reduction, at 260 and 300 °C being W/FMeOH = 1.94 10+3 g min mol-1. In both cases H2 and CO2 are the main products. Small amounts of CO are detected depending on reaction temperature, Tables 2 and 3. No other product such as formaldehyde, dimethyl ether, methyl formate or methane is detected. At 300 °C, the initial activity on both systems is similar and it decreases with the time on stream (TOS). For Cu/Ce the initial methanol conversion (97.3%) decreases in 25% after 389 min in time on stream. For Zn/Cu/Ce the initial conversion is 94% and decreases to 74.3% in the same TOS. The addition of Zn slightly improves the stability of catalyst. At 260 °C, the Zn free catalyst is more active being its initial conversion 87.6%. The conversion decreases to 63.5% after 6 h in reaction. For Zn/Cu/Ce the initial conversion is lower (66.4%) and decreases to 53.2%; the stability is improved and an important decrease in CO formation is observed. The selectivities to CO are 3.8 and 0.8% for Cu/Ce and Zn/Cu/Ce, respectively. Since the speciic surface areas are similar, the difference in the initial methanol conversion could be related to the difference in reducibility and dispersion. On Cu/Ce the Cu2+ reduction should be fast at 260 °C under reaction conditions (Figure 2) facilitating the SRM whereas a slower reduction should occur over Zn/Cu/Ce.
From the methanol conversion data and CO formation results, it could be inferred that ZnO does not exert any promoting effect on activity. However, the Zn presence is important to promote the water-gas shift reaction,32 to facilitate the ceria reduction (as was shown by TPR) and to improve the oxygen mobility (2 CeO2 + CO
→ CO2 + Ce2O3).
As regards to deactivation sintering, coke formation or changes in oxidation state could occur during SRM. The experiments of temperature programmed oxidation carried out by thermogravimetric analysis of samples after being used in SRM reveal a slight weight loss in particular for Zn/Cu/Ce catalyst, Figure 4. The carbon amount is higher on Cu/Ce catalyst in agreement with its larger loss activity. Two simultaneous phenomena occur during a TG experiment, weight gain due to copper and ceria oxidation and weight loss due to carbon deposit combustion. Therefore the carbon amount is dificut to be determined. From the TG curves, it could be concluded that these processes nearly occur in the same temperature range suggesting the Figure 1. Diffraction patterns of (a) CeO2, (b) fresh and (c )used Cu/Ce,
(d) fresh and (e) used Zn/Cu/Ce. ZnO; CeO2; CuO and Cuº. For
used samples in SRM, reaction temperature: 300 °C and W/FMeOH=1.94 10 3g
min mol-1
presence of the highly reactive carbon species. A complementary experiment was carried out to study carbon formation. After using the Cu/Ce catalyst at 300 and 260 °C, the methanol and water feed was interrupted and an O2/N2 low was allowed to enter into the catalytic bed previous purge with N2 low. The COx formation was followed by chromatography and the results are shown in Figure 5. After 100 min the formation of COx practically goes to zero for the catalyst operated in SRM at 260 °C. Actually the carbon deposits are very reactive since they could be removed by oxygen at 400 °C during the irst minutes. After this experiment the initial catalyst activity was almost recovered and after 400 min the methanol conversion decreases in 10% over regenerated catalyst. Then, part of deactivation could be related to carbon deposits. Activation- de-activation- regeneration studies are in progress.
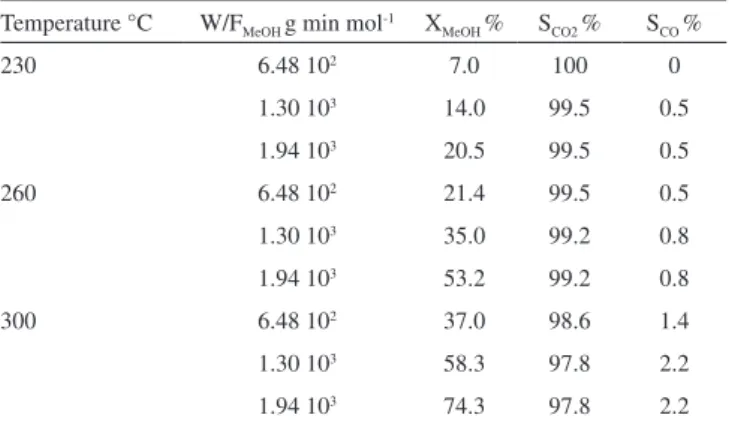
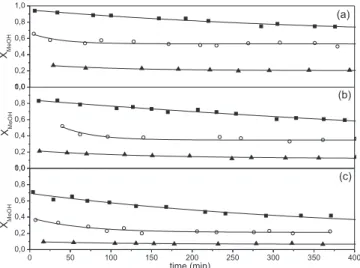
Taking into account that CO formation is lower over Zn/Cu/CeO2 sample, this catalytic system is investigated under different operation conditions. In Figure 6 methanol conversion as a function of time, at different W/FMeOH and temperatures is shown. At 230 and 260 °C, the conversion decreases during the irst 150 min to reach a steady
state value. However, a permanent deactivation is observed at 300 °C. Selectivities to CO2 and CO are shown in Table 3. CO selectivity is lower than 2.5% and the H2 selectivity is 100% in all experimental conditions. No by-product such as formaldehyde, methyl formate, di-methyl ether or methane is detected. The selectivity to CO at a constant W/FMeOH increases with methanol conversion and this conver-sion as expected increases with temperature. This behavior suggests that CO is a secondary product coming from reverse water gas shift reaction. A contribution from methanol decomposition at the higher temperature can not be ruled out.7,33
Different reaction mechanisms have been reported in literature which differ in the CO formation step: some of them consider that CO is a primary product formed from methanol decomposition (MD) followed by WGS;34 others suggest that CO is a secondary product formed from reverse WGS5,6 and those where the three reactions (SRM, WGS, MD) are included into the mechanism.35
In Figure 7, methanol conversion as a function of W/FMeOH is illustrated. The values at 300 °C correspond to 400 min in reaction. At 230 and 260 °C, the variation of conversion with W/FMeOH is almost lineal. From these data it is possible to determine an apparent activa-tion energy of 61 kJ mol-1. This value is near data in literature.6,35,36 Purnama et al.6 assuming a scheme of SRM and r-WGS reactions have reported Ea = 76 kJ mol-1 over a commercial CuO/ZnO/Al
2O3 catalyst; and Mastalir et al.35 have informed activation energy be-tween 109.2 and 60.7 kJ mol-1 depending on Cu/ZrO
2/CeO2 catalyst composition. These authors have assumed three reactions to describe the mechanism: SRM, r-WGS and MD.
Table 2. Catalytic results in SRM over Cu/Ce
Temperature °C Reaction time, min XMeOH % SCO2 % SCO %
260 7 87.6 96.9 3.1
370 63.5 96.2 3.8
300 8 97.3 92.0 8.0
389 73.1 93.6 6.4
W/FMeOH= 1.94 103 g min mol-1
Table 3. Catalytic results in SRM over Zn/Cu/Ce
Temperature °C W/FMeOH g min mol-1 XMeOH % SCO2 % SCO %
230 6.48 102 7.0 100 0
1.30 103 14.0 99.5 0.5
1.94 103 20.5 99.5 0.5
260 6.48 102 21.4 99.5 0.5
1.30 103 35.0 99.2 0.8
1.94 103 53.2 99.2 0.8
300 6.48 102 37.0 98.6 1.4
1.30 103 58.3 97.8 2.2
1.94 103 74.3 97.8 2.2
Figure 3.Methanol conversion as a function of time on stream for Cu/Ce (a) and Zn/Cu/Ce (b) catalysts. : 300 ºC and : 260 ºC
Figure 4.TG curves of temperature programmed oxidation for Cu/Ce (a) and Zn/Cu/Ce (b) catalysts used in methanol steam reforming at 300 °C
Figure 6. Methanol conversion as a function of time on stream for Zn/Cu/Ce catalyst at different temperature and (a) W/FMeOH= 1.9410
3, (b) W/F MeOH= 1.3
103 y (c) W/F
MeOH= 6.48 10
2 min g mol-1. : 300 ºC, : 260º C, and : 230 ºC
Figure 7. Methanol conversion against W/FMeOH at different temperatures. :
300 ºC, : 260 ºC, and : 230 ºC
CONCLUSIONS
Methanol steam reforming reaction was studied over Cu/CeO2 with and without the presence of Zn. The catalysts were examined at different contact times in the temperature range of 230- 300 °C. The only reaction products were H2 and CO2 with small amounts of CO. The CO was a secondary product. Its formation increased with reaction temperature and methanol conversion and it could be attributed to the reverse water gas shift reaction.
Cu/CeO2 was more active but less selective to CO2. The Zn addi-tion decreased the CO amounts being the CO selectivity lower than 2.5% at 300 °C. This behavior was attributed to Zn which promoted the water gas shift reaction and increased the oxygen mobility of ceria. For Zn/Cu/Ce catalyst, an apparent activation energy of 61 kJ mol-1 was estimated from catalytic results which was similar to other data for Cu-based catalysts reported in literature. The deactivation observed was partially related to carbon deposits.
ACKNOWLEDGMENTS
Financial supports are acknowledged to CONICET, ANPCyT and Universidad Nacional de San Luis.
REFERENCES
1. Choudhary, T. V.; Goodman, D. W.; Catal. Today 2002, 77, 65. 2. Son, I. H.; Lane, A. M.; Johnson, D. T.; J. Power Sources 2003, 124,
415.
3. Pettersson, L. J.; Westerholm, R.; Int. J. Hydrogen Energy 2001, 26, 243. 4. Lindström, B.; Pettersson, L. J.; Int. J. Hydrogen Energy 2001, 26, 923. 5. Agrell, J.; Birgersson, H.; Boutonnet, M.; J. Power Sources 2002, 106,
249.
6. Purnama, H.; Ressler, T.; Jentoft, R. E; Soerijanto, H.; Schlögl, R; Scho-6. Purnama, H.; Ressler, T.; Jentoft, R. E; Soerijanto, H.; Schlögl, R; Scho-Purnama, H.; Ressler, T.; Jentoft, R. E; Soerijanto, H.; Schlögl, R; Scho-mäcker, R.; App. Catal., A 2004, 259, 83.
7. Busca, G.; Costantino, U.; Marmottini, F.; Montanari, T.; Patrono, P.; Pinzari, F.; Ramis, G.; Appl. Catal., A 2006, 310, 70.
8. Turco, M.; Bagnasco, G.; Cammarano, C.; Senese, P.; Costantino, U.; Sisani, M.; Appl. Catal., B 2007, 77, 46.
9. Mastalir, Á.; Patzkó, Á.; Frank, B.; Schomäcker, R.; Ressler, T.; Schlögl, R.; Catal. Commun. 2007, 8, 1684.
10. Patel, S.; Pant, K. K.; Chem. Eng. Sci. 2007, 62, 5436.
11. Huang, G.; Liaw, B-J.; Jhang, C-J.; Chen, Y-Z.; Appl. Catal., A 2009, 358, 7.
12. Sa, S.; Silva, H.; Brandao, L.; Sousa, J. M.; Mendes, A.; Appl. Catal., B
2010, 99, 43.
13. Men, Y.; Gnaser, H.; Zapf, R.; Hessel, V.; Ziegler, C.; Kolb, G.; Appl. Catal., A 2004, 277, 83.
14. Liu, Y.; Hayakawa, T.; Tsunoda, T.; Suzuki, K.; Hamakawa, S.; Murata, K.; Shiozaki, R.; Ishii, T.; Kumagai, M.; Top. Catal. 2003, 22, 205. 15. Shiau, C.-Y.; Ma, M. W.; Chuang, C. S.; Appl. Catal., A 2006, 301, 89. 16. Marbán, G.; Fuertes, A. B.; Appl. Catal., B 2005, 57, 43.
17. Patel, S.; Pant, K. K.; Fuel Process. Technol. 2007, 88, 825. 18. Patel, S.; Pant, K. K.; J. Porous Mater. 2006, 13, 373.
19. Liu, Y.; Hayakawa, T.; Suzuki, K.; Hamakawa, S.; Tsunoda, T.; Ishii, T.; Kumagai, M.; Appl. Catal., A 2002, 223, 137.
20. Patel, S.; Pant, K. K.; J. Power Sources 2006, 159, 139.
21. Oguchi, H.; Nishiguchi, T.; Matsumoto, T.; Kanai, H.; Utani, K.; Matsumura, Y.; Imamura, S.; Appl. Catal., A 2005, 281, 69.
22. Tonelli, F.; Gorriz, O.; Arrúa, L.; Abello, M. C.; XVI Congreso Argentino de Catálisis, Buenos Aires, Argentina, 2009.
23. Tang, X.; Zhang, B.; Li, Y.; Xu, Y.; Xin, Q.; Shen, W.; Appl. Catal., A
2005, 288, 116.
24. Zheng, X.; Zhang, X.; Wang, X.; Wang, S.; Wu, S.; Appl. Catal., A 2005, 295, 142.
25. Ratnasamy, P.; Srinivas, D.; Satyanarayana, C.; Manikandan, P.; Senthil Kumaran, R.; Sachin, M.; Shetti, V.; J. Catal. 2004, 221, 455. 26. Avgouropoulos, G.; Ioannides, T.; Appl. Catal., B 2006, 67, 1. 27. Wu, Z.; Zhu, H.; Qin, Z.; Wang, H.; Ding, J.; Huang, L.; Wang, J.; Fuel
2010 doi:10.1016/j.fuel.2010.03.001
28. Markaryan, G. L.; Ikryannikova, L. N.; Muravieva, G. P.; Turukulova, A. O.; Kostyuk, B. G.; Lunina, E. V.; Lunin, V. V.; Zhilinskaya, E.; Aboukais, A.; Colloids Surf., A 1999, 151, 435.
29. Liang, Q.; Wu, X.; Weng, D.; Xu, H.; Catal. Today 2008, 139, 113. 30. Fierro, G.; Lo Jacono, M.; Inversi, M.; Porta, P.; Cioci, F.; Lavecchia,
R.; Appl. Catal., A 1996, 137, 327.
31. Matsumura, Y.; Ishibe, H.; J. Catal. 2009, 268, 282.
32. Saito, M.; Wu, J.; Tomoda, K.; Takahara, I.; Murata, K.; Catal. Lett.
2002, 83, 1.
33. Peters, R.; Düsterwald, H. G.; Höhlein, B.; J. Power Sources 2000, 86, 507.
34. Peppley, B. A.; Amphlett, J. C.; Kearns, L. M.; Mann, R. F.; Appl. Catal., A 1999, 179, 21.
35. Mastalir, A.; Frank, B.; Szizybalski, A.; Soerijantoa, H.; Deshpande, A.; Niederberger, M.; Schomäcker, R.; Schlögl, R.; Ressler, T.; J. Catal.
2005, 230, 464.