Educação
*e-mail: [email protected]
AN UNDERGRADUATE LEVEL EXPERIMENT ON THE SYNTHESIS OF Au NANOPARTICLES AND THEIR SIZE-DEPENDENT OPTICAL AND CATALYTIC PROPERTIES
Anderson G. M. da Silva, Thenner S. Rodrigues, Alexandra Macedo, Rafael T. P. da Silva and Pedro H. C. Camargo* Departamento de Química Fundamental, Instituto de Química, Universidade de São Paulo, Av. Prof. Lineu Prestes, 748, 05508-000 São Paulo – SP, Brasil
Recebido em 09/04/2014; aceito em 04/07/2014; publicado na web em 27/08/2014
The synthesis of gold nanoparticles (Au NPs) 15, 26, and 34 nm in diameter, followed by the investigation of their size-dependent optical and catalytic properties, is described herein as an undergraduate level experiment. The proposed experiment covers concepts on the synthesis, stabilization, and characterization of Au NPs, their size-dependent optical and catalytic properties at the nanoscale, chemical kinetics, and the role of a catalyst. The experiment should be performed by groups of two or three students in three lab sessions of 3 h each and organized as follows: i) synthesis of Au NPs of different sizes and investigation of their optical properties; ii) evaluation of their catalytic activity; and iii) data analysis and discussion. We believe that this activity enables students to integrate these multidisciplinary concepts in a single experiment as well as to become introduced/familiarized with an active research field and current literature in the areas of nanoparticle synthesis and catalysis.
Keywords: laboratory experiment; undergraduate level; gold nanoparticles; catalysis; size-dependent properties.
INTRODUCTION
Nanoscience encompasses the study and manipulation of nano-materials, which display feature sizes of < 100 nm in at least one dimension.1 Among nanomaterials, metals are particularly interesting due to their unique optical, chemical, and electronic properties that allow applications in areas such as plasmonics, catalysis, biomedicine, information storage, and sensing.2,3
The optical and catalytic behavior of gold nanoparticles (Au NPs) relative to the bulk element represents a remarkable example of how properties change as we move from the macroscopic to the nanoscopic dimension.3 While the optical properties of Au NPs in the visible range have been exploited for centuries (such as in stained glass windows and the Lycurgus cup), the demonstration of their catalytic activity towards CO oxidation in 19874 represented a milestone in the field of nanocatalysis, followed by a burst on the utilization of Au NPs as catalysts for a wide range of transformations.5
The catalytic activity of Au NPs is largely due to the increase in the particles surface-to-volume ratio.6 On the other hand, the unique optical properties of Au NPs arise from the interaction of their free electrons with light, in which the oscillating electric field component from the incoming electromagnetic wave drives the free electrons in the metal into collective oscillations, which is the surface plasmon resonance (SPR) excitation.7-8 The SPR excitation leads to adsorption and scattering of the incident electromagnetic wave close to the reso-nance frequency (in the far field) as well as the generation of intense electromagnetic fields close to the surface of the nanostructure (in the near field).9,10
It has been established that many properties (including optical and catalytic) in metal NPs are dependent upon several physical and chemical parameters that include size, shape, composition, and structure (solid or hollow interiors).11 Thus, the understanding on how properties vary as a function of these parameters is crucial to optimize performance and enable new applications.
Although undergraduate level laboratory experiments have been proposed on the synthesis of metal nanoparticles and investigation of
their optical and/or catalytic properties,12-21 activities in which students can establish a correlation between size and observed properties remain limited. Here, we present an undergraduate level experiment in which the students synthesize Au NPs having three different siz-es, followed by an investigation on how their optical and catalytic properties change as a function of size. Specifically, the proposed experiment consists of three main parts. In the first, students perform the synthesis of three Au NPs samples having increasingly bigger sizes by a seeded growth approach. In the second, students qualitatively and quantitatively investigate the variations in the optical properties due to the formations of Au NPs and also as a function of their size (by both visual inspection and UV-VIS spectroscopy). In the third, students employ the hydrogenation of 4-nitrophenol by sodium borohydride as a model reaction to investigate the size-dependent catalytic activity of the synthesized Au NPs.22 This activity should be performed by groups of two or three students in three lab sessions of 3 h each. The first, second and third lab sessions should be organized as follows: i) the synthesis of Au NPs having different sizes and investigation of their optical properties; ii) evaluation of the catalytic activity; and iii) data analysis and discussion. This experiment covers concepts on the synthesis, stabilization, and characterization of Au NPs, their size-dependent optical and catalytic properties at the nanoscale, chemical kinetics, and the role of catalyst.
Experimental overview
Full experimental details regarding the synthesis of Au NPs having different sizes, the investigation of their optical properties and catalytic activity are given in the student guide. In summary, the synthesis of aqueous suspensions containing Au NPs 15 ± 2.2, 26 ± 2.4, and 34 ± 3.0 nm in diameter was performed by a seeded growth approach.23 The change in optical properties due to the formation of Au NPs as compared to the AuCl4
- precursor solution and the bulk metal should be first detected by visualizing the change in color for the suspension containing the Au NPs relative to the solution containing the AuCl4
as the size of the Au NPs increases. In order to quantify the change in optical properties due to the formation of Au NPs and also their dependence on size, UV-VIS spectra in the 300-800 nm range were obtained from an aqueous solution containing the AuCl4
- precursor and also from aqueous suspensions containing the Au NPs. The catalytic activities as a function of Au NPs size was investigated employing the hydrogenation of 4-nitrophenol to 4-aminophenol as a model reaction. In this case, the reaction kinetics was monitored by UV-VIS spectroscopy in the 350 to 500 nm range,24,25 in which the variations in the absorbance at 400 nm were monitored as a function of time. The same concentration of Au was employed in all cases. Hazards
Chloroauric acid trihydrate is corrosive and hygroscopic. It can cause eyes and skin burns upon contact. It also causes gastrointestinal tract burns if swallowed and burns to the respiratory tract by inhalation. Sodium citrate may cause irritation to skin, eyes, and respiratory tract. Sodium borohydride is flammable and toxic. It is also a strong reducing agent, is corrosive, and may cause burns to any area of contact. 4-ni-trophenol is poisonous via inhalation, swallowing, and contact with the skin. The experiment described in this work uses dilute solutions, which may be prepared ahead of time to minimize the risk that the solids and concentrated solutions pose to students. Labeled waste containers should be made available. Gloves, lab coat, and safety glasses should be worn throughout the experiment. All laboratory exercises should be carried out under the supervision of trained and qualified personnel. Student learning objectives
The key learning objectives of this multidisciplinary experiment are: i) synthesis of metal nanoparticles with controlled sizes; ii) stabilization of nanoparticles; iii) introduce the concept of surface plasmon resonance to describe the unique optical properties of Au NPs in the visible range, which gives a visual example on the change in properties in nanoscaled systems relative to their macroscopic counterparts; iv) chemical kinetics (pseudo-first-order rate laws, role of catalyst, calculation of rate constants and turnover frequencies); and v) investigation of Au NPs optical properties and catalytic activities as a function of size.
RESULTS AND DISCUSSION
Part 1 - Synthesis of Au NPs and size-dependent optical properties
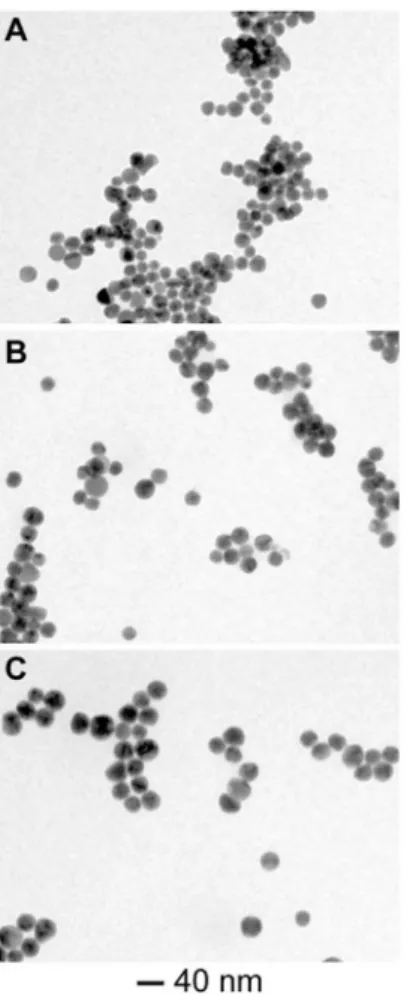
Figure 1A-C shows TEM images for the Au NPs samples obtained after the three stages of growth. First, Au NPs seeds were obtained by the reduction of AuCl4
-(aq) in the presence of citrate,
23 as depicted in Figure 1A. Then, they served as physical templates for further Au growth by producing Au NPs that are larger in diameter relative to the Au NPs seeds (Figure 1B). Similarly, a second deposition step was carried out employing the Au NPs obtained after the first deposition step as seeds for further growth (Figure 1C). As shown in the TEM images (Figure 1A-C), the diameter of the Au NPs corresponded to 15 ± 2.2, 26 ± 2.4, and 34 ± 3.0 nm for the Au NPs seeds, Au NPs after the first deposition step and, Au NPs after the second deposition step, respectively. This result indicates that the described approach was effective to produce Au NPs with well-controlled sizes. It is important to note that, in all cases, the Au NPs were spherical and relatively monodisperse.
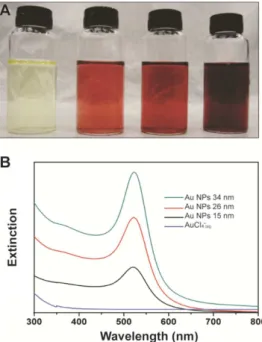
Figure 2A shows digital photographs from the starting AuCl4
-(aq) solution (shown on the left) and aqueous suspensions containing Au
NPs 15 ± 2.2, 26 ± 2.4, and 34 ± 3.0 nm in diameter (shown from left to right, respectively). The red color displayed by the suspensions containing Au NPs (while the solution containing AuCl4
-was light yellow) illustrate the change in optical properties due to the formation of Au NPs. The vivid color difference between bulk and nanosized Au NPs makes the SPR excitation easy to measure and visually appealing to undergraduate students. It can also be visualized that the Au NPs suspension became gradually darker as their size was increased. The UV-VIS extinction spectra are in agreement with these observations (Figure 2B). While the starting AuCl4
-(aq) solution did not display any detected signals in the visible range in the employed concentration range, all Au NPs displayed a relatively broad band centered at 522 nm. This band is assigned to the dipole mode of the localized surface plasmon resonance (LSPR) excitation in Au NPs.23 The LSPR band became more intense with size as expected from the increased contri-bution from scattering to the extinction.16 Therefore, both the digital photographs and UV-VIS spectra could be employed to illustrate the size-dependent optical properties of Au NPs.
As the described synthesis procedures are reproducible, only one set of samples (from one group, for example) can be submitted to TEM analysis so that the entire class can use the same TEM results. This can be performed from one week to another and be provided to the students for the second part of the experiment. In addition to TEM, the students can also calculate the NPs size from the UV-VIS extinction spectra according to the following equation:
d = ln[(λ – 512)/6.53]/0.0216 (1)
where d is the diameter and λ the SPR wavelength.26 Indeed, the
results calculated from this equation agreed with those obtained from the TEM results (d = 14.8, 24.1, and 31.8 nm for Au NPs 15 ± 2.2, 26 ± 2.4, and 34 ± 3.0 nm, respectively).
Part 2 and 3 - Size-dependent catalytic activities and data analysis
The catalytic activities of Au NPs were evaluated employing the reduction of 4-nitrophenol by sodium borohydrideas a model reac-tion. The hydrogenation of 4-nitrophenol was chosen due to several factors: i) it is well-established that it can be catalyzed by noble metal nanoparticles due to the particle-mediated electron transfer from borohydride ions to 4-nitrophenol;24,25,27,28 ii) the product from this transformation, 4-aminophenol, is an important intermediate in the synthesis of analgesic and antipyretic drugs;29 iii) wastewaters gener-ated from several industries (such as explosives and dyestuffs) contain 4-nitrophenol;30 and iv) the color changes associated with the conversion of 4-nitrophenol to 4-aminophenol enables one to easily monitor the reaction kinetics by UV-VIS spectroscopy,25,27-29 Here, an excess of sodium borohydride was employed so that 4-nitrophenol is converted to 4-nitrophenolate ions, as shown in Figure 3A (the concentration of sodium borohydride was 2000 folds higher relative to 4-nitrophenol). This transformation is accompanied by a change in color from pale yellow to dark yellow as well as a shift in the absorbance peak from 317 nm (for 4-nitrophenol) to 400 nm (for 4-nitrophenolate ions) in the UV-VIS spectra (Figure 3B). Under this condition, the reaction kinetics approaches the pseudo-first-order regime, in which the vari-ation in the concentrvari-ation of sodium borohydride during the reaction becomes negligible. Thus, the decrease in the absorbance for the band at 400 nm can be employed to monitor the reaction kinetics (extent of the reaction) and the rate constants can be estimated from the slope of the linear correlation between ln(Ct/C0) and time according to the following equation, which represents the pseudo-first-order rate law:
ln(At/A0) = -k·t (2)
where At correspond to the absorbance at 400 nm as a function of the time t; A0 the initial absorbance, and k the rate constant. The pseudo-first-order rate law can be expressed as:
d[C]/dt = k[C] (3)
where C is the concentration, and integrated to give:
ln(Ct/C0) = -kt (4)
As the Beer-Lambert law gives:
A = εbC (5)
where ε is the molar absorptivity of the substance and b the optical
path, Equation 2 is then obtained by replacing 5 into 4.
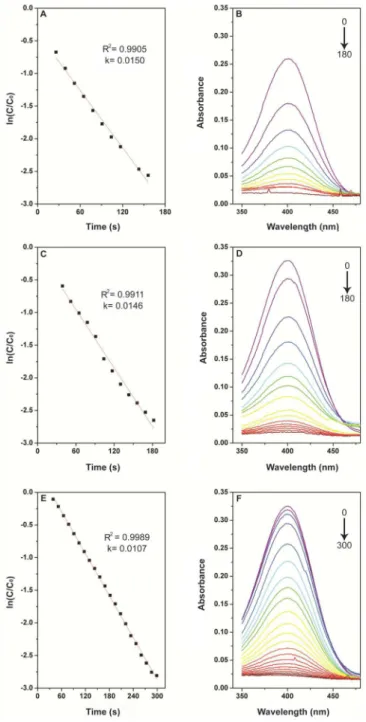
Figure 4 shows the plots of ln(Ct/C0) and the UV-VIS absorption spectra as a function of time for the Au NPs that were 15 ± 2.2 (Figure 4A and B), 26 ± 2.4 (Figure 4C and D), and 34 ± 3.0 nm in diameter (Figure 4E and F). As all catalytic investigations were performed employing the same concentration of Au, and the differences in catalytic activity can be associated with the variations in size and thus available surface area for catalysis. In all cases, the decrease in the intensity of the band at 400 nm with time was observed due to the consumption of 4-nitrophenolate ions. It can be detected that the disappearance of the band at 400 nm became slower as the Au NPs size increased, in agreement with the decrease in catalytic activity
Figure 2. (A)Digital photographs of the AuCl4
-(aq) solution and aqueous suspensions containing Au NPs 15 ± 2.2, 26 ± 2.4, and 34 ± 3.0 nm in dia-meter (shown from left to right, respectively). (B)UV-VIS extinction spectra recorded for the AuCl4
-(aq) solution and aqueous suspensions containing Au NPs 15 ± 2.2, 26 ± 2.4, and 34 ± 3.0 nm in diameter (blue, black, red, and green traces, respectively)
with size. The calculated rate constants (k) decreased as the Au NPs size increased, and corresponded to 0.0150 ± 0.0008, 0.0146 ± 0.0012, and 0.0107 ± 0.0010 s-1 for Au NPs 15 ± 2.2, 26 ± 2.4, and 34 ± 3.0 nm in diameter, respectively. Interestingly, the decrease in the catalytic activity as the size increased from 15 to 26 nm was less pronounced as compared to the decrease in catalytic activity as the size increased from 26 to 34 nm. It is noteworthy that no changes in the 400 nm band intensity were observed under similar conditions in the absence of Au NPs, indicating that the presence of the catalyst is essential for the reaction to take place in this timeframe (no reaction occurs in the absence of catalyst under similar conditions).
Another parameter that can be employed to describe the catalytic activity of Au NPs is the TOF (turnover frequency). The TOF can be defined as the number of completed catalytic cycles per atom of
the catalyst as a function of time.31 Here, the TOF was calculated according to the equation 2:
TOF = N4NP/(NAu·t) (2)
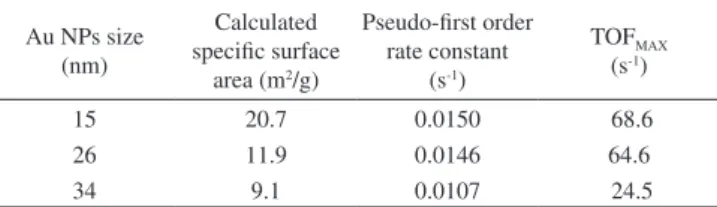
where N4NP denotes the amount in mols of 4-nitrophenol converted to 4-aminophenol, NAu the amount in mols of Au, and t the time. N4NP was calculated from a UV-VIS calibration curve for 4-nitrophenolate concentration as depicted in Figure 5A. Figure 5B shows the calcu-lated TOF as a function of time for Au NPs. TOF values decreased with the increase in the Au NPs size, in agreement with the decrease in catalytic activity with size. In this case, while a slight decrease in the TOF values was observed as the Au NPs size increased from 15 to 26 nm, TOFs for Au NPs 34 nm in diameter were notably smaller. While Au NPs 15 and 26 nm in diameter reached the maximum TOF (TOFMAX) at ~ 26 s, this value corresponded to 91 s for Au NPs 34 nm in size. Table 1 summarizes the catalytic activities estimated as a function of Au NPs size and specific surface area. The specific surface area (S) was calculated according to the equation 3:
S = 3/(RAu·dAu) (3)
where R corresponds to the Au NPs radius, and dAu to the density of gold (19.32 × 10⁶ g/m3). Because in the proposed laboratory experi-ment we wanted to demonstrate students how the catalytic activity is dependent upon the size of metal nanoparticle catalysts, we believe
Figure 4. Plots of ln(C/C0) and UV-VIS spectra recorded as a function of time at room temperature for Au NPs 15 ± 2 (A and B), 26 ± 2 (C and D), and 34 ± 3 nm in diameter (E and F). The rate constants (k) were calculated from the slope of the curves shown in red in (A), (C), and (E)
this concept can be more easily visualized/illustrated by calculating the turnover frequency as a function of the Au concentration. In this case, as the diameter of the Au NPs increased, the surface area and thus the catalytic activity decreased (as expressed by the TOF and pseudo-first order rate constants).
It is important to note that students are encouraged to experiment with Au NPs of all size regimes. While the rate constants were sim-ilar for Au NPs 15 and 26 nm in size, a decrease was still observed. Moreover, it is worth showing students that the rate constants do not simply decrease linearly as the Au NPs size increases. Finally, there is a noticeable change in optical properties as Au NPs size increase from 15 to 26 nm.
CONCLUSIONS
We proposed herein an undergraduate level activity that consists on three main parts, involving the synthesis of Au NPs of controllable sizes followed by the investigation of their size-dependent optical properties and catalytic activity. In the first part of the activity, stu-dents perform the synthesis of three Au NPs samples having different (increasingly bigger) sizes by a seeded growth approach. In this case, spherical Au NPs 15 ± 2, 26 ± 2, and 34 ± 3 nm in diameter were obtained. In the second part of this activity, students qualitatively and quantitatively investigate the variations in the optical properties due to the formations of Au NPs and also as a function of their size (by both visual inspection and UV-VIS spectroscopy). In the last part of the experiment, students employ the reduction of 4-nitrophenol by sodium borohydride as a model reaction to investigate the size-de-pendent catalytic activity of the synthesized Au NPs suspensions. The reduction of 4-nitrophenol to 4-aminophenol can be monitored by the decrease in the absorbance at 400 nm (assigned to 4-nitrophenolate ions) in the UV-VIS spectrum as a function of time, and the rate constants can be calculated by a pseudo-first-order rate law. This experiment encompasses concepts on the synthesis, stabilization, and characterization of Au NPs, their unique size-dependent optical properties and catalytic activities, the role of catalyst, and chemical kinetics. This provides students the opportunity to integrate these multidisciplinary concepts in a single activity and to get introduced/ familiarized with an active research field and current literature in the areas of nanoparticle synthesis and catalysis.
SUPPLEMENTARY MATERIAL
Student guide manual containing full experimental procedures and instructor notes. This material is available via the internet at http://quimicanova.sbq.org.br/ with free access.
Table 1. Calculated specific surface areas, rate constants, and turnover fre-quencies for Au NPs as a function of size
Au NPs size (nm)
Calculated specific surface
area (m2/g)
Pseudo-first order rate constant
(s-1)
TOFMAX
(s-1)
15 20.7 0.0150 68.6
26 11.9 0.0146 64.6
34 9.1 0.0107 24.5
ACKNOWLEDGEMENTS
This work was supported by FAPESP (grant number 2013/19861-6), CNPq (grant numer 471245/2012-7), and start-up funds from Universidade de São Paulo (grant numbers 11.1.25042.1.0 and 2012-145). A.G.M.S., A.M., and R.T.P.S thank the CNPq for the fellowships. T.S.R. thanks CAPES for the fellowship. P.H.C.C. thanks the CNPq for the research fellowship.
REFERENCES
1. Rao, C. N. R.; Vivekchand, S. R. C.; Biswasa, K.; Govindaraj, A; Dalton Trans. 2007, 34, 3728.
2. Daniel, M.-C.; Astruc, D.; Chem. Rev. 2004, 104, 293.
3. Chorkendorff, I.; Niemantsverdriet, J. W.; Concepts of Modern Catalysis and Kinetics, 2nd ed., Wiley: New York, 2007.
4. Link, S.; Ei-Sayed, M. A.; Annu. Rev. Phys. Chem. 2003, 54, 331. 5. Haruta, M.; Kobayashi, T.; Sano, H.; Yamanda, N.; Chem. Lett. 1987, 4,
405.
6. Corma, A.; Garcia, H.; Chem. Soc. Rev. 2008, 37, 2096. 7. Haruta, M.; Daté, M.; Appl. Catal., A 2001, 222, 427.
8. Kelly, K. L.; Coronado, E.; Zhao, L. L.; Schatz, G. C.; J. Phys. Chem. B 2003, 107, 668.
9. Campbell, D. J.; Xia, Y. N.; J. Chem. Educ. 2007, 84, 91.
10. Morton, S. M.; Silverstein, D. W.; Jensen, L.; Chem. Rev. 2011, 111, 3962.
11. Stiles, P. L.; Dieringer, J. A.; Shah, N. C.; Van Duyne, R. R.; Annu. Rev. Anal. Chem. 2008, 1, 601.
12. Xia, Y.; Xiong, Y.; Lim, B.; Skrabalak, S. E.; Angew. Chem. Int. Ed. 2009, 48, 872.
13. Sharma, R. K.; Gulati, S.; Mehta, S.; J. Chem. Educ. 2012, 89, 1316. 14. Dungey, K. E.; Muller, D. P.; Gunter, T.; J. Chem. Educ. 2005, 82, 769. 15. Sereda, G.; Rajpara, V.; J. Chem. Educ., 2010, 87, 978.
16. Feng, Z. V.; Lyon, J. L.; Croley, J. S.; Crooks, R. M.; Bout, D. A. V.; Stevenson, K. J.; J. Chem. Educ. 2009, 86, 368.
17. McFarland , A. D.; Haynes, C. L.; Mirkin, C. A.; Duyne, R. P. V.; Godwin, H. A.; J. Chem. Educ. 2004, 81, 544A.
18. Mulfinger, L.; Solomon, S. D.; Bahadory, M.; Jeyarajasingam, A. V.; Rutkowsky, S. A.; Boritz, C.; J. Chem. Educ. 2007, 84, 322.
19. Sharma, R. K.; Gulati, S.; Mehta, S.; J. Chem. Educ. 2012, 89, 1316. 20. Sereda, G.; Rajpara, V.; J. Chem. Educ. 2010, 87, 978.
21. Frank, A. J.; Cathcart, N.; Maly, K. E.; Kitaev, V.; J. Chem. Educ. 2010, 87, 1098.
22. Herrera-Melián, J. A.; Doña-Rodríguez, J. M.; Rendón, E. T.; Vila , A. S.; Quetglas, M.B.; Azcárate, A. A.; Pariente, L. P.; J. Chem. Educ. 2001, 78, 775.
23. Bast, N. G.; Comenge, J.; Puntes, V.; Langmuir 2011, 27, 11098. 24. Ge, J. P.; Huynh, T.; Hu, Y. P.; Yin, Y. D.; Nano Lett. 2008, 8, 931. 25. Lu, Y.; Mei, Y.; Drechsler, M.; Ballauff, M.; Angew. Chem. Int. Ed. 2006,
45, 813.
26. Haiss, W.; Thanh, N. T. K.; Aveyard, J.; Fernig D. G.; Spectra Anal. Chem. 2007, 79, 4215.
27. Petri, M. V.; Ando, R. A.; Camargo, P. H. C.; Chem. Phys. Lett. 2012, 531, 188.
28. Schrinner, M.; Ballauff, M.; Talmon, Y.; Kauffmann, Y.; Thun, J.; Moller, M.; Breu, J.; Science 2009, 323, 617.
29. Damato, T. C.; Oliveira, C. C. S.; Ando, R. A.; Camargo, P. H. C.; Langmuir 2013, 29, 1642.
Supplementary Material
*e-mail: [email protected]
AN UNDERGRADUATE LEVEL EXPERIMENT ON THE SYNTHESIS OF Au NANOPARTICLES AND THEIR SIZE-DEPENDENT OPTICAL AND CATALYTIC PROPERTIES
Anderson G. M. da Silva, Thenner S. Rodrigues, Alexandra Macedo, Rafael T. P. da Silva and Pedro H. C. Camargo* Departamento de Química Fundamental, Instituto de Química, Universidade de São Paulo, Av. Prof. Lineu Prestes, 748, 05508-000 São Paulo – SP, Brasil
INSTRUCTOR NOTES Hazards
Chloroauric acid trihydrate is corrosive and hygroscopic. It can cause eyes and skin burns upon contact. It also causes gastrointestinal tract burns if swallowed and burns to the respiratory tract by inhala-tion. Sodium citrate may cause irritation to skin, eyes, and respiratory tract. Sodium borohydride is flammable and toxic. It is also a strong reducing agent, is corrosive, and may cause burns to any area of contact. 4-nitrophenol is poisonous via inhalation, swallowing, and contact with the skin. This experiment uses dilute solutions, which may be prepared ahead of time to minimize the risk that the solids and concentrated solutions pose to students. Labeled waste containers should be made available. Gloves, lab coat, and safety glasses should be worn throughout the experiment. All laboratory exercises should be carried out under the supervision of trained and qualified personnel.
Synthesis of Au NPs with controlled sizes
In order to minimize the synthesis time of Au NPs with different sizes, students should be encouraged to perform three independent/ parallel reactions, one for each desired Au NPs size (seed, first and second deposition steps).
Optical properties
Students should be encourage to take digital photographs of the suspensions containing the Au NPs of different sizes as well as from
the initial AuCl4
–
(aq) solution to use in the lab report. Students will be
provided with TEM images of the obtained Au NPs in the second lab session in order to describe/interpret the variations in optical properties and catalytic activity.
Study of catalytic activities: 4-nitrophenol hydrogenation reaction
It should be emphasized that 4-nitrophenol is converted to 4-nitrophenolate ions in the presence of an excess of sodium boro-hydride. Students should calculate the amount (in mols) of sodium borohydride and 4-nitrophenol employed in the catalytic reaction. This transformation is accompanied by a change in color from pale yellow to dark yellow as well as a shift in the absorbance peak from 317 nm (for 4-nitrophenol) to 400 nm (for 4-nitrophenolate ions) in the UV-VIS spectra. Under this condition, the reaction kinetics approaches the pseudo-first-order regime, in which the variation in the concentration of sodium borohydride during the reaction becomes negligible. Thus, the decrease in the absorbance for the band at 400 nm can be employed to monitor the reaction kinetics (extent of the reaction) and the rate constants can be estimated from the slope of
the linear correlation between ln(Ct/C0) and time
ac-cording to the following equation, which represents the pseudo-first-order rate law:
ln(Ct/C0) = -k·t (1)
where Ct correspond to the absorbance at 400 nm as a
function of the time t; C0 the initial absorbance, and k
the rate constant. Students should be able to conclude that the dis-appearance of the band at 400 nm will be slower as the Au NPs size increased, in agreement with the decrease in catalytic activity with size. The role of the catalyst should be emphasized by the observation of no changes in the 400 nm band intensity in the absence of Au NPs, indicating that the presence of the catalyst is essential for the reaction to take place in this timeframe (no reaction occurs in the absence of catalyst under similar conditions).
Lab report
The reportshould follow the format of a scientific paper,
com-prising an introduction, experimental, results and discussion, and conclusion sections. All answers to the lab questions should be in-cluded in the discussion session. All calculations and graphs should also be presented.
Answers to lab questions
1.Au NPs are produced as opposed to the bulk element due to
the presence of citrate that acts both as a reducing agent and stabi-lizer at the Au surface to prevent aggregation. More specifically, the adsorbed anionic citrate layer induces the electrostatic repulsion among neighboring nanoparticles in suspension, preventing them from aggregating. The bulk element would be expected to be more thermodynamically stable due to its lower surface energy relative to the nanoparticles.
2. Surface Plasmon Resonance Phenomenon:
(adapted from P. L. Stiles, J. A. Dieringer, N. C. Shah, R. R. Van
Duyne, Annu. Rev. Anal. Chem.2008, 1, 601).
SPR resonance may also be observed for Au NPs as their diameters increase. Larger nanoparticles enable higher charge separation during plasmon oscillation, thus reducing the restoring force for electron oscillation, which manifests itself in a red-shift of the resonance peak.
Figure 2B presents the UV-VIS spectra recorded from the AuCl4
-(aq) and Au NPs suspensions in a single plot.
3. Under an excess of sodium borohydride (the concentration of sodium borohydride was 2000 folds higher relative to 4-nitrophenol), the reaction kinetics approaches the pseudo-first-order regime, in which the variation in the concentration of sodium borohydride dur-ing the reaction becomes negligible.
4. Upon the addition of sodium borohydride, 4-nitrophenol is con-verted to 4-nitrophenolate ions, that display a strong adsorption peak at 400 nm in the UV-VIS spectra. The decrease in the concentration of 4-nitrophenolate species due to the conversion of 4-nitrophenolate to 4-aminophenol can be estimated by monitoring the intensity of the band at 400 nm. Thus, decrease in the absorbance for the band at 400 nm can be employed to monitor the reaction kinetics (extent of the reaction) and the rate constants can be estimated from the slope
of the linear correlation between ln(Ct/C0) and time according to the
following equation, which represents the pseudo-first-order rate law:
ln(Ct/C0) = -k·t (1)
where Ct correspond to the absorbance at 400 nm as a function of
the time t; C0 the initial absorbance, and k the rate constant. Figure 4
shows the plots of ln(Ct/C0) and the UV-VIS absorption spectra as a
function of time for the Au NPs. The TOF can be calculated according to the following equation:
TOF = N4NP/(NAu·t) (2)
where N4NP denotes the amount in mols of 4-nitrophenol converted to
4-aminophenol, NAu the amount in mols of Au, and t the time. N4NP
was calculated from a UV-VIS calibration curve for 4-nitrophenolate concentration. Figure 5B shows the calculated TOF as a function of time for Au NPs.
5. A catalyst refers to a substance that alters the rate of a reaction (generally accelerates), is not consumed during the reaction, and it does not appear in any of its products. A catalyst provides a new pathway for a reaction. If this pathway has lower activation energy than its uncatalysed counterpart, the reaction rate is increased. When the hydrogenation of 4-nitrophenol was performed in the absence of Au NPs, no conversion of 4-nitrophenol was observed (no changes in color were detected).
6.
S = 3/(RAu·dAu)
dAu = 19.32×10
6 g/m3 R1
Au = 15 nm, R2Au = 26 nm, R2Au = 34 nm
S1 = 20.7 m2/g
S2 = 11.9 m2/g
S3 = 9.1 m2/g
Under the same concentration of Au, as the diameter of the Au NPs increases, the surface area and thus the catalytic activity decrease (as expressed by the TOF and pseudo-first order rate constants).
STUDENT GUIDE Introduction
The optical and catalytic behavior of gold nanoparticles (Au NPs) relative to the bulk element represents a remarkable example of how properties change as we move from the macroscopic to the nanoscopic dimension. While the catalytic activity of Au NPs is largely due to the increase in the particles surface-to-volume ratio, the unique optical properties of Au NPs arise from the interaction of their free electrons with light, in which the oscillating electric field component from the incoming electromagnetic wave drives the free electrons in the metal into collective oscillations, which is the surface
plasmon resonance (SPR) excitation1-2.
It has been established that many properties (including optical and catalytic) in metal NPs are dependent upon several physical and chemical parameters that include size, shape, composition, and
structure (solid or hollow interiors)3. Thus, the understanding on how
properties vary as a function of these parameters is crucial to optimize performance and enable new applications. In this experiment, you will synthesize Au NPs having three different sizes, followed by an investigation on how their optical and catalytic properties change as a function of size. Specifically, the experiment consists of three main parts. In the first, you will perform the synthesis of three Au NPs sam-ples having increasingly bigger sizes by a seeded growth approach. In the second, you qualitatively and quantitatively investigate the variations in the optical properties due to the formations of Au NPs and also as a function of their size (by both visual inspection and UV-VIS spectroscopy). In the third, you will employ the hydrogena-tion of 4-nitrophenol by sodium borohydride as a model reachydrogena-tion to investigate the size-dependent catalytic activity of the synthesized Au NPs. You should work as groups of two or three students in three lab sessions of 3 h each. The first, second and third lab sessions should
be organized as follows: i) the synthesis of Au NPs having different
sizes and investigation of their optical properties; ii) evaluation of the
catalytic activity; and iii) data analysis and discussion.
Materials and instrumentation
Analytical grade chemicals gold(III) chloride trihydrate (HAuCl4,
99% - Sigma-Aldrich), trisodium citrate dehydrate (C6H5Na3O7·2H2O,
>99% - Synth), 4-nitrophenol (C6H5NO3, 98% - Merk), and sodium
borohydride (NaBH4, 95% - Vetec) will used as received. All solutions
were prepared using deionized water (18.2 MΩ). UV-VIS spectra will
obtained from aqueous solutions or aqueous suspensions containing the nanostructures with a Shimadzu UV-1700 spectrophotometer. Transmission electron microscopy (TEM) images were obtained with a JEOL 1010 microscope at 80 kV. The samples for TEM were prepared by drop-casting aqueous suspensions containing the nanoparticles over a carbon-coated copper grid, followed by drying under ambient conditions.
Hazards
the risk that the solids and concentrated solutions pose to students. Labeled waste containers should be made available. Gloves, lab coat, and safety glasses should be worn throughout the experiment. All laboratory exercises should be carried out under the supervision of trained and qualified personnel.
Synthesis of Au NPs with controlled sizes
The synthesis of Au NPs should be performed by a seeded growth
approach4. In the first step, Au NPs can be prepared by adding 150
mL of a 2.2 mmol L-1 sodium citrate aqueous solution to a 250 mL
round-bottom flask under magnetic stirring. This system should
be heated to 100 °C for 15 minutes. Then, 1 mL of a 25 mmol L-1
AuCl4
-(aq) solution should be added, and the reaction mixture kept at
100 °C under vigorous stirring for another 30 minutes. This proce-dure yields an aqueous suspension containing the Au NPs, which will be employed as seeds for the synthesis of Au NPs having larger sizes by successive Au deposition steps. For the first deposition step,
add 1 mL of a 60 mmol L-1 sodium citrate solution to same 250 mL
round-bottom flask containing the Au NPs seeds under magnetic
stirring at 100 °C. After 5 min, add 1 mL of a 25 mmol L-1 AuCl
4
-(aq) solution to the reaction mixture containing the Au NPs seeds and keep the reaction mixture at 100 °C for another 30 min. This will produce a suspension containing the Au NPs (first deposition step). Similarly, a second deposition step should be performed by adding another 1
mL of a 60 mmol L-1 sodium citrate solution and 1 mL of a 25 mmol
L-1 AuCl
4
-(aq) solution to the reaction mixture obtained after the first
deposition step, in which the Au NPs produced after the first depo-sition step serve as seeds for further growth. In these reactions, each Au NPs sample could be isolated by stopping the reaction at the end of each corresponding reduction/deposition step. In order to minimize the synthesis time of Au NPs with different sizes, it is recommended to perform three independent/parallel reactions, one for each desired Au NPs size (seed, first and second deposition steps). The average diameters of the Au NPs were determined by individually measuring the width of 20 nanoparticles from the TEM images.
Optical properties
The change on optical properties due to the formation of Au NPs
as compared to the AuCl4
- precursor solution and the bulk metal should
be first detected by visualizing the change in color for the suspension
containing the Au NPs relative to the solution containing the AuCl4
-precursor. Furthermore, the size dependent optical properties of the Au NPs can be directly visualized as the change in color of the Au NPs suspensions. In order to quantify the change in optical proper-ties due to the formation of Au NPs and also their dependence on size, UV-VIS spectra should be measured from an aqueous solution
containing the AuCl4
- precursor and also from aqueous suspensions
containing the Au NPs with a Shimadzu UV-1700 spectrophotometer in the 300-800 nm range.
Study of catalytic activities: 4-nitrophenol reduction reaction
The hydrogenation of 4-nitrophenol was monitored by UV-VIS
absorption spectroscopy in the 350 to 500 nm range5,6. In order to
perform this procedure, add 2 mL of a 42 mmol L-1 sodium
boro-hydridesolution to 0.3 mL of 0.14 mmol L-1 4-nitrophenol aqueous
solution in a quartz cuvette, which should then inserted into the spectrophotometer. Register the initial spectrum. Considering that
the Au concentration (mmol L-1) employed in each reaction
(grow-ing step) was different, each of the result(grow-ing Au NPs suspension (Au NPs seeds, Au NPs after the first deposition step, and Au NPs after
second deposition step) should be diluted so that the Au concentration
is the same in all cases (8.2 mmol L-1, based on the amount of AuCl
4
-employed in the reaction). Specifically, dilute 500, 250 and, 170 mL
of the suspensions containing Au NPs seeds, Au NPs after the first deposition step, and Au NPs after the second deposition step, respec-tively, to 2 mL with deionized water. The catalytic performances of
Au NPs with different sizes should be evaluated by adding 200 mL of
this aqueous suspension containing the Au NPs to the quartz cuvette
containing 4-nitrophenol and sodium borohydridesolution. Monitor
the variations in the absorbance at 400 nm as a function of time em-ploying a time interval of 13 s between each spectrum (for the sake of comparison, observe what happens to a mixture of 4-nitrophenol
and sodium borohydridesolution without the addition of Au NPs). A
calibration curve for the concentration of 4-nitrophenolate ions will be provided. This curve was obtained by registering the absorbance at 400 nm from 0.16, 0.82, 1.65, 4.1, 8.2, 12.36, 16.47, and 24.71 µM standard aqueous solutions (prepared in the presence of an excess of sodium borohydride as described in the catalytic tests).
The variations in the absorbance with time should be employed to calculate the rate constants. The turnover frequency (TOF), a common parameter to describe catalytic activity, should also be estimated from the 4-nitrophenol calibration curve and the following expression:
TOF = N4NP/(NAu·t) (1)
where N4NP denotes the amount in mols of 4-nitrophenol converted
to 4-aminophenol, NAu the amount in mols of Au, and t the time.
Lab questions
1.Why does the reduction of AuCl4
-(aq) by sodium citrate under
the employed conditions yield nanoparticles as opposed to the bulk element? Which one (nanoparticles or bulk element) would you expect to be more thermodynamically stable under ideal conditions? What is the role of sodium citrate in the synthesis of Au NPs?
2. Sketch the surface plasmon resonance phenomenon for an indi-vidual spherical nanoparticle (metallic). Consider the interaction be-tween the electric field component from an incoming electromagnetic wave and conduction electrons in the metal nanoparticle. Propose an explanation for the variation in the color from the suspensions con-taining the Au NPs as a function of size. Present the UV-VIS spectra
recorded from the AuCl4
-(aq) and Au NPs suspensions in a single plot.
3. Which rate law best described the reaction kinetics for the hydrogenation of 4-nitrophenol? Explain.
4. How you can calculate the rate constants for the reaction employing each catalyst from the recorded data? Present your cal-culations of rate constants and TOF. Present the plots describing the variation in the UV-VIS spectra with time in all cases and also the plots employed to estimate the rate constants.
5. What is the definition of a catalyst? What did you observe when the hydrogenation of 4-nitrophenol was performed in the absence of Au NPs?
6. Considering that the synthesized Au NPs were 15 ± 2.2, 26 ± 2.4, and 34 ± 3.0 nm in diameter, respectively, and that the Au con-centration was the same in all catalytic tests, calculate the specific
surface area available for catalysis, expressed as m2/g, in each case
7. Propose a mechanism for the 4-nitrophenol reduction reaction in the presence of Au NPs. What is the role of Au in this reaction? Would other metals also display catalytic activity towards the 4-ni-trophenol reduction? Explain.
REFERENCES
1. Kelly, K. L.; Coronado, E.; Zhao, L. L.; Schatz, G. C.; J. Phys. Chem. B 2003, 107, 668.
2. Campbell, D. J.; Xia, Y. N.; J. Chem. Educ.2007, 84, 91.
3. Xia, Y.; Xiong, Y.; Lim, B.; Skrabalak, S. E.; Angew. Chem. Int. Ed. 2009, 48, 872.
4. Bast, N. G.; Comenge, J.; Puntes, V.; Langmuir2011, 27, 11098. 5. Ge, J. P.; Huynh, T.; Hu, Y. P.; Yin, Y. D.; Nano Lett.2008, 8, 931. 6. Lu, Y.; Mei, Y.; Drechsler, M.; Ballauff, M.; Angew. Chem.Int. Ed.2006,