0103 - 5053 $6.00+0.00
A
r
ti
c
le
* e-mail: [email protected]
Electrochemical Behavior and Structural Changes of V
2O
5Xerogel
Fritz Huguenina and Roberto M. Torresi *,b
a
Instituto de Química de São Carlos, Universidade de São Paulo, CP 780, 13560-970 São Carlos - SP, Brazil
b
Instituto de Química, Universidade de São Paulo, CP 26077, 05513-970 São Paulo - SP, Brazil
Filmes finos obtidos a partir de xerogel de V2O5 com distintas quantidades de Li
+ intercalado
eletroquimicamente foram caracterizados utilizando diferentes técnicas in-situ. As mudanças nas propriedades mecânicas foram investigadas utilizando medidas de impedância eletroacústica e estes experimentos indicaram que o processo de intercalação não produz mudanças importantes nas propriedades viscoelásticas do filme; portanto, a equação de Sauerbrey foi utilizada para transformas mudanças de freqüência em mudança de massa. A técnica de microbalança eletroquímica a cristal de quartzo permitiu mostrar a participação do solvente (carbonato de propileno) durante os ciclos de carga/ descarga. Diferentes experimentos espectroeletroquímicos permitiram mostrar a influencia das modificações estruturais no processo de eletro-intercalação. Aa mudanças para uma estrutura mais amorfa do material durante o processo de descarga produz uma diminuição na velocidade dos portadores de carga. A simetria local do vanádio no óxido foi estudada utilizando absorção de raios X.
Thin films of V2O5 xerogel were characterized by several in-situ techniques for different amount of intercalated Li+. Changes in the V
2O5 mechanical properties were analyzed by electroacoustic
impedance data, indicating that lithium intercalation does not produce an important change in the viscoelastic properties. So that, it is possible to use the electrochemical quartz crystal microbalance to measure mass change. Electrogravimetric results showed a significant participation of propylene carbonate molecules during charge/discharge cycles, associated with a significant expansion/ contraction of the structure. The ultraviolet-visible spectrophotometry, chronoamperometry and electrochemical impedance spectroscopy data showed the influence of structural modifications on electronic and ionic properties during the intercalation process. The amorphization of the material in the discharged state produces a diminution in the charge carrier rate. Besides this, changes in the local symmetry of the vanadium ion by extended X-ray absorption fine structure experiments, were verified.
Keywords: V2O5, xerogel, EQCM, lithium intercalation, XAS
Introduction
Sol-gel process became an usual method for preparing inorganic matrices, which allows the intercalation of different kinds of chemical species. This preparation method is based on reactions of alkoxide hydrolysis and condensation that can start from inorganic salts or organometallic compounds. V2O5 matrix has been widely studied due to its properties, such as being an important semiconductor whose electronic conductivity is associated to the electronic jump between V5+ and V4+ ions.1 V
2O5 xerogels have been used as host materials for several metal cations2 and they are also studied as cathodes for secondary lithium batteries.3,4 The lamellar structure allows Li+
intercalation/deintercalation during the reduction/ oxidation of vanadium cations.5 This transition metal oxide also gives optically transparent thin films, which can be used as counter-electrode in electrochromic devices.6
The rate-limiting step during the intercalation/ deintercalation of Li+ ions into V
2O5 is associated with ionic diffusion path. In addition, the electronic conductivity of these materials can be quite low, increasing the ohmic drop.7 Considerable effort to enhance lithium diffusion rate and the electronic conductivity in this cathode material was done.8-10 V
of isolated particles, decreasing the amount of electroactive material.16 The weak interactions between V
2O5 xerogel ribbons allow the intercalation/deintercalation of solvent molecules in the interlamellar space during the charge/ discharge cycles, promoting a significant expansion/ contraction of the structure. Moreover, the stacking turbostatic structure is destroyed during the intercalation of Li+, but it is formed again during the deintercalation of Li+.11 Thus, considerable effort has been done to increase the structural stability of this xerogel.15
Considering the importance of the volumetric changes for capacity fading due to solvent molecules intercalation/ deintercalation, the in situ determination of the amount of these chemical species is extremely useful. Moreover, this determination allows using a necessary minimal amount of electrolytic solution to decrease the weight of a lithium-ion battery with a good performance. The electrochemical performance of V2O5 also depends on the crystalline degree. In fact, electrical, optical and mass transport properties are a function of the structural order.7,17-19 Thus, considering the amorphization of V2O5 during the discharge step, it is important to analyze its structure in more detail.
This work shows results about different aspects of V2O5 xerogel in the form of thin films. Although electroanalytical characterization can be carried out for xerogel containing conductive additives and binders, which shows a superior electrochemical performance,20 thin films of pure V
2O5 are necessary for performing a study without interference of other substances. Firstly, the dependence of mechanical properties on the amount of intercalated Li+ ions was observed by electroacoustic impedance (EAI). After, the charge compensation process based on electrochemical quartz crystal microbalance (EQCM) data have been determined in order to estimate the amount of solvent mole-cules exchanged during the redox reaction. Considering the effects caused in the optical properties by vanadium ion reduction, ultraviolet-visible (UV-vis) spectra have been used to help in the investigation of the xerogel structure. Structural variations have also been discussed on short-order range interactions by Extended X-ray absorption fine structure (EXAFS) experiments, which allow verifying bond length changes for different redox states.21,22 Finally, the influence of these structural modifications on the electronic and ionic transport by using electrochemical impedance spectroscopy (EIS) and chronoamperometry, is shown.
Experimental
Hydrated V2O5 (V2O5•1.6H2O) was synthesized following a modification of a previously described
sol-gel method.1 Briefly, 0.2 mL of vanadyl tris(isopropoxide), VC9H21O4 (Gelest) was added to 120 mL of water. Casting these liquids onto a substrate and air-drying at room temperature produces hydrated films of V2O5.23
For electrochemical experiments, the counter electrode was a platinum sheet (area = 10 cm2). A 0.5 mol L-1 LiClO
4 (reagent grade, Aldrich) in propylene carbonate (PC) (reagent grade, Aldrich) was used as electrolyte and a saturated Ag/AgNO3 in PC as reference electrode (it has a potential of 0.54 V versus a saturated calomel electrode). The working electrode for UV-vis spectrophotometric measurements and impedance experiments was an ITO conducting glass (indium-tin oxide coated on glass from Delta Technologies, sheet resistance ≤ 20Ω cm-1) with a geometrical area of 1 cm2. The absorbance was measured with Hitachi U-3501 and Micronal B295 spectrophotometers. EIS experiments using an ac perturbation of 5 mV in the 5 mHz - 100 kHz frequency range were carried out using an Autolab PGSTAT30 equipment. For EQCM experiments, the substrates were 6 MHz AT-cut quartz crystal coated with Pt. A piezoelectric active area of 0.31 cm2,was used. The resonance frequency shift was measured with an HP-5370B Universal Time Counter. Electrochemical measurements were made using a FAC 2001 potentiostat/galvanostat. Changes in the resonance frequency of the EQCM crystal were transformed into mass changes by using the Sauerbrey equation24 (∆f = - K ∆m), where the integral sensitivity constant (K = 6.45 x 107 cm2 s-1 g-1) was obtained by calibration using silver electrodeposition.25 Electroacoustic impedance measurements on the modified quartz crystal were performed in order to obtain the mechanical conductance near the resonant frequency of the crystals. These measurements were run with an HP-4192A, based on a previously described approach.26
The computer program used for the analysis of the X-ray absorption data was the WinXAS package.29 The XAS spectra, obtained between 5382 and 6248 eV using steps of 2 eV, were first corrected for background absorption by fitting the pre-edge data (from –60 to –20 eV below the edge) to a linear formula, followed by extrapolation and subtraction from the data over the energy range of interest. Next, the spectra were calibrated for the edge position by using the second derivative of the inflection point at the edge jump of the data from the reference channel (V foil). Finally, the spectra were normalized taking as reference the inflection point of one of the EXAFS oscillations (ca.
5500 eV), where the absorption was considered equal to one. The EXAFS oscillations were removed from the measured absorption coefficient by using a cubic spline background subtraction. Next, the EXAFS oscillations were normalized to a signal per absorbing atom though division by the height of the absorbing edge given by the fitted spline function. Fourier transforms of the EXAFS oscillations were calculated employing the Hanning window, k1 weight, and the ∆k values specified in Figure 6.
Results and Discussion
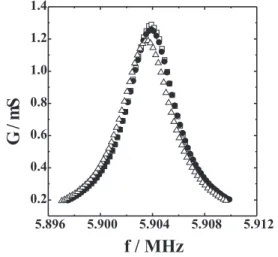
Changes in the resonance frequency on the quartz substrates during the redox-process can be associated to mass shifts of the film produced by intercalation/ deintercalation of chemical species. However, it is important to verify that viscoelastic properties do not change for different oxidation states, in order to validate the Sauerbrey equation.24 So, EAI measurements were performed for platinum EQCM electrodes onto which a thin V2O5 film was deposited. The film was cycled
repeatedly until the voltammetric shapes were invariant with time as those presented latter on. Figure 1 shows EAI experiments carried out at three potential values, 0.4, –0.75 and –1.2 V between 5.898 MHz and 5.910 MHz. The decrease of the maximum of conductance (Gmax) is often a useful measurements of the loss of mechanical energy for the vibrating crystal. A decrease of Gmax indicates that the redox process produces mechanical changes in the V2O5 film between –0.75 and –1.2 V. Actually, a small decrease (2 %) is observed when the film is reduced from 0.4 to –0.75 V and a more important decrease is observed at –1.2 V (8% in comparison with that at 0.4 V). This dissipation of energy can be related to mechanical variations due to structural changes, and the Sauerbrey equation cannot be applied between –0.75 V and –1.2 V. However, the mechanical variations were considerably smaller between 0.4 V and –0.75 V, and the Sauerbrey equation can be used to calculate the mass change in this potential range.
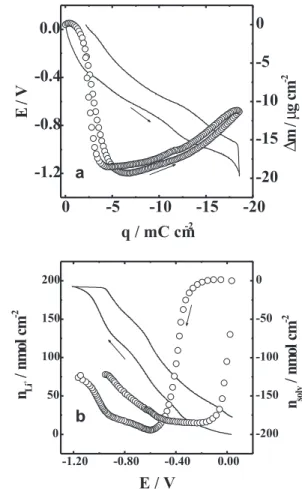
Figure 2a shows the potentiodynamic profiles of mass change and current density for V2O5 at 5 mV s-1. Although the scan rate applied in electrochemical experiments with V2O5 xerogel is normally lower than that used in this work, the mass (thickness) employed is sufficiently small (16 µg cm-2) to allow the intercalation of a great amount of
Figure 1. Conductance as a function of frequency in LiClO4 0.5 mol L-1/PC electrolytic solution at 0.4 V (), -0.75 V () and –
1.2 V ().
Figure 2. a) j/E (¾) and Dm/E () and b) amount of Li+ (—) and
solvent () potentiodynamic profiles in LiClO4 0.5 mol L-1/PC
lithium ions due to a lower electronic resistance and a faster ionic diffusion than in thicker films. The film was cycled until curves became invariant, after which the voltammogram was recorded. The current profile is similar to that previously reported for V2O5,30 where the current peaks are associated to the redox process V4+/V5+. The presence of more than one cathodic or anodic current peaks in the voltammogram can be associated to modifications in the structure (modifying the electronic states of the conduction band), which allow the intercalation/ deintercalation of more lithium ions in different sites to compensate the charge injected/ejected in the film.31 However, mass shifts as a function of potential are not associated only with the insertion/deinsertion of Li+, as shown in the potentiodynamic profile of the mass change. A decrease of 7.4 µg cm-2 is observed during reduction between –0.15 and –0.7 V. Despite of the impossibility of using the Sauerbrey’s equation between –0.75 and –1.5 V, a quantitative mass change can be calculated at potentials more positive than –0.75 V. This suggests the expulsion of a significant amount of PC molecules when Li+ is intercalated in the oxide matrix, which is associated to structural changes. This fact is in agreement with the results obtained by Baddour et al.,11 who have observed a diminution of the inter-ribbons distance (from 21.6 Å to 10.6 Å) of LixV2O5 for x > 0.2.
A quantitative treatment from EQCM data allows to calculate the amount of solvent and cations that participate of the charge compensation process. The treatment begins from the global mass and charge balances, according to the equations below, where only the participation of Li+ and molecules of PC intercalation/deintercalation into the xerogel film is considered.32-34
solv solv Li
Li
n
M
n
M
m
=
+
D
+ + (1)F
q
n
Li+
=
-
(2)÷
÷
ø
ö
ç
ç
è
æ
+
÷÷
ø
ö
çç
è
æ D
=
+F
M
q
M
M
m
n
solv Li
solv
solv (3)
where ∆m, MLi+, nLi+, Msolv, nsolv, q and F are mass change, lithium molar mass, number of mols of lithium, solvent molar mass, number of mols of solvent, charge and Faraday’s constant, respectively.
Figure 2b shows the amount of Li+ and PC molecules as a function of potential calculated by using equations 2 and 3, respectively. As it can be seen, when Li+ is interca-lated into the host matrix, specifically for 0.05 < x < 0.4
(-0.25 V < E < -0.65 V), PC molecules are expelled from the film. This result shows a small difference in comparison with XRD data,11 which can be attributed to difference between steady state and transient conditions. The reverse scan shows that this process is reversible.
Figure 3 shows potential and mass shifts as a function of injected/ejected charge for V2O5 at a constant charge/ discharge current of 10 µAcm-2. As observed in Figure 2a, a decrease of the mass is observed during reduction. This also suggests the expulsion of great amount of PC molecules when Li+ is intercalated in the oxide matrix, due to structural changes at different oxidation states. Figure 3b shows the amount of Li+ and PC molecules as a function of potential. Similarly to the potentiostatic mode, when Li+ is intercalated into the host matrix for -0.15 V < E < -0.60 V, PC molecules are expelled from the film.
Figure 4 shows the UV-vis spectra for V2O5 at 0.4, -1.0 and –1.5 V. Extrapolating the values of absorbance below 500 nm for a minimum absorption, the energy gap (Eg) between the oxygen 2p and vanadium 3d bands can be determined.35 It is noted that E
g increases when the xerogel is reduced, in agreement with others reports.35,36 The values
Figure 3. a) E/q (—) and Dm/E () profiles and b) amount of Li+
(—) and solvent () as a function of potential in LiClO4 0.5 mol L-1/
of Eg were 2.21 eV (at 0.4 V) and 2.73 eV (at –1.0 V). At –1.5 V, the spectrum does not allow an unambiguous determination of the bandgap energy, but it is possible to estimate an increase of Eg. For a significant amount of Li+ intercalated, the absorption band presents a blue shift and this phenomenon can be attributed to the split of the 3d band.37-39 In the initial part of the absorption edge, an exponential dependence of absorbance as a function of energy was verified. This fact suggests that this material follows the Urbach’s rule,40,41 attributing this dependence to the split off of energy states in the forbidden gap, which are originated by distortions of energy bands due to random fluctuations of potential. The disorder of the structure contributes for this spectrum profile, decreasing the slope of absorbance as a function of wavelength. So, it is possible to verify that the structure of xerogel is more disordered for a greater amount of Li+, modifying the electronic properties, as bandgap energy and others, as it will be shown below.
Other important fact is the absorbance increase above 600 nm when the potential varies from 0.4 to –1.0 V. This fact is attributed to the intervalence transference between V4+→V5+.18,40 Figure 5 shows the incremental capacity curves (dq/dE) and the potentiodynamic profile of absorbance change (∆A) at 700 nm, obtained from charge/ discharge experiments. It is showed an increase of ∆A for E > -0.85 V during the reduction process, due to an increase of the amount of V4+ sites. When E ≈ -0.85 V, this amount is equal to that of V5+ (considering only the vanadium sites where Li+ can access them) and the absorbance reaches a maximum value. For more negative potentials, there is a decrease of ∆A due to excess of V4+ sites in comparison to V5+ ones. Note that the maximum value of ∆A is positioned
between two peaks in the incremental capacity. Thus, it suggests a greater structural modification for the Li+ accommodation when the amount of V4+ is equal to those of V5+.
Figures 6 and 7 show the K-weighted EXAFS signals and the Fourier transform (FT) magnitude at x = 0, x = 0.3 and x = 1.3. Despite small changes observed in the figures, the range of error assumed was minimized due to in situ
experiments, avoiding problems arising from structural modifications upon removal of the cathode from the electrochemical cell and possible changes of the electrochemical behavior for different samples.
The peaks in the radial structure of the FT magnitude correspond to the contribution of individual coordination
Figure 4. UV-Vis spectra for V2O5 as function of E for (——) E = 0.4, (——) E = -1.0 and (——) E = -1.5 V. Electrolytic solution: LiClO4 0.5mol L-1/PC.
Figure 6. k[χ(k)] EXAFS oscillations for LixV2O5 as function of x for (——) x = 0, (——) x = 0.3 and (——) x = 1.3. Electro-lytic solution: LiClO4 0.5mol L-1/PC.
shells around the metallic atom under investigation. The shape, magnitude, and position of each of these peaks are related to the coordination number (N), bond distance (R), the atomic ordering structure (Debye-Waller factor, ∆σ2), and the edge energy shift (∆Eo). The atomic ordering structure can be quite different for the different charge states, and this introduces some uncertainty in the comparison of FT magnitudes, particularly for quantitative correlations of the position and intensity of the peaks with the bond distance and the coordination number. Despite these limitations, this approach has been employed in several publications,21,42-44 with quite reasonable quali-tative results.
In Figure 7 (for x = 0), the nearest vanadium neighbour is represented by the peak “A” at 1.60 Å, which is assigned to the V=O coordination shell. The peak “B” at 2.07 Å is associated to the V-O bonds in the distorted square pyramid planar base. The presence of the FT peak “C” at 2.70 Å is assigned to a vanadium ion from the second shell,21 and it can be also attributed to the presence of water molecules coordinated with the metallic ion in the axial direction.1,42 However, the contribution of this oxygen is smaller than that of the vanadium ion (second shell) due to atomic weight, producing a small back-scattering amplitude.43 It is noted a new length of the V=O bond (1.67 Å), the V-O bonds (not well defined) and V-V interaction (2.61 Å) for x = 1.3. This means a translation of the apical oxygen toward the VO4 basal plane and a translation of vanadium atom of second shell towards the vanadium atom of the first shell.43-45 As a consequence of important changes in the inter-atomic distances (for example at x = 1.3), the material can show a mechanical stress due to expansion/contraction of the oxide matrix leading to forces changes at the substrate/film interface and among the particles of V2O5.
This fact can be responsible for EAI behavior, that is to say, that dumping of conductance appears as a resistance, which provokes a diminution in the conductance at the resonance frequency. Other interesting fact observed in Figure 7 is the decrease of FT intensity of the peak “C” as a function of x. A justification for this is the decrease of the coordination number of vanadium atom due to expulsion of some water molecules coordinated to vanadium atoms27 and/or some local disorders in neighbour shells associated with the amorphization of the host.46 In fact, a significant decrease of FT signal is noted after first shell.
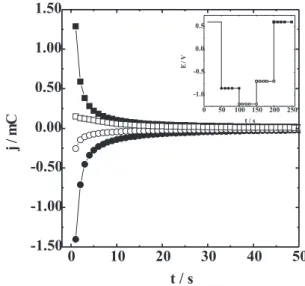
It is known that the diffusion process of Li+ into V 2O5 is the limiting step of the redox process. Actually, the diffusion coefficient of Li+ (D
Li+) into xerogel in LiClO4/ PC is very small, varying between 10-8 and 10-17 cm2 s-1.20,31,47 A fact that is always verified in these xerogel films is that the mobility of Li+ is slower as the concentration of Li+ increases in film. This is related to Li+—Li+ interaction in the host structure. Moreover, the structural changes during the charge injection also modify the flux of Li+. In fact, Vivier et al.19 and McGraw et al.48 showed a dependence of DLi+ with the formation of new phases in crystalline V2O5. Because of this, it is very important to investigate the diffusion process in different structural arrangements, as those observed in the V2O5 xerogel. Figure 8 shows the current density response for the applied potential (potential program is shown in the figure). The potential values were chosen according to the different structural arrangement observed by the other techniques used in this work. The maximum charges were 6.0, 3.0, 2.3 and 8.0 mC for steps I, II, II and IV (indicated in the figure), respectively. The maximum current density is ca. six (eight) times lower in
Figure 7.k Fourier Transform spectra V2O5 as function of x in LixV2O5 for (——) x = 0, (——) x = 0.3 and (——) x = 1.3. Electrolytic solution: LiClO4 0.5mol L-1/PC.
Figure 8. Chronopotentiometric curves for potential steps from 0.6 V to –0.85 V (), from –0.85 V to –1.2 V (), from –1.2 V to –0.7 V () and from –0.7 V to 0.6 V () in LiClO4 0.5 mol L-1/PC
range II (III) than that in range I (IV), approximatelly, showing that the diffusion process is significantly slower for the more negative potential range. This is also deduced from slow decay of the current for steps II and III. These results can be attributed to higher concentration of Li+ in the film during steps II and III, but also as a result of significant structural modifications.
Impedance spectroscopy is a powerful technique for the analysis of electronic conductivity and mobility of Li+ into insertion electrodes. The Nyquist diagrams are illustrated in Figure 9. dc potentials of 0.5 V, -0.7 V and –1.2 V with 5 mV of amplitude were applied . At 0.5 V (Figure 9a), V2O5 is oxidized, resulting in a high bulk resistance.49 Actually, when the amount of V4+ tends to zero, there is a decrease of the concentration of charge carriers (polarons). At –0.7 V (Figure 9b), a significant decrease of the resistance is observed and it is possible to verify the finite diffusion process. Although the mobility of Li+ is very small (the apparent diffusion coeficient is 3 x 10-12 cm2s-1 for this potential50), the small mass (thickness) of the film allows seeing the charge saturation for low frequencies. For greater mass (thickness), only the
processes associated to bulk electronic resistance and semi-infinite diffusion are observed .50 At –1.2 V (Figure 9c), an increase of the resistance is again noted, and the decrease of structural order can be responsible for this behavior. Normally, amorphous materials have a lower electronic conductivity than crystalline ones. In fact, a greater value of Eg was observed when the structure of the material was more disordered. Thus, it is evident that the structural changes that takes place in xerogel film cause the flux of charge carriers to be slower, mainly at E < -0.85 V.
Conclusions
Thin LixV2O5 xerogel films were studied by several in-situ techniques, allowing to analyze structural changes and their influence on electronic and mass transport properties. This material showed a significant energy dissipation for great amounts of Li+ intercalated, specifically for x > 1. It was possible to verify the intercalation/deintercalation of Li+ together with a great amount of PC molecules, indicating a significant expansion/contraction of the host matrix. Besides this, all the results shown indicate a significant structural change in the short and long order range during the intercalation of Li+, mainly in the more negative potential range. The matrix becomes more amorphous and the coordination number surrounding vanadium ion tends to decrease as a function of the amount of Li+. These structural modifi-cations contribute to a slower flux of charge carriers. So, considering that the great PC participation in redox mechanism can be one of the main reasons for capacity fading after several charge/discharge cycles, and that the structural disorder provokes a decrease of the electronic conductivity and the ionic diffusion rate, it is extremely important the use of new strategies to increase the structural stability or to maintain an unchangeable conductor pathway, optimizing its electrochemical properties.
Acknowledgements
F. Huguenin thanks FAPESP for the scholarship granted (98/15848-3). The authors also thank FAPESP (02/08721-4), CNPq, and PRONEX/FINEP for financial support, and Professor D. A. Buttry (University of Wyoming, USA) for EAI experiments facilities.
References
1. Livage, J.; Chem. Mater.1991, 3, 578.
2. Coustier, F.; Hill, J.; Owens, B. B.; Passerini, S.; Smyrl, W. H.;
J. Electrochem. Soc.1999, 146, 1355.
Figure 9. Nyquist diagrams in LiClO4 0.5 mol L-1/PC electrolytic
3. Tipton, A.L.; Passerini, S.; Owens, B. B.; Smyrl, W. H.; J. Electrochim. Soc.1996, 143, 3473.
4. Varela, H.; Huguenin, F.; Malta, M.; Torresi, R.M.; Quim.
Nova2002,25, 287.
5. Park, H. –K.; Smyrl, W. H.; Ward, M. D.; J. Electrochem. Soc.
1995, 142, 1068.
6. Livage, J.; Coord. Chem. Rev.1999, 190, 391.
7. Bullot, J.; Cordier, P.; Gallais, O.; Gauthier, M.; Livage, J.; J. Non-Crystalline Solids1984, 68, 123.
8. Parent, M. J.; Passerini, S.; Owens, B. B.; Smyrl, W. H.; J. Electrochem. Soc. 1999, 146, 1346.
9. Park, H. K.; Smyrl, W. H.; J. Electrochem. Soc. 1994,141, L25.
10. Wu, C. –G.; DeGroot, D. C.; Marcy, H. O.; Schindler, J. L.; Kannewurf, C. R.; Liu, Y. –J.; Hirpo, W.; Kanatzidis, M. G.;
Chem. Mater. 1996, 8,1992.
11. Baddour, R.; Pereira-Ramos, J. P.; Messina, R.; Perichon, J.; J. Electroanal. Chem.1991, 314, 81.
12. Sato, Y.; Nomura, T.; Tanaka, H.; Kobayakawa, K.;
Electrochem. Soc. Lett. 1991, 138, L37.
13. Gimenes, M. A.; Profeti, L. P. R.; Lassali, T. A.; Graeff, C. F. O.; Oliveira, H. P.; Langmuir 2001, 17, 1975.
14. Pereira-Ramos, J.-P.; J. Power Sources 1995, 54, 120. 15. Huguenin, F.; Giz, M. J.; Ticianelli, E. A.; Torresi, R. M.; J.
Power Sources 2001, 103, 113.
16. Coustier, F.; Lee, J.-M.; Passerini, S.; Smyrl, W. H.; Solid State Ionics 1999, 116, 279.
17. Levi, M. D.; Lu, Z.; Gofer, Y.; Cohen, Y.; Cohen, Y.; Aurbach, D.; Vieil, E.; Serose, J.; J. Electroanal. Chem. 1999, 479, 12. 18. Anaissi, F. J.; Demets, G. J. F.; Toma, H. E.; Electrochem.
Comm. 1999, 1, 332.
19. Vivier, V.; Farcy, J.; Pereira-Ramos, J.-P.; Electrochem. Acta
1998, 44, 831.
20. Passerini, S.; Smyrl, W. H.; Berrettoni, M.; Tossici, R.; Rosolen, M.; Marassi, R.; Decker, F.; Solid States Ionics 1996, 90, 5. 21. Giorgetti, M.; Passerini, S.; Smyrl, W. H.; Mukerjee, S.; Yang,
X. Q.; McBreen, J.; J. Electrochem. Soc. 1999, 146, 2387. 22. Giorgetti, M.; Berrettoni, M.; Passerini, S.; Smyrl, W. H.;
Electrochim. Acta 2002,47, 3163.
23. Huguenin, F.; Gambardella, M. T. P.; Torresi, R. M.; Córdoba de Torresi, S. I.; Buttry, D. A.; J. Electrochem. Soc. 2000, 147, 2437.
24. Sauerbrey, G.; Z. Phys. 1959, 155, 206.
25. Gabrielli, C.; Keddam, M.; Torresi, R.; J. Electrochem. Soc.
1991, 138, 2657.
26. Noel, M. A. M.; Topart, P. A.; Anal. Chem. 1994, 66, 484. 27. Huguenin, F.; Ticianelli, E. A.; Torresi, R. M.; Electrochim.
Acta 2002, 47, 3179.
28. Tolentino, H.; Cezar, J. C.; Cruz, D. Z.; Compagnon-Caillol, V.; Tamura, E.; Alves, M. C.; J. Synchrotron Radiation 1998,
5, 521.
29. Ressler, T.; J. Phys. IV 1997, C2, 269.
30. Shouji, E.; Buttry, D. A.; Langmuir 1999, 15, 669.
31. Pereira Ramos, J.-P.; Baffier, N.; Pistoia, G.; Lithium Batteries – New Materials, Developments and Perspectives, Elsevier: Amsterdam, 1994.
32. Buttry, D. A.; Ward, M. D.; Chem. Rev. 1992, 92, 1355. 33. Varela, H.; Malta, M.; Torresi, R. M.; Quim. Nova 2000, 23,
664.
34. Shouji, E.; Buttry, D. A.; Electrochim. Acta2001, 45, 3757. 35. Talledo, A.; Granqvist, C.G.; J. Appl. Phys. 1995, 77, 4655. 36. Oliveira, H. P.; Graeff, C. F. O.; Brunello, C. A.; Guerra, E. M.;
J. Non-Crystalline Solids 2000, 273, 193.
37. Parker, J.C.; Lam, D.J.; Xu, Y.-N.; Ching, W.Y.; Phys. Rev. B
1990, 42, 5289.
38. Bullet, D.W.; J. Phys. C1980, 13, L595.
39. Lambrecht, W.; Djafari-Roubani, B.; Vennik, J.; J. Phys. C
1981, 14, 4785.
40. Bullot, J.; Cordier, P.; Gallais, O.; Gauthier, M.; J. Non-Crys-talline Solids 1984, 68, 135.
41. Kenny, N.; Kannewurf , C.R.; Whitmore, D.H.; J. Phys. Chem. Solids 1966,27, 1237.
42. Nabavi, M.; Sanchez, C.; Livage, J.; Philos. Mag. B 1991, 63, 941.
43. Prouzet, E.; Moulin, C. C. D.; Villain, F.; Tranchant, A.; J. Chem. Soc., Faraday Trans. 1996, 92, 103.
44. Mansour, A. N.; Smith, P. H.; Baker, W. M.; Balasubramanian, M.; McBreen, J.; Electrochim. Acta 2002, 47, 3151. 45. Potiron, E.; Lê Gal La Salle, A.; Verbaere, A.; Piffard, Y.;
Guyomard, D.; Electrochim. Acta 1999, 45, 197.
46. Cartier, C.; Tranchant, A.; Verdaguer, M.; Messina, R.; Dexpert, H.; Electrochim. Acta 1990, 35, 889.
47. Mège, S.; Levieux, Y.; Ansart, F.; Savariault, J. M.; Rousset, A.; J. Appl. Electrochem. 2000, 30, 657.
48. McGraw, J. M.; Bahn, C. S.; Parilla, P. A.; Perkins, J. D.; Readey, D. W.; Ginley, D. S.; Electrochim. Acta 1999, 45, 187.
49. Huguenin, F.; Torresi, R. M.; Buttry, D. A.; Pereira da Silva, J. E.; Córdoba de Torresi, S. I.; Electrochim. Acta 2001, 46, 3555.
50. Huguenin, F.; Torresi, R. M.; Buttry, D. A.; J. Electrochem. Soc. 2002, 149, A546.
Received: February 11, 2003
Published on the web: July 11, 2003