www.atmos-chem-phys.net/15/13177/2015/ doi:10.5194/acp-15-13177-2015
© Author(s) 2015. CC Attribution 3.0 License.
Composition, size distribution, optical properties, and radiative
effects of laboratory-resuspended PM
10
from geological dust of the
Rome area, by electron microscopy and radiative transfer modelling
A. Pietrodangelo, R. Salzano, C. Bassani, S. Pareti, and C. Perrino
Institute of Atmospheric Pollution Research, National Research Council, Rome, Italy
Correspondence to:A. Pietrodangelo ([email protected])
Received: 1 April 2015 – Published in Atmos. Chem. Phys. Discuss.: 7 May 2015
Revised: 3 November 2015 – Accepted: 6 November 2015 – Published: 27 November 2015
Abstract. In this work, new information has been gained
on the laboratory-resuspended PM10 fraction from
geolog-ical topsoil and outcropped rocks representative of the Rome area (Latium).
Mineralogical composition, size distribution, optical prop-erties and the surface radiative forcing efficiency (RFE) of dust types representing the compositional end mem-bers of this geological area have been addressed. A multi-disciplinary approach was used, based on chamber resus-pension of raw materials and sampling of the PM10
frac-tion, to simulate field sampling at dust source, scanning electron microscopy/X-ray energy-dispersive microanalysis (SEM XEDS) of individual mineral particles, X-ray diffrac-tion (XRD) analysis of bulk dust samples, building of num-ber and volume size distribution (SD) from microanalysis data of mineral particles and fitting to a log-normal curve, and radiative transfer modelling (RTM) to retrieve optical properties and radiative effects of the compositional end-member dust samples.
The mineralogical composition of Rome lithogenic PM10
varies between an end-member dominated by silicate min-erals (from volcanics lithotypes), and one mostly composed of calcite (from travertine or limestones). Lithogenic PM10
with intermediate composition derives mainly from silici-clastic rocks or marlstones. Size and mineral species of PM10
particles of silicate-dominated dust types are tuned mainly by rock weathering and, to lesser extent, by debris formation or crystallization; chemical precipitation of CaCO3plays a
ma-jor role in calcite-dominated types. These differences are re-flected in the diversity of volume distributions, either within dust types or mineral species. Differences are also observed between volume distributions of calcite from travertine
(nat-ural source; SD unimodal at 5 µm a.d.) and from road dust (anthropic source; SD bimodal at 3.8 and 1.8 µm a.d.).
The volcanics and travertine dusts differently affect the single scattering albedo (SSA) and the asymmetry parameter (g) in the visible (VIS) and near-infrared (NIR) regions. The downward component of the bottom-of-atmosphere (BOA) solar irradiance simulated by RTM for an atmosphere where only volcanics (or only travertine dust) composes the aerosol, shows that the volcanics contribution to the solar irradiance differs significantly from that of travertine in the NIR region, while similar contributions are modelled in the VIS. The RFE (−293 W m−2for volcanics and
−139 W m−2for travertine,
at 50◦solar zenith angle) shows that volcanics dust produces a stronger cooling effect at surface than travertine, as ex-pected for more absorbing aerosols.
1 Introduction
10
the crystallization, sedimentation, and weathering processes tuning the particle size and shape (Claquin et al., 1999). This has been observed for mineral dust of African desert regions (Caquineau et al., 2002; Evans et al., 2004; Stuut et al., 2009; Scheuvens et al., 2013; Formenti et al., 2014) and of arid ar-eas in other regions (Kim et al., 2006; Jeong, 2008; Moreno et al., 2009; Agnihotri et al., 2015; Rashki et al., 2013). Both microphysical (size distribution and complex refractive in-dex) and optical properties of airborne lithogenic dust vary as a consequence of the mineralogical composition (Sokolik and Toon, 1999; Reid et al., 2003; Hansell Jr. et al., 2011; Wagner et al., 2012; Di Biagio et al., 2014; Mahowald et al., 2014; Smith and Grainger, 2014). When at a certain site in-trusions of lithogenic dust at the ground occur, like desert dust, the overall properties of the PM may be altered, com-pared to periods when this contribution is negligible (Mel-oni et al., 2006; Choobari et al., 2014). This also affects the impact of airborne aerosol on the energy balance of the Earth. Airborne lithogenic dust plays a role both in the di-rect mechanisms (light scattering and absorption) and in the indirect mechanisms (cloud-aerosol interactions) which tune the Earth’s radiative budget (Sokolik et al., 2001; Choobari et al., 2014). While indirect effects depend on the heteroge-neous chemistry occurring at particles surface (Levin et al., 1996; Buseck and Pósfai, 1999; Sokolik et al., 2001; Krueger at al., 2004; Kandler et al., 2007), the light scattering and ab-sorption are mostly controlled by the mineralogical composi-tion, shape features and microphysical properties of geolog-ical particles (D’Almeida, 1987; Kalashnikova and Sokolik, 2002, 2004; Kokhanovsky, 2008; Hansell Jr. et al., 2011).
Most studies facing this issue relate to desert dust from Sahara and Sahel regions (Kandler et al., 2007, 2009; Müller et al., 2009; Papayannis et al., 2012; Wagner et al., 2012; Di Biagio et al., 2014). Nevertheless, knowledge gaps still exist on this issue (Rodríguez et al., 2012), due to the site-related large variability of dust mineralogical features (ele-mental and mineralogical composition, crystalline structure, shape, microphysical, and optical properties).
Also, only few of the published studies characterize the re-suspended geological dust of non-African regions (Falkovich et al., 2001; Peng and Effler, 2007; Rocha-Lima et al., 2014). Large areas of Italy, especially those closer to the Mediter-ranean Basin, are affected by dryness, heavy anthropic im-pact (urbanization, farming, quarry activities, etc.), erosion, and poor vegetation cover, leading to increased desertifica-tion risk. TheAtlas of desertification in Italy(Costantini et al., 2007, 2009) reports, for instance, that the yearly average of dry soil days in the region of Latium ranges 64/110. In Fig. S1 in the Supplement, this is shown for the area of study of this work; the highest number of dry soil days (86/110) is found in the northern zone of the study area (Geoportale Nazionale, 2011).
Latium is also characterized by a large surface where poorly developed soils and debris deposits are present, which are easily affected by massive erosion.
Consequently, the resuspension of mineral dust from lo-cal lithologilo-cal domains contributes notably to the ambient PM10of the Rome area. This is shown in Figs. S2 and S3 for
the Villa Ada site (Rome, urban background) and the Mon-telibretti EMEP site (Rome outskirts, rural background), re-spectively. Considering the 2005–2011 period, among days which show a dominant (over 50 % of total PM10 mass)
crustal contribution to the ambient PM10 composition at
these sites, desert dust intrusions at the ground (DD days) account for 60 % at Montelibretti and 30 % at Villa Ada, while the remaining days are reasonably affected by local crustal contributions, given the background character of the considered sites (LD days). Interestingly, among the above-described days, the mass concentration of the crustal matter on LD days is in many cases comparable with that observed on DD days. Within this picture, main goals of this work were the following: to study the relationships between the local outcropped rocks (or topsoil) and the dust particles in the PM10 sourced from these rocks, and to gain knowledge
on the microphysical and optical properties of the mineral PM10at geological dust source, and on the downward
radia-tive flux at BOA (bottom of atmosphere) related to an atmo-sphere where the only aerosol component is the PM10dust,
in order to define the radiative effects which are due to the lo-cal mineral dust. In a previous study, we determined elemen-tal source profiles of the PM10fraction of local mineral dust
(Pietrodangelo et al., 2013). In this work, the PM10 fraction
of the same samples was characterized with respect to the above goals. To investigate relationships among these differ-ent aspects, a multi-faceted analysis was performed, on the basis of the following approaches: chamber resuspension of raw materials and PM10sampling, to simulate field sampling
at dust source, scanning electron microscopy/X-ray energy-dispersive microanalysis (SEM XEDS) of individual min-eral particles, X-ray diffraction (XRD) analysis of bulk dust samples, number and volume size distribution (SD) building from microanalysis data of mineral particles and fitting to log-normal curve, and radiative transfer modelling (RTM) to retrieve optical properties and radiative effects. Results from experimental and modelling analysis are discussed for their consistency with both the lithological nature of major local dust sources and the microphysical properties of the mineral dust samples.
2 Approach and methodology
2.1 Study area, dust collection and sample treatment
the siliciclastic series (mainly flysch) and the quaternary de-posits (mainly travertines).
Sampling areas of about 4 km2were selected within each local geodynamics domain; a number of dust collection points was identified, within each area, to obtain sub-samples of raw material, from which the final samples were obtained. The number of sampling areas varies within each domain, depending on the geographical extension and the geological complexity of the domain. Furthermore, paved road dust was collected by brushing the surface of different roads within the volcanics and the travertine domains. PM10 dust was
laboratory-resuspended from the bulk rocks samples, and from road dust, by a resuspension chamber, and collected by low-volume sampling on polycarbonate membranes for SEM XEDS microanalysis. It is worth noting that, among laboratory methods of dust generation or resuspension from bulk materials, fluidization by mechanical ventilation in a re-suspension chamber is widely acknowledged, either for not affecting both the complete resuspension potential of the source material and the original size distribution of the re-suspended particles in the material itself, and for simulating the resuspension of dust previously deposited at a site (Gill et al., 2006, and references therein). By this approach, good approximation of the field sampling at a dust source can be achieved, making it suitable for studies on the mineralogical and microphysical characterization of mineral dust (Gill et al., 2006, and references therein; Feng et al., 2011; Aimar et al., 2012; Dobrzhinsky et al., 2012).
The whole geological siting criteria, dust sampling strat-egy, laboratory treatment details and elemental profiles of the resuspended dust types, are fully described in Pietro-dangelo et al. (2013). In that paper we discussed how, un-der the perspective of mineralogical composition, the vol-canics (silicate-dominated rocks) and the travertine (calcite-dominated rocks) can be considered as reference composi-tional end members of the overall outcropping lithotypes in the Latium region (Cosentino et al., 2009), while the sed-imentary domains (marine deposits and siliciclastic series) represent intermediate compositional terms. Therefore, for the scopes of this work the complete procedure of dust char-acterization (elemental and mineralogical composition, size distribution, optical properties and radiative downward flux) described in the following sections was applied only to the volcanics and travertine dust.
2.2 Individual particle microanalysis
An environmental scanning electron microscope Philips XL30 ESEM (FEI Company, tungsten filament) equipped with an energy dispersive spectrometer for x-ray microanal-ysis (EDAX/AMETEK Inc., USA) was used for individual particle characterization of the PM10 dust. Instrumental
cal-ibration of the magnification and of the XEDS spectrome-ter gain are routinely performed on the basis of the US EPA Guidelines for SEM EDX microanalysis of particulate
mat-ter samples (Willis et al., 2002). A small portion of sam-ple (about 8 % of total filter area) was cut in the centre of polycarbonate membranes, fixed to aluminium stubs by self-adhesive carbon discs (TAAB, 12 mm diam.) and coated with an ultra-thin carbon layer by a vacuum evaporator (108 Car-bon A, Cressington, Scientific Instruments Ltd., UK).
SEM XEDS acquisitions were performed under high vac-uum (10−6hPa) at 20 keV accelerating voltage, allowing the K-line excitation of elements with atomic numberZ≤27 (Co, Kα 6.923 keV). Micrographs were acquired by sec-ondary electron detector (SED) at magnification, working distance (WD), tilt angle, and spot size conditions properly adjusted on a case-sensitive scale to optimize image resolu-tion. The microanalysis was performed at WD 10 mm (take-off angle 35◦ relative to the specimen plane) on field areas of 1290–5200 µm2(magnitude×6000–3000) spread on the overall specimen surface; between 700 and 1000 particles were analysed per sample.
The Particle/phase analysis v.3.3 package (EDAX Inc., 2000) was used for the automated individual particle micro-analysis; threshold of the digitalized object area to be ana-lyzed was set at 80 %. Since a great number of individual par-ticles was analyzed, short live times (20–30 s) were imposed to XEDS spectra acquisition. Each field of microanalysis was manually selected prior to launching the automated scanning of particles. This choice allows a field-specific tuning of the grey scale, in order to minimize brightnessartifacts in the automated identification of particles. Amplification time and spot size were adjusted to ensure dead time around 30 % and total counts rate above 500 cps. In addition to automated mi-croanalysis, manual acquisitions were carried out, both on field areas and on individual particles, by using the EDAX control v. 3.3 package (EDAX Inc., 2000). About 20 to 30 field areas were selected from the different dust samples to perform manual acquisitions. These have been run in tripli-cate on each field (live time 10–20 s), to assess the repeata-bility of the microanalysis.
Further, XEDS spectra acquired from areas included in these fields were quantified by the conventional standard-based quantification procedure of bulk materials, to assess consistency with results previously obtained by ED-XRF analysis (Pietrodangelo et al., 2013).
10 T able 1. Quality assessment of SEM XEDS microanalysis. Dust Mineral particle K Na Ca Mg Fe Mn Al Si T i Repeatability (% rsd a ) V olcanics 10 28 14 19 12 39 6 6 29 Road dust 35 43 33 23 33 34 36 31 54 Siliciclastics 15 24 10 13 17 31 11 8 56 T ra v ertine 17 25 2 25 21 31 14 6 54 Consistenc y with XRF (% 1 b ± prop. error) V olcanics 2.4 ± 0.1 55.4 ± 0.1 22.7 ± 0.3 – 32.2 ± 0.1 500 ± 10 15.8 ± 0.2 10.8 ± 0.1 41.4 ± 0.5 Road dust 37.5 ± 0.3 > 100 28.2 ± 0.1 > 100 37.7 ± 0.7 > 100 22.3 ± 0.2 37.4 ± 0.2 87.6 ± 1.4 Siliciclastics 22.2 ± 0.1 78.7 ± 2.1 39.2 ± 0.7 52.4 ± 0.3 10.8 ± 0.2 470 ± 10 2.8 ± 0.1 50.7 ± 0.2 7.8 ± 0.5 Accurac y (g cm − 3 ) Quartz – – – – – – – 3.4 ± 0.02 – Kaersutite 0.07 ± 0.02 0.04 ± 0.03 0.24 ± 0.02 0.23 ± 0.03 0.67 ± 0.01 0.02 ± 0.01 0.49 ± 0.02 1.12 ± 0.02 0.11 ± 0.02 Calcite – – 4.1 ± 0.02 – – – – – – Accurac y (% 1 c ± prop. error) Quartz – – – – – – – 28 ± 0.4 – Kaersutite 37.3 ± 0.6 94.1 ± 18.3 47.4 ± 1.5 38.6 ± 0.3 28.6 ± 0.2 61.5 ± 1.8 28 ± 0.3 6.4 ± 0.3 40 ± 2 Calcite – – 52 ± 1 – – – – – – a % relati v e standard de viation, b % 1 : absolute percent dif ference between elemental composition determined by SEM XEDS and elemental composition of same dust type determined by ED-XRF (Pietrodangelo et al., 2013). Prop. err .: propag ated error . c % 1 : absolute percent dif ference between the element %wt in the mineral part icle and the element wt % in the b ulk standard mineral (ED AX Inc.). Prop. err .: propag ated error .
2.3 Quantification of individual particle XEDS spectra
and procedure of particle allocation to mineral classes
A large data set of XEDS spectra and size (Feret diameters, area, aspect ratio, roundness) of individual dust particles was stored. To allocate dust particles into main mineral classes of our dust samples, an ad hoc procedure has been adopted.
First, the bulk mineralogical composition of dust samples was determined by x-ray diffraction (XRD), to identify ma-jor minerals in the dust samples. Then, XEDS spectra of indi-vidual particles were semi-quantified and matched to spectra and to elemental composition of reference pure minerals ex-pected after XRD analysis. Results of matching were used to allocate individual particles into main mineral classes. De-tails are described below and in Sect. S1 of the Supplement.
The mineralogical characterization of dust samples has been carried out on the 50 µm sieved dust fraction, by an au-tomatic diffractometer Scintag X1, equipped with a Si(Li) detector using a Cu Kα target, under the following con-ditions: Ni-filtered radiation, step-scan modality (2◦ step =0.02◦), acquisition time of 10 s, operating at 45 kV and 40 mA. Quantification of minerals has been obtained accord-ing to procedures defined by Moore and Reynolds (1997).
A random orientation of particles was obtained by pressing 0.5 g of the 50 µm sieved materials with 5 atm for 10 s. Quan-titative determinations were obtained by using appropriated standards and elaborating spectra as indicated in Giampaolo and Lo Mastro (2000). From XRD results and on the basis of previous geological analysis of the area, mineral species to which individual dust particles have to be allocated were identified.
Allocation of individual dust particles analyzed by SEM XEDS to mineral classes can be carried out by matching XEDS spectra of particles to those of pure minerals.
However, XEDS spectra of some minerals can be not available; in this case, allocation can be performed by match-ing the quantified elemental composition of particles with that of pure minerals. Therefore, prior to this step, particle elemental composition has to be quantified.
When quantification of individual particle XEDS spectra is concerned, the use of conventional methods for bulk and thin polished materials (Castaing, 1951) imposes some criti-cal limitations, and proper adjustments and assumptions for the theoretical treatment of X-ray generation and losses in the particulate matrix are needed (Armstrong and Buseck, 1975; Van Dyck et al., 1984; Choël et al., 2005, 2007).
In addition to bulk matrix effects, the particle size and shape play a major role in the mass, absorption and fluores-cence effects of particulate matrices (Fletcher et al., 2011).
2 µm, that is far larger than the spot size used (0.3/0.4 µm average). However, energy losses due to particle absorption and fluorescence effects cannot be neglected. Among meth-ods described in literature to quantify environmental particles by XEDS microanalysis (Fletcher et al., 2011), the particle standard approach was adopted in this work. In particular, an internal standard was used; by this choice, particle matrix ef-fects are included in the quantification process, and the con-ventional standard-based quantification method still can be used (Castaing’s first approximation corrected for bulk ma-trix effects by the ZAF algorithm). Full details of this ap-proach are described in Sect. S1 of the Supplement.
Allocated mineral particles of the volcanics and travertine dusts were then used to investigate the microphysical, optical and radiative properties of the PM10lithogenic dust of Rome.
2.4 Size distribution
In this work, the assumption of particle sphericity has been adopted, due to the requirements of the 6SV (Second Sim-ulation of a Satellite Signal in the Solar Spectrum – Vec-tor) code for radiative transfer modelling. Therefore, physical size of particles was assumed as the diameter of the equiva-lent spherical cross sectional area (ESD) (Reid et al., 2003; Kandler et al., 2007; Choël et al., 2007) measured by SEM. Then, mineral density was assigned to allocated particles; volume, mass, and aerodynamic diameter were consequently calculated (Kulkarni et al., 2011). On this basis, the volume size distributions of most representative mineral species ob-served in this study (kaolinite, quartz, feldspar, and calcite) have been built.
Probability density function
The probability density functions (PDFs) of the volcanics and travertine PM10 dust were estimated by fitting the
fre-quency distribution of particle size to log-normal curve. Frequency distributions of volcanics and travertine were built on the basis of the 13 size bins of the GRIMM 1.108 op-tical particle counter (OPC). The fitting procedure was devel-oped using the R-project programming environment (R Core Team, 2013), and the routine was implemented by a non-linear regression model based on a weighted-least-squares function (Ritz and Streibig, 2008). The procedure attended to minimise the deviation between observed distribution and log-normal model. This is expressed by the following equa-tion (Davies, 1974):
dN (r)
d logr = N
√
2πlogσexp
−1 2
logr−logrm
logσ
2!
,
whereN is the number of particles, rm is the mean radius
of particles, andσ is the standard deviation ofr. The uncer-tainty of each bin was estimated associating a Poisson error to the bin weight (Liley, 1992), i.e. calculating the square root of the total counts of particles observed in each size range.
Quality assurance of the fitted models was evaluated consid-ering the “chi squared” index (χ2)in order to estimate the level of acceptance (Wilks, 2006).
This index is proportional to the sum of squares of the dif-ference between each data point and the corresponding com-puted value. The level of acceptance was defined using the
χ2distribution tables.
2.5 Radiative transfer modelling
An atmospheric radiative transfer code was employed, to retrieve the optical and radiative dust properties. The 6SV (Vermote et al., 2006; Kotchenova et al., 2008) is the new-generation of open-source atmospheric radiative transfer model 6S (Second Simulation of a Satellite Signal in the So-lar Spectrum), (Vermote et al., 1997). This code is able to retrieve optical properties of the aerosol and to model the atmospheric radiative field by using the aerosol microphysi-cal properties, under the hypothesis of spherimicrophysi-cal and dry par-ticles. Microphysical properties of aerosol required for the modelling are the size distribution and refractive index.
Size distributions targeted to the type of aerosol can be in-troduced as input in the 6SV code. To this aim, frequency distributions of particle size of the volcanics and traver-tine PM10 were processed for curve-fitting, as described in
Sect. 2.4.1. Log-normal curve parametersrandσ of the two dust types were thus used as inputs in the 6SV code.
The real and imaginary parts of the refractive index (r.i.) were assumed from literature.
This choice was driven by the fact that the 6SV code requires as input the spectral trend of the real and imag-inary parts of the r.i., and these measurements were not available from our laboratory. Therefore, the refractive in-dex of the “water-insoluble” aerosol component reported in Kokhanovsky (2008) was associated with the volcanics dust of the Rome area. This component is indeed defined as mainly dust, rich in water-insoluble minerals e.g. silicates, and is reported in literature in the spectral domain considered by the 6SV code. In the case of travertine dust, the calcite re-fractive index data reported by Sokolik and Toon (1999) and Gosh (1999) were used.
The 6SV code retrieves aerosol optical properties by the Mie theory and then simulates the radiative modelling by solving the radiative transfer equation (RTE) in the solar spectral domain. By this way, the propagation of solar ra-diation in the Earth–atmosphere coupled system can be com-pletely described.
10
Atmospheric conditions were established in order to model the radiative field under dailymaximum Sunelevation in the Rome area; a spring day, 12 May, at midday was thus selected. Columnar contents of water vapour and of ozone were fixed to 1.32 cm and 0.283 Db, respectively. To describe the aerosol loading, the aerosol optical thickness (AOT) at 550 nm,τ550(Vermote at al., 1997; Kaufmann et al., 1997;
Bassani et al., 2010, 2012) is commonly considered. The at-mospheric profile of the aerosol is assumed to be exponen-tial with a scale height of 2 km (Vermote at al., 1997). In this study, however, a high value of aerosol optical thickness,
τ550=0.7, was chosen, in order to allow describing a
sce-nario where the local geological dust loading has a major role when the radiative field in the Earth–atmosphere cou-pled system is simulated.
Among optical properties, the single-scattering albedo (SSA) and the asymmetry parameter (g) were chosen, as they are crucial to perform analysis of the aerosol contribution on the radiative field (Dubovik et al., 2002; Kassianov et al., 2007).
Concerning the simulation of the radiative quantities, the downward irradiance was modelled, to the aim of performing a preliminary investigation on the radiative impact of the dif-ferent dust types in the Earth–atmosphere coupled system. The volcanics and travertine PM10 local dust are expected
to show significantly distinct microphysical properties, due to their compositional differences. Radiative modelling has been performed thus on the assumption of an atmosphere where the only aerosol component is volcanics or travertine dust, separately.
In order to evaluate the direct radiative effect at the sur-face of the two local dust components, the radiative forcing efficiency (RFE) at BOA has been considered. In a recent modelling study, Gómez-Amo et al. (2011) derives the RFE by using a radiative transfer code.
In this study, the RFE has been computed for each com-ponent by the difference between the BOA flux simulated by 6SV code in case of atmosphere with and without the dust component in the 250–4000 nm spectral domain and normal-ized with respect to the AOT at 550 nm (Garcìa et al., 2008). The comparison between the RFE of volcanics and travertine allows for the analyzing of the dependence of surface forc-ing from aerosol types (microphysical properties) and SSA independently from the aerosol loading (di Sarra et al., 2008, 2013; Di Biagio et al., 2009, 2010). Results are shown in Sect. 3.5.2 and 3.5.3.
3 Results and discussion
Results of individual-particle XEDS spectra quantifica-tion and classificaquantifica-tion into mineral species are reported in Sect. 3.1–3.3. In particular, the discussion concerns the re-liability of microanalysis and of high-count spectra quan-tification (Sect. 3.1), a principal component analysis (PCA)
of particles elemental composition (Sect. 3.2), the allocation into mineral classes and the reliability of quantification by the internal standard approach used in this work (Sect. 3.3). In Sect. 3.4, volume size distributions are discussed, and dif-ferences between calcite from a lithogenic source (travertine dust) and from an anthropogenic material (paved road dust) are also evidenced. Finally, in Sect. 3.5 the microphysical and optical properties, and the downward component of ra-diative flux at BOA related to an atmosphere where the only component is the PM10mineral dust (volcanics or travertine,
alternatively) are discussed, with respect to the features of the Rome area.
3.1 Reliability of XEDS microanalysis and
quantification
In Table 1 (upper part) the repeatability of XEDS microanal-ysis and consistency with the ED-XRF analmicroanal-ysis are reported. Repeatability was evaluated by triple field acquisitions (num-ber of fields: 20/30) from each PM10 dust sample. Large
fluctuations around mean (% relative standard deviation) are observed for light (Na and Mg principally) and trace (Mn and Ti) elements. Consistency with previously obtained elemen-tal profiles of the PM10fraction (Pietrodangelo et al., 2013)
by ED-XRF, was assessed by matching to the latter the per-cent weight element composition of micro-areas of the dust samples obtained by XEDS field microanalysis. Results in-dicate that the microanalysis is less reliable for Na, Mn as well as for Si and Mg in the siliciclastics sample, while in all other cases it shows a good agreement with ED-XRF bulk analysis.
Quantification results of manually acquired XEDS indi-vidual particle spectra are also reported in Table 1 (lower part), for kaersutite, quartz, and calcite. Quartz and cal-cite represent the compositional end-members of mineral species observed in the dust samples of this work. Kaersutite particles were frequently observed during manual acquisi-tions. As this silicate mineral include in its composition non-negligible presence (above 4 wt %) of the principal crustal elements (Al, Na, Mg, K, Ca, and Fe), it has been assumed as reference term for the microanalysis of silicate particles. XEDS spectra of kaersutite, calcite, and quartz particles are shown in Figs. S3, S4, and S5, respectively.
bulk mineral standards, are also reported in Table 1 (last rows) in terms of absolute percent differences between the element wt % in the standard mineral and that in the mineral particle.
As expected from the uncertainties, major compositional differences with respect to mineral standards are observed in Na, Mn, and Ti quantification in kaersutite; also the quantifi-cation of Ca differs largely from the mineral standard, both in kaersutite and in calcite particles.
3.2 Elemental composition of individual dust particles
Particles included in the data set are individually codified with respect to the related dust source, so that they are trace-able in the statistical processing of data. Comparing informa-tion extracted from a multivariate statistical analysis of this data set, on the dust type to which each particle is ascribed, to same information certainly known from particle coding in the same data set, allows the evaluation of soundness of the elemental composition data and, consequently, of the quan-tification approach applied to particle XEDS spectra.
To reach this goal, a principal component analysis (PCA) of the elemental ratios commonly used to discrimi-nate among different mineral classes (Al/Ca, Fe/Ca, K/Ca, Mg/Ca, Ti/Ca, Si/Al, Si/Fe, Ti/Fe, and Ti/Mn) was per-formed. The XLSTAT 7.5 statistical package (Addinsoft) was used, with Varimax rotation and extraction of the latent fac-tors; results are shown in Figs. 1 and 2. Three latent factors with eigenvalue higher than unity explain 76 % of the to-tal variance of particle composition. The element/Ca ratios mainly contribute to the first factor (F1, eigenvalue 4.5), the Si/Al and Si/Fe ratios contribute to the second factor (F2, eigenvalue 1.8), while the Ti ratios are represented by the third factor (F3, eigenvalue 1.3). In Fig. 1, particle scores are reported in the F2 vs. F1 and in the F3 vs. F2 plots.
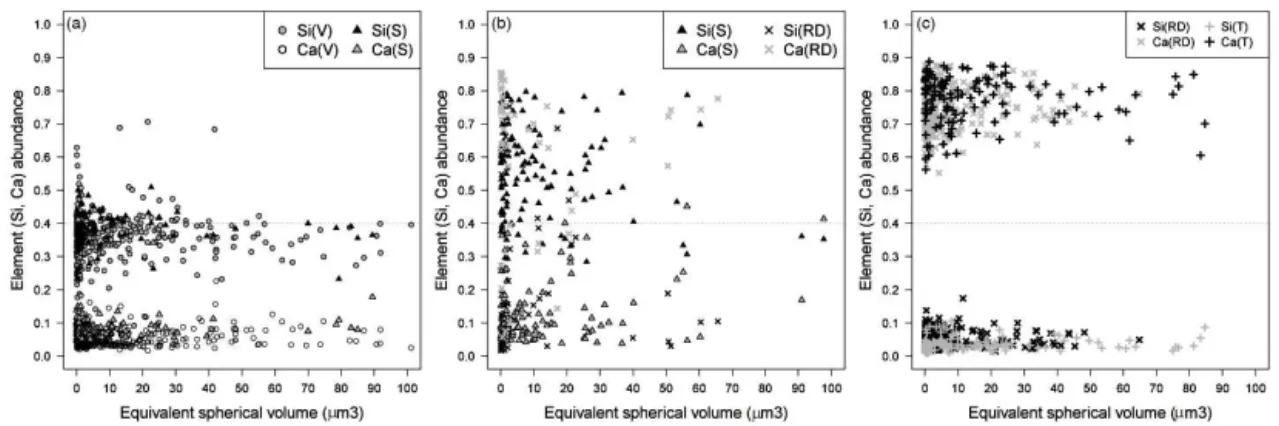
Particles described by the F1 are ascribed to volcanics and, in a small fraction, to siliciclastics dust. The latter are indeed described mainly by the F2. Finally, road dust, and travertine particles are grouped by the F3. Marlstone particles were not included in the PCA, and in the subsequent parts of the study, due to the smaller number of available data with respect to the other samples. To assess the soundness of the PCA so-lution, the relative Si and Ca abundance and the equivalent spherical volume (ESV) have been examined, within clus-ters identified by the F1, F2, and F3. In Fig. 2, the Si and Ca abundances of particles with factor score higher than unity on each of the three latent factors have been plotted with respect to the ESV.
Since the average mass fractions of Si and Ca, in SiO2and
CaCO3respectively, are 0.47 and 0.4, the threshold of 0.4 can
be used to discriminate qualitatively either between silica and silicates (for which Si abundance is expected roughly below 0.4), and similarly between calcite and other Ca-bearing par-ticles. Median Si abundance of both volcanics and siliciclas-tics particles in F1 is 0.37/0.39 (Fig. 2a); also Ca abundance
is similar in both particle groups (below 0.1). Median values of particle ESV are 3 µm3(volcanics) and 3.5 µm3 (siliciclas-tic), although a very large variability was measured. Upon the above considerations on the Si mass fraction in SiO2, a
silicate nature of these particles might be supposed. Parti-cles grouped by the F2 (Fig. 2b) are mainly siliciclastic and only a minor fraction is ascribed to volcanics. All of these particles share both the Si and Ca abundances (0.6 and 0.1, respectively), and the median ESV (3/3.5 µm3), the latter be-ing comparable with the ESV of F1 particles. Si abundances far above 0.4 suggest that these are silica particles. It should be also noted that, as particles in F1 and F2 show similar ESV but different Si abundance, differences in the particle density can be supposed between these two groups. Finally, particles with the highest score in F3 (Fig. 2c) are mainly ascribed to road dust and travertine samples and show Ca abundances around 0.4, which can be related to CaCO3.
The PCA solution found on the XEDS data set of particle elemental composition is thus coherent with the real miner-alogical nature (silicate or calcite) of particles, indicating that the sample-targeted internal standard approach applied to the quantification of particle composition provided reliable re-sults.
3.3 Mineralogy of samples and allocation of
individual particles
The mineralogical composition quantified by XRD analysis is reported in Table 2.
The main differences include the increas-ing amount of calcite (volcanics<siliciclastic rocks<marlstones<travertine), the absence of inosili-cates in siliciclastic rocks and travertine, the negligible amount of phyllosilicates in travertine and the considerable presence of quartz in siliciclastic rocks. All of these features are consistent with the geological processes involved in the formation of each rock type. Calcite is a geochemical marker of the sedimentary environment where rocks are formed, and it is associated with the chemical precipitation of calcium carbonate. As a consequence of that, while its presence in volcanic rocks is negligible, in the marine deposits (marlstones) it is dominant and in the siliciclastic series it represents the second most abundant mineral component after phyllosilicates.
Moreover, it is the almost exclusive component of traver-tine, generated by the precipitation of CaCO3 near the hot
hydrothermal springs of the Tivoli basin (Pentecost, 2005; Faccenna et al., 2010). The mineralogical composition of the silicate component in marlstones and siliciclastics dust is strictly related to the originating materials. Rock-forming processes (erosion, fluvial and marine transport, sedimenta-tion) support, in this case, the presence in the PM10fraction,
10
Figure 1.PCA of elemental ratios calculated on individual dust particles composition: score plots of factors (F1, F2, F3) with eigenvalue
higher than unity. V: volcanics; S: siliciclastics; RD: road dust; T: travertine.
Figure 2.Ca and Si abundances of particles with highest PCA score in F1(a), F2(b), or F3(c), plotted vs. the particle equivalent spherical
volume.
as phyllosilicates. Different processes must be considered in volcanic rocks, which explain the mineralogical composition of silicates observed in the PM10 resuspended from this
ge-ological material; specifically, crystallization is the main re-sponsible process, in this case.
Thus, the presence of most minerals observed in the PM10
from volcanic rocks is coherent with the magmatological framework of central Italy. Differently from the above con-siderations, however, the association kaolinite – quartz, ob-served by SEM XEDS microanalysis in this PM10dust type,
has to be ascribed to rock alteration (weathering). In this case, quartz is thus the product (with kaolinite) of the hy-drolysis reaction of feldspars (Jackson et al., 2010), and not a crystallization-derived phase.
Considering the results of the allocation procedure (Sect. 2.3), mineral particles in the PM10dust samples were
mainly classified as follows: phyllosilicates (kaolinite, smec-tite, and micas), representing more than half of the silicate (non-quartz) fraction of the totality of samples, tectosilicates (feldspar, chabazite, leucite, and plagioclase) and inosilicates
(clinopyroxene and amphibole), which contribute compara-bly to the rest of silicate fraction, quartz, and calcite. About 65 % (percent abundance) of total phyllosilicates are found in the volcanics, being mainly kaolinite (observed in the vol-canics only) and 60 % of total observed smectite. Micas are also frequently observed, mainly in the siliciclastics sample. Concerning tectosilicates, the overall contribution appor-tioned to the PM10 of each geological domain and of road
dust has been found to be 47 % in the volcanics, 20 % in the siliciclastic rocks, 33 % in the road dust, while it appears negligible in the marlstones. Inosilicates were observed in similar amounts, and solely in the volcanics and in the road dust. About half of quartz particles identified in the totality of PM10dust samples is allocated to siliciclastic rocks, while
volcanics, marlstone, and road dust contribute equally to the remaining fraction. Finally, within the non-travertine sedi-mentary rocks of this study, the marlstones provide the most important contribution of calcite particles in the PM10
Table 2.Average mineralogical composition (wt %) of dust samples by XRD analysis.
Volcanic Siliciclastic Marlstones Road dust Road dust Travertine∗
rocks rocks (Volcanics) (Travertine)
Phyllosilicates 57 52 26 7 – –
Tectosilicates 18 6 0.7 8.7 6 –
Inosilicates 26 – 1.5 22.7 10.2 –
Quartz 4 11 4 1.3 3 –
Calcite – 31 68 60.3 81 >90
∗After Pentecost (2005)
Figure 3. Total silicate (including quartz) and calcite amounts
(wt %) of dust samples, obtained by X-ray diffraction bulk analy-sis and SEM XEDS particle microanalyanaly-sis.
allocated to road dust. These results, obtained by the alloca-tion procedure, are in good agreement with the mineralogical composition by XRD (Table 2).
To assess the reliability of allocation, a mass closure ap-proach was used.
The particulate mass fraction of each mineral group in the PM10 (sum of particles mass within a mineral group,
per dust sample) was estimated from results of the alloca-tion after SEM XEDS microanalysis. Afterwards, the PM10
weight percent composition of the total silicate (including quartz) content and of the calcite content were calculated; these quantities were then compared to the corresponding quantity obtained by XRD analysis of the 50 µm sieved frac-tion of each dust sample, as reported in Fig. 3.
Although the travertine was not analyzed by XRD, since it can be considered a pure calcite term (Pentecost, 2005), results of the SEM XEDS microanalysis of the travertine dust have been reported for this sample too. In all dust sam-ples (excluding the case of travertine), a good comparability with analytical results of mineralogical composition by XRD are observed for mass estimates obtained from the allocation of individual particles. Besides indicating that the allocation
procedure produced reliable results, this also suggests that the silicate and calcite contents of the PM10and of the 50 µm
sieved fractions of dust are likely similar, as yet reported in literature (Rashki et al., 2013).
3.4 Connections between geochemical processes of
rock sources and the PM10fraction of minerals
The size distribution of resuspended geological materials is influenced by two important contributions: the physical prop-erties of particles (e.g. size and density), which affect the dust resuspension and transport; and the geological features of the rock source, which determine the particle mineralogi-cal identity. In this view, size distribution of the PM10
frac-tion has been discussed either for individual mineral species (quartz, kaolinite, feldspars, and calcite), and for the over-all local lithogenic dusts (volcanics, siliciclastic rocks and travertine); in the latter case the totality of mineral particles identified in each dust type was considered.
In Sect. 3.4.1, size distributions of individual mineral species have been investigated with respect to the clay fraction according to Claquin et al. (1999), Nickovic et al. (2012), and Journet et al. (2014), while in Sect. 3.4.2 vol-ume distributions (Formenti et al., 2014) of mineral species and of lithogenic dusts are discussed.
3.4.1 Clay fraction of minerals
In this part of the study the classified mineral particles were treated with respect to the geochemical processes which they can be related to, with the aim of relating the size distribution of each mineral species to the geochemical processes acting on the rocks to generate the PM10 fraction of that mineral
10
species for which the mass percentage in the clay fraction (particle size<2 µm) was calculated, on the basis of the par-ticle ESD. Mass percentages of mineral in the clay fraction of PM10 dust samples of this study were compared with those
obtained by Journet et al. (2014) for the modelled global yearly average composition of airborne minerals. With re-spect to the latter (abbr. gyac), the mineralogical composi-tion of the Rome local geological PM10shows the following
similarities, or discrepancies: (1) the amount of quartz in the clay fraction of the siliciclastic PM10(20 %) and of the
vol-canics PM10 (8 %) is significantly higher compared to the
gyac (4.9 %); (2) feldspars in the clay fraction of both the volcanics (4 %) and siliciclastic PM10(2.5 %) are
compara-ble to feldspars in thegyac(3.6 %); (3) kaolinite dominates the clay fraction of the volcanics PM10(63 %) and it is
neg-ligible in the other PM10dust types (ca. 2.5 %), while in the
gyac it represents 24.1 % of total mass; (4) smectite in the Rome local geological PM10ranges 3 to 10 %, that is lower
compared togyac(15.3 %).
With respect to the mineralogical profiles of PM10 dust
from sources located in North Africa (N.A.) and Saudi Ara-bia (S.A.) (Ganor et al., 2009), the dust samples of this study show the following differences: (1) large variability in terms of calcite content (up to 90 % in travertine), compared to PM10 from N.A. and S.A. (20–30 %); (2) large variability
in terms of tectosilicates (up to 20 % in volcanics) and clay minerals (up to 57 % in volcanics) compared to PM10 from
N.A. and S.A. (1–3 and 30–40 %, respectively); amount of quartz comparable to that in PM10 from N.A. and S.A. (2–
4 %) in the case of the siliciclastic PM10, but significatively
different in travertine (undetectable) and in volcanics (10 %). Moreover, the presence of inosilicates is not reported for the PM10from N.A. and S.A., while the latter show the presence
of gypsum, not observed in the PM10 dust samples of this
study.
Considering the distribution of particles in the clay and non-clay (ESD>2 µm) fractions of the mineral PM10of the
Rome area, main differences are observed between the vol-canics and the travertine types. In the volvol-canics PM10 the
weathering by-products (quartz, kaolinite and smectite) are comparably distributed in the two size fractions, indicating that weathering processes produce either small grain-sized crystals, and altered phases which grow on the surface of large crystals, resulting in larger particles. The crystallization phases produced in the volcanics PM10(feldspars and
pyrox-ene) are instead enriched in the non-clay size, as implied in the crystallization process.
Source-related differences between natural calcite from travertine and calcite from road dust were also evidenced. The clay/non-clay distributions of calcite in the PM10of
ei-ther the travertine dust and the road dust travertine-related, differ significantly from the clay/non-clay calcite distribution in the PM10of volcanics-related road dust. While in the first
case the calcite is comparably distributed in the clay/non-clay size, the mass percentage of this mineral in the road dust
volcanics-related is higher in the clay size (80 %) than in the coarser size (60 %). Since the presence of calcite in the vol-canics PM10 is negligible, calcite content in the PM10 road
dust collected in the volcanics can only be ascribed to the asphalt contribution.
It is thus reasonable that this anthropogenic source en-riches the size fraction below 2 µm (ESD) of calcite, more than the coarser one. This effect is less evident, instead, in the road dust travertine-related, where the lithological influence of travertine rocks assumes a major role in the clay/non-clay distribution of calcite.
3.4.2 Volume size distribution of the PM10fraction:
minerals and lithogenic dust types
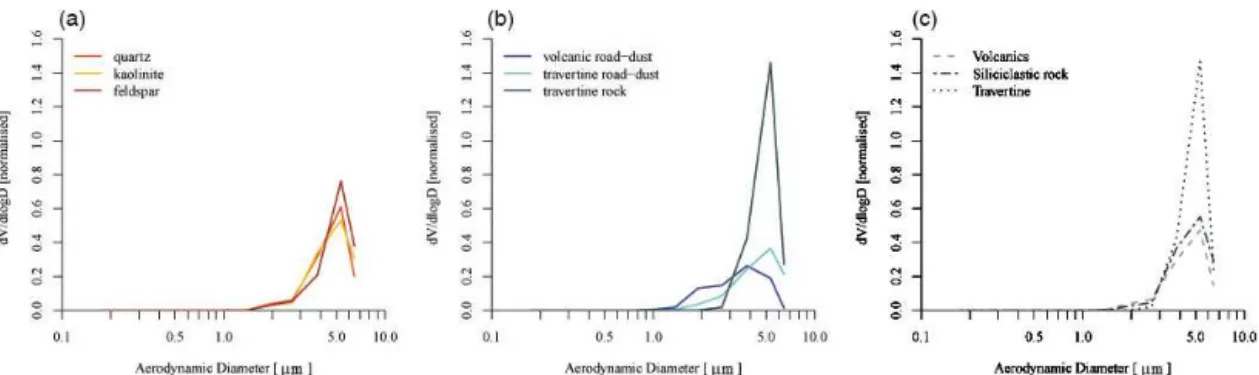
The volume size distributions of quartz, feldspars, kaolinite and calcite are reported in Fig. 4 vs. the aerodynamic diam-eter (a.d.); in this figure, particles have been grouped with respect to belonging to a given mineral species, without dif-ferentiating by geological domain. Figure 4a shows the dis-tributions of kaolinite, quartz, and feldspars, while in Fig. 4b distributions of calcite in the two different road dust types and in travertine are shown.
Volume distributions of the considered silicates are uni-modal, with overlapping maxima around 5 µm. Main differ-ences are in the peak width: weathering minerals, such as kaolinite, show a broader curve, compared to minerals from crystallization phases, e.g. feldspars. This is coherent with the above-described action of the weathering, of generating particles either in the clay fraction, and in the coarser size, which contributes to broaden the size range.
Quartz shows an intermediate behaviour, due to different processes acting on quartz formation: weathering in the vol-canics, crystallization in the siliciclastics.
The different nature of geochemical processes affects also volume distributions of the overall lithogenic dust types (Fig. 4c). Particularly, volcanics and siliciclastics dusts show broader distribution than travertine, due to the dominance of weathering, in the formation of lithogenic PM10 from
vol-canic and siliciclastic rocks, with respect to the importance of crystallization in the travertine domain.
More defined differences are highlighted among the vol-ume distributions of calcite from lithogenic or anthropic source: in PM10 from travertine, the volume distribution of
calcite shows a very narrowed shape, with maximum at 5 µm. Conversely, calcite of both road dust types shows broader distributions, extended to finer sizes, especially in the case of the volcanics-related road dust. In the latter, the curve is bimodal with maxima at 3.8 and 1.8 µm, while in the travertine-related road dust it is unimodal, with maximum at 5.3 µm similarly to calcite in travertine. The lithogenic or an-thropic nature of processes tuning calcite size also influence the height of volume distributions of calcite.
Figure 4.Normalized volume size distributions of most abundant silicates(a), calcite(b), and local dust types(c)in the PM10 fraction.
Calcite is differentiated by natural (travertine) or anthropic (road dust) origin.
explained in Sect. 3.3; the variability of particle size is thus limited by chemical – physical conditions which rule traver-tine formation. In the second case, the variety of mechanical solicitations affecting the surface of paved roads, e.g. abra-sion by vehicle riding, is described by a wider particle size range.
Discrepancies observed within volume distribution curves of Fig. 4 suggest also that individual particle densities may differ within the same silicate species or within calcite from different dust sources. It is acknowledged that the density of mineral particles may range significantly due to the petro-logical conditions (chemistry, kinetics, and thermodynamics involved in the crystallization process) associated with the different crystallization phases, by which mineral particles are formed.
In addition, some general considerations can be given on the particle density, by taking into account the distribution of particle mass percentage (discussed in Sect. 3.4.1) and ESD, with respect to the below/above 2 µm size threshold (coherently with the clay/non-clay distribution). Decreasing particle density should be expected from first to last of the following cases: (1) both mass percentage and ESD of par-ticles mainly distributed below 2 µm; (2) mass percentage mainly observed below the 2 µm size and ESD compara-bly distributed with respect to this threshold; (3) both mass percentage and ESD mainly distributed in the size fraction above 2 µm. In Fig. 4, first case can be related to the cal-cite of road dust volcanics-related (80 % of particles showing ESD<2 µm), while second case applies to quartz and kaoli-nite, and last case to feldspars and travertine calcite (60 and 80 %, respectively, of particles showing ESD>2 µm).
Height differences among volume distributions of the dust types can be thus explained in connection with the different presence of a given mineral species in a dust type. In partic-ular, while the content of kaolinite is higher in the volcanics than in siliciclastic dust, feldspars, and quartz are more abun-dant in the latter. It is thus possible that these minerals play contrasting roles in defining the average particle density of siliciclastic dust, and consequently its volume distribution.
Figure 5.Probability density function fitted to log-normal
distribu-tion of the volcanics and travertine PM10dust. Error bars represent
uncertainties of bin weight.
3.5 Microphysical, optical and radiative properties of
the volcanics and travertine PM10dust in
the Rome area
3.5.1 Microphysical properties
In Fig. 5 results of the fitting procedure to log-normal curve, applied to volcanics and travertine size distribution, are shown.
The curves are reported with respect to the particle phys-ical radius, as required by the 6SV radiative transfer code. The computed “chi squared” (χ2)of fitting are, respectively, 0.34 for volcanics and 0.69 for travertine. Considering 12 de-grees of freedom corresponding to the 13 size bins of the optical particle counter, both fitting are below the level of significance of 99.5 %. It is thus possible to refuse the null hypothesis that these curves cannot be fitted to a log-normal function. The following rm andσ values of volcanics and
10
used thus, as input parameters of 6SV code (Eq. 1):
rmvolc=1.64±0.29 µm, σvolc=1.85±0.23 µm; (1)
rmtrav=1.39±0.72 µm, σtrav=2.34±0.46 µm.
Results of fitting are in line with findings discussed by Ma-howald et al. (2014).
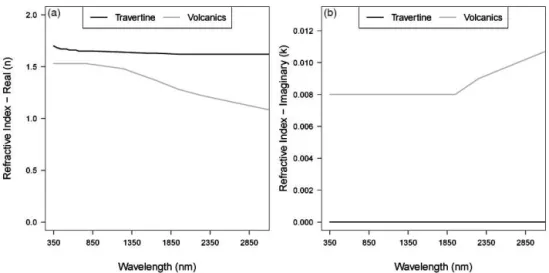
The other microphysical property required for 6SV runs is the refractive index. In Fig. 6 the real (n) and imaginary (k) part of the refractive index have been interpolated at the 20 wavelenghts of the 6SV code (350, 400, 412, 443, 470, 488, 515, 550, 590, 633, 670, 694, 760, 860, 1240, 1536, 1650, 1950, 2250, 3750 nm), following the spectral data of water-insoluble (Kokhanovsky, 2008; WCP-112, 1986) and calcite-rich dust (Ghosh, 1999) refractive index, respectively, related to volcanics and travertine. While the spectral trend of vol-canics refractive index follows the commonly adopted trend used in the radiative transfer modelling (RTM) of the dust component (Kokhanovsky, 2008), the travertine dust, being mainly composed of calcite, is a non-absorbing aerosol in the spectral range considered in this study, as in this range the imaginary part of calcite refractive index is close to zero (Sokolik and Toon, 1999; Gosh, 1999).
3.5.2 Optical properties
Optical properties of the volcanics and travertine contribu-tion to Rome’s local mineral dust have been modelled in the 20 wavelengths of the 6SV code. In Fig. 7 the single-scattering albedo (SSA) and the asymmetry parameter (g) are shown, which are critical to analyze the aerosol-induced at-ground radiative flux (Kassianov et al., 2007). The lower SSA of volcanics, with respect to travertine, attests that the volcanics dust absorbs the solar radiation in the visible (VIS) spectral domain, as commonly expected for mineral dust. Conversely, the SSA of travertine reflects the non-absorbing behaviour of this dust type.
In Fig. 7b the spectral dependence of the asymmetry pa-rameter (g) is shown for the volcanics and the travertine. As
gis higher in the volcanics, in this dust type particles show higher forward scattering than in the travertine, mainly in the near-infrared (NIR) spectral domain. These findings suggest that the local geological dust of the Rome area affects both the VIS and NIR spectral domains; consequently an influence on the radiative field is expected as well.
3.5.3 Downward radiative flux at BOA
The radiative modelling has been focused on the downward component of the radiative impact at BOA due to the vol-canics and travertine dust in the Rome area. This part of the study represents a preliminary investigation of the direct ra-diative effect of the local dust component on the solar radia-tion at the ground. In Fig. 8a the influence of both local dust types to the downward BOA solar irradiance (I) in the VIS and NIR spectral domain is shown.
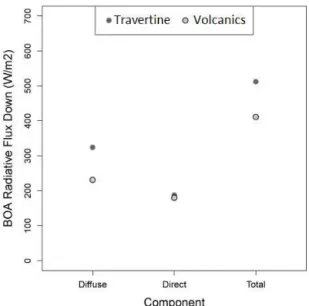
In order to evaluate the spectral dependence of the irra-diance on the mineralogical composition of dust, the vol-canics/travertine ratio is reported in Fig. 8b. In the VIS do-main, the irradiance seems not to be affected by the min-eralogical composition, as the BOA downward irradiance trends of the two dust types almost overlap. However, in the NIR a sharp discrimination between the radiative impact of the volcanics and that of the travertine dust is revealed. Fi-nally, the BOA downward flux obtained by integrating the downward solar irradiance over the solar spectral domain (250–4000 nm) is reported in Fig. 9.
Direct component calculated in presence of volcanics-only and in presence of travertine-only dusts show negligible dif-ferences, while the diffuse component depends strongly on the mineral composition. The scattered radiation of an atmo-sphere with travertine dust only shows a higher diffuse com-ponent than in the case when volcanics only is assumed.
As a matter of fact, in the Rome area the total BOA down-ward flux is greater for an atmosphere where the only aerosol component is the travertine dust with respect to the sole pres-ence of volcanics dust.
The evaluation of the radiative budget at surface of the lo-cal mineral dust in the Rome area has been performed com-puting the radiative forcing efficiency (RFE). The RFE is calculated by simulating the total BOA downward flux with the local dust component in three conditions of the AOT at 550 nm (0.2, 0.5, 0.7), to estimate the uncertainty on the sim-ulated RFE. The results highlight the stronger cooling effect at the surface in case of volcanics (−293±17 W m−2)with respect to travertine (−139±7 W m−2), with uncertainties
lower than 5 %.
The aerosol radiative behaviour follow the general trend explained in Gómez-Amo et al. (2011), that is aerosols with high SSA (low absorption, travertine in case) produce a de-crease in the absolute value of RFE, with respect to aerosols characterized by high absorption, like the volcanics. These results need to be confirmed by a more in-depth analysis on the influence of the local geological dust resuspended from topsoil on the Earth–atmosphere radiative balance, in the Rome area.
4 Conclusions
In this work, a knowledge gap was faced concerning how, and to which extent, the local mineral dust resuspended from rocks outcropped in a site/area may contribute to the PM10
en-Figure 6.Real(a)and imaginary(b)part of refractive index of the volcanics and travertine PM10dust.
Figure 7.Single scattering albedo(a)and asymmetry parameter(b)of the volcanics and travertine PM10dust.
vironment, individual-particle microanalysis aimed at deter-mining the mineralogical and microphysical properties of dust, and modelling of the dust radiative effects with respect to optical features.
Main results concern relationships found between the fol-lowing: (1) geochemical processes acting on the source rocks and mineral species associated with particles in the laboratory-resuspended PM10fraction of different local dust
types; (2) mineralogical composition of the PM10 dust and
variability of dust microphysical properties (refractive in-dex and size distribution); (3) dust-specific optical proper-ties (single-scattering albedo and asymmetry parameter) of the PM10 fraction, and total downward flux at BOA in the
visible and near infrared (VIS and NIR) spectral domains. First issue was discussed on all major outcropped domains in the Rome area (volcanic rocks, siliciclastic rocks, lime-stones, marllime-stones, and travertine), and on the distinction be-tween calcite from lithogenic source and calcite from paved
road dust, while the second and third issues focused on the compositional end member of local dust types (volcanics and travertine).
With the exception of pure calcite (associated with PM10
from the travertine domain (Tivoli basin), and from road dust), PM10 dust types of the studied area show
silicate-prevalent or calcite-silicate-prevalent compositions, depending on the outcropped source rocks: volcanics or siliciclastics in the first case, marlstones or limestones in the second case.
Rock weathering processes tune the size and mineral iden-tity of PM10 particles in the silicate-prevalent dust types,
more than other processes (e.g. debris formation, crystalliza-tion).
On the other side, chemical precipitation of CaCO3
10
Figure 8.BOA downward solar irradiance(a)of an atmosphere composed by only volcanics, or travertine, PM10dust, and volcanics to
travertine irradiance ratio(b).
Figure 9.Diffuse, direct, and total BOA downward radiative flux
(W m−2)over the 250–4000 nm spectral domain, simulated by the
6SV code.
Weathering processes can be related to larger size vari-ability observed for some mineral species (e.g. kaolinite and quartz), with respect to feldspars and to lithogenic calcite.
In the lithogenic PM10 of the Rome area, these
miner-als are instead mainly associated with crystallization or to CaCO3precipitation, occurring under defined chemical,
ki-netic, and thermodynamic conditions, which limit particle size and result in narrow volume distribution. Differences observed between calcite from lithogenic source and cal-cite from road dust suggest a major role of the variability of mechanical solicitations from vehicular riding on the parti-cle size of road dust calcite. Volume distribution of the lat-ter inlat-terestingly shows bimodal shape, broader width and
larger contribution to fine fraction, differing significantly from lithogenic calcite and from other investigated mineral species.
These findings indicate that the microphysical properties of different crustal components (e.g. road dust, dust from building activities, transported mineral dust, etc.) may differ consistently with source type; optical properties are reason-ably expected to differ consequently.
Spectral trends of the complex refractive index, assumed from literature and related to volcanics and travertine PM10,
show that in the VIS and NIR domains travertine PM10
is a non-absorbing dust, opposite to volcanics PM10. We
showed that these differences influence the diffuse compo-nent of BOA downward flux, which is higher in the sim-ulated case of an atmosphere with travertine-only aerosol, coherently with the non-absorbing behaviour of this dust type. Finally, it is important to underline that the above re-sults could be assessed only by considering the entire so-lar spectral domain, instead of limiting the investigation to the VIS region. The radiative effects of the two compo-nents in the 350–3750 nm spectral domain have been evalu-ated by the RFE; results show higher efficiency of volcanics (−293±17 W m−2)in surface cooling effect, with respect
to travertine (−139±7 W m−2), as expected for aerosol with
SSA smaller than 1 (Di Biagio et al., 2009, 2010), i.e. the volcanics dust in this case.
Further research on these issues is needed, thus, as it may aid improving knowledge on the local effects of the pres-ence of different crustal (natural or anthropic) components of aerosol at a specific site/area, in terms of aerosol interac-tion with solar radiainterac-tion and radiative effects at BOA.
Acknowledgements. Thanks are due to Sergio Lo Mastro (Roma Tre University, Department of Geology, Rome, Italy), for X-ray diffraction analysis of the dust samples of this study. The authors are also grateful to Andrea Valdrè (FEI Company, U.S.), for his valuable scientific and technical advice with SEM XEDS microanalysis. Finally, we are grateful to Alcide di Sarra (ENEA, Laboratory for Earth Observations and Analyses) for helpful comments and suggestions that greatly improved the radiative transfer issues in the manuscript.
Edited by: M. C. Facchini
References
Agnihotri, R., Mishra, S. K., Yadav, P., Singh, S., Rashmi, Prased, M. V. S. N., Sharma, C., and Arya, B. C.: Bulk level to individual particle level chemical composition of atmospheric dust aerosol
(PM5) over a semi-arid urban zone of western India (Rajasthan),
Aerosol Air. Qual. Res., 15, 58–71, 2015.
Aimar, S., Mendez, J. M., Funk, M., and Buschiazzo, D. E.: Soil properties related to potential particulate matter emissions
(PM10) of sandy soils, Aeolian Res., 3, 437–443, 2012.
Armstrong, J. T. and Buseck, P. R.: Quantitative chemical analysis of individual microparticles using the electron microprobe: theo-retical, Anal. Chem., 47, 2178–2192, 1975.
Bassani, C., Cavalli, R. M., and Pignatti, S.: Aerosol optical re-trieval and surface reflectance from airborne remote sensing data over land, Sensors, 10, 6421–6438, doi:10.3390/s100706421, 2010.
Bassani, C., Cavalli, R. M., and Antonelli, P.: Influence of aerosol and surface reflectance variability on hyperspectral observed ra-diance, Atmos. Meas. Tech., 5, 1193–1203, doi:10.5194/amt-5-1193-2012, 2012.
Buseck, P. R. and Pósfai, M.: Airborne minerals and related aerosol particles: Effects on climate and the environment, Proc. Natl. Acad. Sci. USA, 96, 3372–3379, Colloquium Paper, 1999. Caquineau, S., Gaudichet, A., Gomes, L., and Legrand M.:
Min-eralogy of Saharan dust transported over northwestern tropical Atlantic Ocean in relation to source regions, J. Geophys. Res., 107, 4251, doi:10.1029/2000jd000247, 2002.
Castaing, R.: Application des sondes électroniques à une méth-ode d’analyse ponctuelle chimique et cristallographique: publi-cation ONERA (Office national d’études et de recherches aéro-nautiques/ Institute for Aeronautical Research) N. 55 (PhD The-sis), University of Paris, Paris, 1951.
Choël, M., Deboudt, K., and Flament, P.: Evaluation of quantitative procedures for x-ray microanalysis of environmental particles, Microsc. Res. Techniq., 70, 996–1002, doi:10.1002/jemt.20510, 2007.
Choël, M., Deboudt, K., Osán, J., Flament, P., and Van Grieken, R.: Quantitative Determination of Low-Z Elements in Single At-mospheric Particles on Boron Substrates by Automated Scan-ning Electron Microscopy-Energy-Dispersive X-ray Spectrom-etry, Anal. Chem., 77, 5686–5692, 2005.
Choobari, O. A., Zawar-Reza, P., and Sturman, A.: The global dis-tribution of mineral dust and its impacts on the climate system: A review, Atmos. Res., 138, 152–165, 2014.
Claquin, T., Schulz, M., and Balkanski, Y. J.: Modeling the mineral-ogy of atmospheric dust sources, J. Geophys. Res., 104, 22243– 22256, 1999.
Cosentino, D., Cipollari, P., Di Bella, L., Esposito, A., Faranda, F., Giordano, G., Gliozzi, E., Mattei, M., Mazzini, I., Porreca, M., and Funiciello, R.: Tectonics, sea level changes and palaeoen-vironments in the early Pleistocene of Rome (Italy), Quaternary Res., 72, 143–155, 2009.
Costantini, E. A. C., Urbano, F., Aramini, G., Barbetti, R., Bellino, F., Bocci, M., Bonati, G., Fais, A., L’Abate, G., Loj, G., Mag-ini, S., Napoli, R., Nino, P., Paolanti, M., Perciabosco M., and Tascone, F.: Rationale and methods for compiling an Atlas of desertification in Italy, Land Degrad. Develop., 20, 261–276, doi:10.1002/ldr.908, 2009.
Costantini, E. A. C., Urbano, F., Bonati, G., Nino, P., and Fais, A.: Atlante nazionale delle aree a rischio di desertificazione, INEA, available at: www1.inea.it/pdf/atlante_desertificazione.pdf (last access: 31 March 2015), 2007.
D’Almeida, G. A.: On the variability of desert aerosol radiative characteristics, J. Geophys. Res., 92, 3017–3026, 1987. Davies, C. N.: Size distribution of atmospheric particles, Aerosol
Sci., 5, 293–300, 1974.
Di Biagio, C., di Sarra, A., Meloni, D., Monteleone, F., Piacentino, S., and Sferlazzo, D.: Measurements of Mediterranean aerosol radiative forcing and influence of the single scattering albedo, J. Geophys. Res., 114, D06211, doi:10.1029/2008JD011037, 2009. Di Biagio, C., di Sarra, A., and Meloni, D.: Large atmospheric shortwave radiative forcing by Mediterranean aerosol derived from simultaneous ground-based and spaceborne observations, and dependence on the aerosol type and single scattering albedo, J. Geophys. Res., 115, D10209, doi:10.1029/2009JD012697, 2010.
Di Biagio, C., Boucher, H., Caquineau, S., Chevaillier, S., Cuesta, J., and Formenti, P.: Variability of the infrared complex re-fractive index of African mineral dust: experimental estimation and implications for radiative transfer and satellite remote sens-ing, Atmos. Chem. Phys., 14, 11093–11116, doi:10.5194/acp-14-11093-2014, 2014.
di Sarra, A., Pace, G., Meloni, D., De Silvestri, L., Piacentino, S., and Monteleone, F.: Surface shortwave radiative forcing of dif-ferent aerosol types in the central Mediterranean, Geophys. Res. Lett., 35, L02714, doi:10.1029/2007GL032395, 2008.
di Sarra, A., Fuà, D., and Meloni, D.: Estimate of surface direct radiative forcing of desert dust from atmospheric modulation of the aerosol optical depth, Atmos. Chem. Phys., 13, 5647–5654, doi:10.5194/acp-13-5647-2013, 2013.
Dobrzhinsky, N., Krugly, E., Kliucininkas, L., Prasauskas, T., Kire-itseu, M., Zerrath, A., and Martuzevicius, D.: Characterization of desert road dust aerosol from provinces of Afghanistan and Iraq, Aerosol Air. Qual. Res., 12, 1209–1216, 2012.
Dubovik, O., Holben, B., Eck, T. F., Smirnov, A., Kaufman, Y. J., King, M. D., Tanré, D., and Slutsker, I.: Variability of absorption and optical properties of key aerosol types observed in world-wide locations, J. Atmos. Sci., 59, 590–608, 2002.
10
Evans, R. D., Jefferson, I. F., Kumar, R., Hara-Dhand, K. O., and Smalley, I. J.: The nature and early history of airborne dust from North Africa in particular the Lake Chad basin, J. Afr. Earth Sci., 39, 81–87, 2004.
Faccenna, C., Funiciello, R., and Soligo, M.: Origin and deposition of the Lapis Tiburtinus travertine, in: The Colli Albani Volcano, edited by: Funiciello, R. and Giordano, G., Geological Society of London, 215, ISBN: 978-1-86239-307-3, 2010.
Falkovich, A. H., Ganor, E., Levin, Z., Formenti, P., and Rudich, Y.: Chemical and mineralogical analysis of individual mineral dust particles, J. Geophys. Res., 106, 18029–18036, 2001.
Feng, G., Sharratt, B., and Wendling, L.: Fune particle emission potential from loam soils in a semiarid region, Soil Sci. Soc. Am. J., 75, 2262–2270, 2011.
Fletcher, R. A., Ritchie, N. W. M., Anderson, I. M., and Small, J. A.: Microscopy and microanalysis of individual collected particles, in: Aerosol Measurement: Principles, Techniques, and Applica-tions, 3rd Edn., edited by: Kulkarni, P., Baron, P. A., and Willeke, K., John Wiley & Sons Ltd, US, Chapter 10, 195–198, 2011. Formenti, P., Caquineau, S., Desboeufs, K., Klaver, A.,
Chevail-lier, S., Journet, E., and Rajot, J. L.: Mapping the physico-chemical properties of mineral dust in western Africa: miner-alogical composition, Atmos. Chem. Phys., 14, 10663–10686, doi:10.5194/acp-14-10663-2014, 2014.
Ganor, E., Stupp, A., and Alpert, P.: A method to determine the effect of mineral dust aerosols on air quality, Atmos. Environ., 43, 5463–5468, 2009.
Garcìa, O. E., Dìaz, A. M., Expòsito, F. J., Dìaz, J. P., Dubovik, O., Dubuisson, P., Roger, J.-C., Eck, T. F., Sinyuk, A., Der-imian, Y., Dutton, E. G., Schafer, J. S., Holben, B. N., and Garcìa, C. A.: Validation of AERONET estimates of atmo-spheric solar fluxes and aerosol radiative forcing by ground-based broadband measurements, J. Geophys. Res., 113, D21207, doi:10.1029/2008JD010211, 2008.
Geoportale Nazionale: available at http://www.pcn.minambiente. it/GN/ (last access: 31 March 2015), MATTM– Ministero dell’Ambiente e della Tutela del Territorio e del Mare, Italy, 2011.
Ghosh, G.: Dispersion-equation coefficients for the refractive index and birefringence of calcite and quartz crystals, Opt. Commun., 163, 95–102, doi:10.1016/S0030-4018(99)00091-7, 1999. Giampaolo, C. and Lo Mastro, S.: Analisi (semi) quantitativa delle
argille mediante diffrazione a raggi X, in: Incontri Scientifici, edited by: Fiore, S., Istituto di ricerca sulle argille, Vol. II, 109– 146, 2000.
Gill, T. E., Zobeck, T. M., and Stout, J. E.: Technologies for lab-oratory generation of dust from geological materials, J. Hazard Material, 132, 1–13, 2006.
Gómez-Amo, J. L., Pinti, V., Di Iorio, T., di Sarra, A., Meloni, D., Becagli, S., Bellantone, V., Cacciani, M., Fuà, D., and Per-rone, M. R.: The June 2007 Saharan dust event in the central Mediterranean: Observations and radiative effects in marine, ur-ban, and sub-urban environments, Atmos. Environ., 45, 5385– 5393, doi:10.1016/j.atmosenv.2011.06.045, 2011.
Hansell Jr., R. A., Reid, J. S., Tsay, S. C., Roush, T. L., and Kalash-nikova, O. V.: A sensitivity study on the effects of particle chem-istry, asphericity and size on the mass extinction efficiency of mineral dust in the earth’s atmosphere: from the near to thermal
IR, Atmos. Chem. Phys., 11, 1527–1547, doi:10.5194/acp-11-1527-2011, 2011.
Jackson, M., Deocampo, D., Marra F., and Scheetz, B.: Mid-Pleistocene Pozzolanic volcanic ash in ancient Roman concretes, Geoarchaeology, 25, 36–74, 2010.
Jeong, G. Y.: Bulk and single-particle mineralogy of Asian dust and a comparison with its source soils, J. Geophys. Res., 113, D02208, doi:10.1029/2007jd008606, 2008.
Journet, E., Balkanski, Y., and Harrison, S. P.: A new data set of soil mineralogy for dust-cycle modeling, Atmos. Chem. Phys., 14, 3801–3816, doi:10.5194/acp-14-3801-2014, 2014.
Kalashnikova, O. V. and Sokolik, I. N.: Importance of shapes and compositions of wind-blown dust particles for remote sensing at solar wavelengths, Geophys. Res. Lett., 29, 1398, doi:10.1029/2002GL014947, 2002.
Kalashnikova, O. V. and Sokolik, I. N.: Modeling the radiative prop-erties of non-spherical soil-derived mineral aerosols, J. Quant. Spectrosc. Ra, 87, 137–166, 2004.
Kandler, K., Benker, N., Bundke, U., Cuevas, E., Ebert, M., Knip-pertz, P., Rodríguez, S., Schütz, L., and Weinbruch, S: Chemical composition and complex refractive index of Saharan Mineral Dust at Izaˇna, Tenerife (Spain) derived by electron microscopy, Atmos. Environ., 41, 8058–8074, 2007.
Kandler, K., Schütz, L., Deutscher, C., Ebert, M., Hofmann, H., Jäckel, S., Jaenicke, R., Knippertz, P., Lieke, K., Massling, A., Petzold, A., Schladitz, A., Weinzierl, B., Wiedensohler, A., Zorn, S., and Weinbruch, S.: Size distribution, mass concentration, chemical and mineralogical composition and derived optical pa-rameters of the boundary layer aerosol at Tinfou, Morocco, dur-ing SAMUM 2006, Tellus, 61B, 32–50, 2009.
Kassianov, E. I., Flynn, C. J., Ackerman, T. P., and Barnard, J. C.: Aerosol single-scattering albedo and asymmetry parameter from MFRSR observations during the ARM Aerosol IOP 2003, At-mos. Chem. Phys., 7, 3341–3351, doi:10.5194/acp-7-3341-2007, 2007.
Kaufman, Y. K., Tanre, D., Gordon, H. R., Nakajima, T., Lenoble, J., Frouin, R., Grassl, H., Herman, B. M., King, M. D., and Teil-let, P.: Passive remote sensing of tropospheric aerosol and atmo-spheric correction for the aerosol effect, J. Geophys. Res., 102, 16815–16830, 1997.
Kim, H. K., Hwang, H. J., and Un Ro, C.: Single-particle character-ization of soil samples collected at various arid areas of China, using low-Z particle electron probe X-ray microanalysis, Spec-trochim. Acta, Part B, 61, 393–399, 2006.
Kokhanovsky, A. A.: Aerosol Optics. Light Absorption and Scat-tering by Particles in the Atmosphere, Springer, Germany, ISBN 978-3-540-23734-1, 2008.
Kotchenova, S. Y., Vermote, E. F., Levy, R., and Lyapustin, A.: Radiative transfer codes for atmospheric correction and aerosol retrieval: Intercomparison study, Appl. Optics, 47, 2215–2226, doi:10.1364/AO.47.002215, 2008.
Krueger, B. J., Grassian, V. H., Cowin, J. P., and Laskin, A.: Het-erogeneous chemistry of individual mineral dust particles from different dust source regions: the importance of particle mineral-ogy, Atmos. Environ., 38, 6253–6261, 2004.