• Nenhum resultado encontrado

Temporal and vertical variations of aerosol physical and chemical properties over West Africa: AMMA aircraft campaign in summer 2006

N/A
N/A
Protected

Academic year: 2017

Share "Temporal and vertical variations of aerosol physical and chemical properties over West Africa: AMMA aircraft campaign in summer 2006"

Copied!
15
0
0

Texto

(1)

www.atmos-chem-phys.net/10/8437/2010/ doi:10.5194/acp-10-8437-2010

© Author(s) 2010. CC Attribution 3.0 License.

Chemistry

and Physics

Temporal and vertical variations of aerosol physical and chemical

properties over West Africa: AMMA aircraft campaign in

summer 2006

A. Matsuki1,4, B. Quennehen1,2, A. Schwarzenboeck1,2, S. Crumeyrolle2,3, H. Venzac1,2, P. Laj1,2,5, and L. Gomes3

1Universit´e Blaise Pascal, Clermont Universit´e, Clermont-Ferrand, France 2Laboratoire de M´et´eorologie Physique, CNRS, Clermont-Ferrand, France

3Centre National de Recherches M´et´eorologiques, M´et´eo-France, Toulouse, France 4Frontier Science Organization, Kanazawa University, Japan

5Laboratoire de Glaciologie et G´eophysique de l’Environnement, CNRS, Grenoble, France Received: 24 December 2009 – Published in Atmos. Chem. Phys. Discuss.: 15 February 2010 Revised: 20 August 2010 – Accepted: 31 August 2010 – Published: 7 September 2010

Abstract. While the Sahelian belt in West Africa stretches in the border between the global hot-spots of mineral dust and biomass burning aerosols, the presence of West African Monsoon is expected to create significant vertical and tem-poral variations in the regional aerosol properties through transport and mixing of particles from various sources (min-eral dust, biomass burning, sulfates, sea salt). In order to improve our understanding of the evolution of the aerosol-cloud system over such region across the onset of the sum-mer monsoon, the French ATR-42 research aircraft was de-ployed in Niamey, Niger (13◦30N, 0205E) in summer 2006, during the three special observation periods (SOPs) of the African Monsoon Multidisciplinary Analysis (AMMA) project. These three SOPs covered both dry and wet periods before and after the onset of the Western African Monsoon.

State of the art physico-chemical aerosol measurements on the ATR-42 showed a notable seasonal transition in av-eraged number size distributions where (i) the Aitken mode is dominating over the accumulation mode during the dry season preceding the monsoon arrival and (ii) the accumu-lation mode increasingly gained importance after the onset of the West African monsoon and even dominated the Aitken mode after the monsoon had fully developed. The parameters for the mean log-normal distributions observed in respective layers characterized by the different wind regimes (monsoon layer, SAL, free troposphere) are presented, together with

Correspondence to:A. Matsuki (matsuki@staff.kanazawa-u.ac.jp)

the major particle compositions found in the accumulation mode particles. Thereby, results of this study should facili-tate radiative transfer calculations, validation of satellite re-mote sensors, and detailed transport modeling by partners within and outside the AMMA community.

Extended analysis of the chemical composition of sin-gle aerosol particles by a transmission electron microscope (TEM) coupled to an energy dispersive X-ray spectrome-ter (EDX) revealed dominance of mineral dust (aluminosil-icate) even in the submicron particle size range during the dry period, gradually replaced by prevailing biomass burning and sulfate particles, after the onset of the monsoon period. The spatial and temporal evolution from SOP1 to SOP2a1 and SOP2a2 of the particle physical and chemical properties and associated aerosol hygroscopic properties are remark-ably consistent.

1 Introduction

(2)

the largest global sources of both mineral dust and biomass burning aerosols (Woodward 2001; Bond et al., 2004).

Despite the recent advances in radiometry from satellite (Christopher et al., 2008; Winker et al., 2007), the accurate prediction of the aerosol radiative impact at the regional scale is still hampered by the difficulties in precisely describing the vertical extension of particle transport, modification, and in-teraction with cloud microphysics. This is particularly the case over regions such as West Africa, where the presence of the monsoon is expected to cause strong seasonal and spatial variation in the aerosol physico-chemical properties (size dis-tribution, shape, composition, hygroscopicity) through their transport, mixing, aging, sedimentation, and cloud process-ing.

The significance and paucity of measurements over the African continent have led to the coordination of several large-scale field campaigns such as Saharan Dust Experiment (SHADE) focusing on mineral dust outbreaks in West Africa (Tanr´e et al., 2003), the Saharan Mineral Dust Experiment (SAMUM-1) project in Northwestern Africa (Heintzenberg, 2009), and the Southern African Regional Science Initiative (SAFARI, 2000) in the southern Africa region that focus on biomass burning particles (Swap et al., 2003). The main scope of these past experiments has been focusing on the characterization of either the dust or biomass burning par-ticles.

The mixing between these two aerosol types (dust, biomass burning) and its impact on the radiative budget has been particularly addressed in campaigns such as the follow-up SAMUM-2 (Heintzenberg, 2009), the Dust and Biomass Experiment (DABEX) (Haywood et al., 2008), and Dust Out-flow and Deposition to the Ocean (DODO-1) (McConnell et al., 2008). These intensive measurement campaigns, deploy-ing amongst other research aircrafts over West Africa, have demonstrated the extent of mixing and westward transport of both aerosol types across the continent and over the Atlantic (Capes et al., 2008; Chou et al., 2008; Formenti et al., 2008). These measurements were held during the months of Jan-uary and FebrJan-uary, representing the dry season. DABEX and DODO-1 were organized jointly with the African Monsoon Multidisciplinary Analysis (AMMA) winter Special Obser-vation Period (SOP0).

The AMMA campaign is a major international project to improve our knowledge and understanding of the West African Monsoon (WAM) and its daily to inter-annual vari-abilities and the associated impacts on issues such as health, water resources, and food security. The atmospheric dust and biomass-burning aerosols play a major role in radiative forcing and in cloud microphysics, and thus are an impor-tant part of the WAM system which requires further study. An overview of the AMMA project can be found elsewhere (Redelsperger et al., 2006; Lebel et al., 2009).

To be contrasted with the previous measurement cam-paigns, our objective was to conduct in-situ characterization of aerosols before and after the onset of the summer

mon-soon. Therefore in 2006 the French research aircraft ATR-42 was deployed over Niamey during the three special obser-vation periods SOP1, SOP2a1, and SOP2a2 of the AMMA project.

An overall scope of this paper is to give an overview of the seasonal and spatial evolution of the aerosol size distribu-tion, chemical composidistribu-tion, mixing states, and hygroscopic nature of the atmospheric aerosols over West Africa across the onset of the characteristic summer monsoon. Although the frequent development and passage of Mesoscale Convec-tive Systems (MCS) is the key feature of the monsoon season over the studied area, the multiple interactions of individual MCS and the regional aerosol properties are not within the scope of this study and discussed more in detail by Crumey-rolle et al. (2008).

2 ATR-42 aircraft measurements

In order to carry out an extended aerosol in-situ character-ization of wide temporal and spatial coverage, the French ATR-42 research aircraft was deployed in Niamey, Niger (13◦30N, 0205E) during the three special observation pe-riods (SOPs) of the AMMA project. The aircraft joined the project during SOP1 (1–15 June 2006), SOP2a1 (1–13 July 2006), and SOP2a2 (2–19 August 2006). Each of the three SOPs represents “dry”, “monsoon onset”, and “high mon-soon (Wet)” periods, respectively. The dates and durations of the flights are summarized in Fig. 1. SOP1 was com-pleted before the monsoon onset when rainfall events were still scarce (Fig. 1). During the second observation period after 1 July, half of the flights were conducted following sig-nificant rainfall within the previous 24 h (Sa¨ıd et al., 2009).

The results presented here are based mainly on the verti-cal exploration flights conducted intensively in the low and mid troposphere (0.1–5 km a.s.l.) over the Sahel region in the vicinity of Niamey. One representative flight track of the ATR-42 aircraft is shown in Fig. 2. The interesting flights for this study were composed of 4–7 stacked hori-zontal legs during descents mostly centered over Banizoum-bou (13◦32N, 240E, 250 m a.s.l.), 55 km east of Niamey where the projects’ ground based observational supersite was located. In some flights during the fully developed monsoon period (i.e. SOP2a2), however, the flights were performed over the regions of the predicted passage of an approaching Mesoscale Convective System (MCS) or after the MCS had passed through.

(3)

Fig. 1.Time scale of the AMMA Special Observation Periods (SOP) and flight hours of the intensive aircraft measurements. Shaded areas correspond to the duration from take-off to landing of the ATR-42 aircraft. Flights indicated in black are the vertical exploration flights conducted in the vicinity of Niamey (13◦30N, 0205E), on which results in the current study are based on. Date of the 2006 monsoon onset and the transitional period are depicted as defined by Janicot et al. (2008).

Fig. 2.Geographical location of the measurement area (right panel) and representative flight pattern (left panel) of stacked horizontal legs of the ATR-42 aircraft (from 5 August 2006).

Only during the final SOP in August when the monsoon was at its peak, a counterflow virtual impactor (CVI) was in-stalled in addition to the CAI inlet for collecting cloud resid-ual particles. The CVI (Ogren et al., 1985) is designed to exclusively collecting cloud elements (cloud droplets and ice crystals), while rejecting interstitial aerosol particles. The counterflow of the CVI was constantly adjusted to maintain the diameter of the cloud elements entering the probe to be 5 µm (50% collection efficiency) or larger. The subsequent evaporation of cloud elements in the particle free and dry

return flow releases cloud residual particles. Further details on the CVI can be found elsewhere (Schwarzenboeck and Heintzenberg, 2000; Schwarzenboeck et al., 2000).

(4)

2.1 Particle concentration and size distributions

Measurements onboard ATR-42 involved particle sizing and counting by a scanning mobility particle spectrometer (SMPS) covering sizes 0.02<Dp <0.3 µm, and an optical particle counter (OPC, GRIMM model 1.108) covering sizes 0.3<Dp <2 µm. The SMPS was composed of a condensa-tion particle counter CPC (TSI model 3010) and a differ-ential mobility analyzer (DMA) as described by Villani et al. (2007). Collected data were combined to provide a con-tinuous size distribution between 0.02 and 2 µm every 2 min. The size distributions measured during each SOP are pre-sented in this report by grouping them into those measured within the “monsoon layer”, “Saharan air layer (SAL)”, and the “free troposphere” above the SAL. The mean distribu-tions given for monsoon layer and SAL are based on averag-ing over 200–400 spectra.

It must be noted that, SMPS and OPC work under differ-ent principles and are measuring differdiffer-ent aerosol properties. Since there was no overlap of SMPS (0.02<Dp <0.3 µm) and OPC (0.3<Dp <2 µm) measured size ranges, OPC data are corrected using complex refractive indices of 1.528– 0.029i for the monsoon layer and 1.526–0.015i for the SAL layer (no correction was applied for the free troposphere) to take into account the OPC sensitivity to aerosol optical prop-erties. The OPC size distribution data have been recalculated using Mie code (Bohren and Huffmann, 1983) for the above complex refractive indices. The above indices (for monsoon layer and SAL) have been deduced, using the complex re-fractive indices of chemical compounds determined by Raut and Chazette (2008) and the mass-linear internal mixing rule prescribed by Horvath (1998). After the correction, SMPS and OPC data were plotted together and were then fitted. The averaged data are simply plotted as they were, taking into ac-count the recalculated OPC size spectra of monsoon and SAL layers.

Particles were most likely sized at relative humidities be-low the typical deliquescence points, thus the effect of parti-cle growth on measured partiparti-cle size is considered minimal. This was certainly the case for the SMPS having dried sheath air incorporated in the system. Also, by comparing ambient dew point temperature profiles with the measurement condi-tions in the onboard OPC, relative humidity in the instrument was estimated to remain below 50% in the lowest 1km during all flights, and even lower for higher altitudes (e.g. RH less than 25% and 20% at 2 km and 3 km, respectively). The de-creasing trend is due to the larger gap between ambient and almost constant temperature in the aircraft cabin (approxi-mately 35–38◦C). Furthermore, pressure inside the measure-ment lines resembled that of the ambient air conditions out-side the aircraft.

In parallel, a second set of SMPS and OPC instruments measured sizes of particles that have been heated up to 285◦C in a thermo-desorption column. When the non-heated spectrum is considered as “reference”, comparison with the

heated spectrum provides indirect information on the bulk aerosol composition. The instruments were cross-checked before the campaign in the laboratory, and the SMPS systems participated in EUSAAR (EUropean Supersites for Atmo-spheric Aerosol Research, http://www.eusaar.net/index.cfm) intercomparison workshops at IfT (Leibniz Institute for Tro-pospheric Research). Also, we inter-compared the pairs of SMPS and OPC without the thermo-desorption column be-fore each flight, (thus, bebe-fore starting to heat the column to 285◦C). We found that the spectra of the both SMPSs over-lap fairly well and relative error was less than 10%.

Particles consisting of sulfuric acid and other volatile com-pounds (e.g., ammonium nitrate, ammonium chloride), were found to evaporate at temperatures between 70 and 150◦C, typically at 100–110◦C for sulfuric acid (Clarke et al., 1987; Pinnick et al., 1987; O’Dowd and Smith, 1993; Smith and O’Dowd, 1996; Cantrell et al., 1997; Kreidenweis et al., 1998). Ammonium sulfate and bisulfate were found to evap-orate at temperatures between approximately 150◦C and 220◦C (Clarke et al., 1987; Pinnick et al., 1987; Rood et al., 1987; O’Dowd and Smith, 1993; Hudson and Da, 1996; Smith and O’Dowd, 1996). Also, Nitrate (i.e., often in the form of NH4NO3) is found to be even more volatile than sulfate (Bassett and Seinfeld, 1984; Rood et al., 1985; O’Dowd and Smith, 1993). Thus, particles surviving after being heated to 285◦C can be termed as those mostly made of refractory materials (e.g. sea salt, soot, mineral dust, some refractory organic carbon), otherwise the particles should be mainly composed of volatile species (e.g. sulfates, organic carbon, etc.). Possibility remains however, that some very volatile materials such as low molecule volatile organic com-pounds (VOC) may be lost during the transfer to the instru-ments already at the reference temperatures.

In addition, concentration of cloud condensation nuclei (CCN) was measured using a static thermal gradient diffu-sion chamber (model 100-B, University of Wyoming). De-tails on the current CCN measurement can be found else-where (Crumeyrolle et al., 2008). In brief, CCN number concentrations were determined at supersaturations (SS) of 0.2, 0.4, 0.6, 0.8 and 1%, providing one CCN spectrum ev-ery five minutes. A condensation particle counter (CPC, TSI model 3010) was monitoring total ambient aerosol concen-tration (CN) for particles larger than 10 nm. The combination of the two instruments provided the CCN/CN ratio.

2.2 Sampling and analysis

(5)

(1013 hPa, 293 K). This means in practice that supermi-cron particles are selectively found on the first stage due to the larger particle density found in the actual atmosphere (e.g. about 2.7 g cm−3for dust particles), while those on the second stage are representative of the accumulation mode (0.1<Dp <1 µm) particles.

The frequency and duration of the individual samples taken during the flights has been a function of the flight pat-terns of every individual flight (with number and altitude of stacked horizontal flight legs). Typically, per flight, 2–6 sam-ples were collected in different altitudes ranging from 0.4 km to 5 km a.s.l., each sample lasting 15–20 min (Fig. 2). For SOP2a2, few cloud residual samples were made via CVI in the presence of stratocumulus clouds.

Collodion film on a nickel support (MAXTAFORM Refer-ence finder grid, type H7, 400 mesh) was chosen as the sam-pling substrate. After the flight, the particle-laden grids were kept sealed under dry condition (RH<40%) until they were analyzed in the laboratory on individual particle basis.

Morphology and elemental composition of individual par-ticles were analyzed by a series of electron microscopes cou-pled to energy dispersive X-ray spectrometers. The samples were imaged firstly under a digitized transmission electron microscope (TEM, Hitachi H-7650) to obtain high resolution images of the particles. About 10 fields of view with constant magnification (at x3000 and x10000 for the first (coarse) and second (fine) stage, respectively) were imaged randomly over a sample at 120 kV acceleration voltage.

Then, by following the references marked on the grids, the imaged particles collected on the first stage (i.e. coarse par-ticles) were located again under a scanning electron micro-scope (SEM, JEOL, JSM-5910LV) coupled to an energy dis-persive X-ray spectrometer (EDX, Princeton Gamma-Tech, Prism2000), and X-ray spectra were monitored from the individual coarse particles at 20 kV acceleration voltage. The fine particles collected on the second stage (i.e. sub-micron particles) were analyzed under another TEM (JEOL-2000FX) coupled to an EDX (TRACOR Northern 5502) op-erating at 200 kV. X-ray peaks of lighter elements such as C, N and O were not included in the quantification of the rela-tive atomic ratio, due to the uncertainties caused by the sig-nificant absorption of low energy X-rays within the samples, and also by the fact that the collodion film substrate itself contains some C and O.

In total, about 3600 (about 50 per sample) coarse parti-cles were analyzed individually under SEM-EDX on manual basis, while 1000 (about 25 per sample) fine particles were analyzed by TEM-EDX. The smaller counts are due to more demanding manual identification and analysis of fine parti-cles under TEM. Still, electron microscopy is a preferential tool for directly obtaining detailed information on the parti-cle shape, elemental composition and mixing states.

(6)

Fig. 4. Mean particle number size distributions observed in the monsoon layer, Saharan air layer (SAL), and free troposphere from vertical exploration of the atmosphere in the vicinity of Niamey dur-ing the three AMMA SOPs corresponddur-ing to “dry”, “monsoon on-set” and “high monsoon” periods. Error bars indicate 1 standard deviation. Open legends denote the averaged raw spectra and solid curves are the fitted log-normal size distributions.

3 Results and discussion

3.1 Air-mass transport patterns

In order to study the origin of the air-masses arriving at the aircraft measurement positions, 5-day backward trajectory calculations have been performed using METEX model de-veloped by NIES-CGER (Zeng et al., 2003). At least 4–7 trajectories were calculated for each flight, depending on the number of stacked horizontal legs. Figure 3 shows the com-pilation of trajectories arriving at the aircraft measurement positions in the vicinity of Niamey during the three intensive observational periods SOP1, SOP2a1, SOP2a2.

A complete turnover of the wind regimes was typically found across an altitude of roughly 1500 m (transition tween blue and green colors in Fig. 3). The transition be-tween the monsoon flux and the Saharan air flow known as the Inter Tropical Discontinuity (ITD) on the ground surface was always located north of Niamey throughout the three SOPs (Canut et al., 2009). Thus, as it is evident in the air-mass trajectories, the lowest part of the troposphere was most frequently occupied by the cool and moist monsoon flux ap-proaching from south-west. The monsoon flux was progres-sively gaining strength and can be traced back to the Gulf of Guinea especially during SOP2a2. The layer of warm and dry Saharan air layer (SAL, or so-called Harmattan) was per-sistently arriving from east to north-east due to the presence of the African Easterly Jet (AEJ) along the semi-arid regions of the Sahel belt.

An important change identified between dry and subse-quent monsoon periods through our aircraft soundings has been the decrease in vertical extent of the planetary boundary layer (PBL) due to the moistening of the ground by rainfall, and to the consumption of available energy by evaporation instead of PBL heating (Sa¨ıd et al., 2009). During the first two SOPs, as most of the flights were conducted during the middle of the day (Fig. 1), it was often the case that the PBL top (SOP1: 1600m; SOP2a1 1400m) had already reached the shear zone between the monsoon layer and SAL, hence the height of the wind rotation was typically found close to the PBL top or even below. Contrary to the first two SOPs, the PBL top during SOP2a2 (850 m) was often way below the shear height due to the decreasing PBL depth. According to the UHF observations by Kalapureddy et al. (2009) in Ni-amey in 2006, the shear height or the monsoon depth reached on average 1500 m before the monsoon onset, and dropped to 1200m during the monsoon period. The wind rotation heights represented by the trajectories correspond rather well with the observed monsoon depth.

It is also worth noting that there was another wind regime (free troposphere) at even higher altitudes (4-6km), where the air-mass arrived after making a descending anticyclonic turn around the Saharan high (Cook, 1999).

(7)

Table 1.Parameters (number concentration (ni), geometric standard deviation (σi), and number median particle diameter (mi)) for the mean particle size distributions shown in Fig. 4, expressed as the sum of four log-normal modes.

SOP1 (dry) SOP2a1 (monsoon onset) SOP2a2 (high monsoon)

i = 1 i = 2 i = 3 i = 4 i = 1 i = 2 i = 3 i = 4 i = 1 i = 2 i = 3 i = 4

Monsoon Layer

ni(cm−3) 1651 329 9.9 3.6 1471 322 6.3 2.0 992 510 2.0 0.3

σi 1.69 1.32 1.33 1.46 1.70 1.32 1.31 1.48 1.68 1.22 1.35 1.30

mi(nm) 73 195 555 1473 74 191 550 1400 73 197 559 1481

Saharan Air Layer (SAL)

ni(cm−3) 1303 227 10.6 2.4 1213 299 6.9 1.3 812 421 2.7 0.3

σi 1.65 1.32 1.41 1.54 1.72 1.33 1.37 1.66 1.70 1.23 1.35 1.38

mi(nm) 75 191 627 1930 76 192 588 1695 73 199 574 1588

Free troposphere

ni(cm−3) 314 309 10.2 3.1 421 196 7.7 1.3 221 126 2.0 0.2

σi 1.49 1.42 1.31 1.36 1.71 1.37 1.35 1.47 1.62 1.18 1.21 1.21

mi(nm) 70 161 603 1841 75 190 557 1688 62 181 525 1448

changes in wind direction, and are expected to show strong seasonal and spatial variations depending on the arriving al-titudes.

3.2 Particle size distributions

The overview of the particle number size distributions mea-sured during the three SOPs is shown in Fig. 4. The size dis-tributions in the particle diameter range of 0.02<Dp <2 µm measured by the SMPS and OPC in each SOP were grouped into those measured within the monsoon layer, Saharan air layer (SAL), and the free troposphere above the SAL. Since the trajectories arriving in the highest altitude range (4–6 km) showed markedly different (vertical) transport patterns as compared to those in SAL (Fig. 3), the related aerosol size distributions were averaged separately and denoted as those representing the “free troposphere”.

The parameters of log-normal distributions fitting the mean number size spectra per SOP and per atmospheric layer explored with the ATR-42 are presented in Table 1. We have to note that averaging particle size distributions for similar air-mass backward trajectories (i.e. monsoon layer, SAL, or free troposphere), as presented here, gave minimum vari-abilities within corresponding size spectra. The varivari-abilities were more pronounced, when categorizing the number size distributions according to constant altitude ranges (not pre-sented here).

During SOP1 (dry period), a pronounced Aitken mode (centered aroundDp=70–80 nm) has been observed espe-cially in the monsoon layer, besides a rather weak accumula-tion mode (Dparound 200 nm). This is in sharp contrast to the size distributions observed during SOP2a2 (high mon-soon period), where the Aitken mode was less prominent and the accumulation mode centered between Dp=200– 220 nm largely dominating over the Aitken mode (Fig. 4). Particle number size distributions observed in the transitional SOP2a1 (monsoon onset period) indeed showed

intermedi-Fig. 5. Vertical profiles of volatilized volume fraction ((Vref – V285)/Vref) derived by comparing the reference and heated (285◦C) volume size distributions. The considered size range is limited to 20< Dp <1000 nm.

ate characteristics with respect to the two aerosol modes de-scribed above for adjacent periods SOP1 and SOP2a2.

3.3 Particle volatility

(8)

Fig. 6. Frequency distribution of various CCN/CN ratios (at 0.4% super saturation) measured in different wind regimes (SAL + free troposphere vs. Monsoon layer) during SOP2a1 (monsoon onset pe-riod) and SOP2a2 (high monsoon pepe-riod).

We plotted the volatilized fraction as a function of alti-tude in Fig. 5 for all the aircraft soundings performed during the three observational periods SOP1, 2a1, and 2a2. Each data point is represented by a corresponding pair of reference and heated spectra obtained every 2 min (duration of SMPS scans). We have to note that the integration of reference and volatilized particle volumes is limited here to the size range of 20–1000 nm in order to accentuate the volatilized fraction in the accumulation mode particles.

The major information that can be drawn from Fig. 5 is that submicrometer aerosol is much less volatile during SOP1 (dry season), as compared to SOP2a1 (monsoon on-set) and SOP2a2 (high monsoon). The higher volatility of the aerosol after the onset of the monsoon seems to increase from SOP2a1 to SOP2a2. The volatile aerosol stems par-ticularly from the 100–300 nm accumulation mode particles. Nevertheless, also during SOP2a1 and 2a2, a fraction of the particles seems to be as refractory as the largely non-volatile submicrometer aerosol population during SOP1.

Moderate volatility found during SOP2a1 (monsoon on-set period) possibly reflects the intermediate mixing states undergoing seasonal transition from dry to monsoon period. It is worth emphasizing that the volatility was considerably small in the monsoon layer during SOP2a2 as compared to the overlying layers. If any different, then volatilized frac-tion in the monsoon layer during SOP2a1 also tended to be slightly smaller than that found in the SAL and free tropo-sphere.

Based on the current volatility measurement, it is clear that there was a significant seasonal transition in the fraction of refractory materials contained in the fine particle population. Vertical distributions showed that volatilizing volumes do not

significantly change with altitude during the first two SOPs, while it was considerably different during SOP2a2. Since the particle volatility shown in Fig. 5 is limited to 20–1000 nm range, this finding suggests that the fine particle composition may be significantly different between the monsoon layer and SAL especially during the wet period (SOP2a2).

The volatility behavior of aerosol particles in the size range 1–2 µm did not show the same volatility trends as ob-served for submicrometer aerosol. Indeed, these supermi-crometer particles are much more refractory with respect to temperature (and thus, less volatile) and show no clear trends when comparing periods SOP1, 2a1, and 2a2. The latter re-sult is certainly due to the fact that supermicron particles are predominantly composed of non-volatile coarse mode min-eral and sea salt particles. Detailed particle composition for the supermicron particles can be found elsewhere (Matsuki, 2010).

3.4 CCN concentration

At a first glance, the cloud nucleating properties are con-trolled by particle size and by the amount of soluble mate-rial contained in the particles or coating the particles. The range of CCN0.4%/CN ratios (CCN concentration relative to

total CN concentration at 0.4% supersaturation) measured in the different wind regimes (SAL & free troposphere vs. Monsoon layer) during SOP2a1 (monsoon onset period) and SOP2a2 (high monsoon period) are summarized in Fig. 6 (Note that the CCN chamber was not onboard the aircraft during the dry period). Higher CCN/CN ratio indicates that there were more CCN active particles in the entire particle population (Dp >10 nm).

Moderate values of CCN/CN ratios were typically found in the monsoon layer during both periods, with about 90% of the data points within the range CCN/CN<0.4. Higher ratios were more frequently found in the overlying SAL and free troposphere. In particular, the data points in the range CCN/CN >0.4 accounted for nearly 40% of all measure-ments in the SAL & free troposphere during SOP2a2 (high monsoon period), including some points even in the range CCN/CN>0.8.

(9)

Fig. 7.Relationship between CCN/CN ratio (at 0.4% super saturation) vs. number fraction of particles in CCN relevant sizes (101<Dp< 288 nm) over total CN concentration. Average plots representing the 4 different populations are shown in larger circles and the error bars indicate 1 standard deviation.

measurement and compared against the total CN concentra-tion measured by the CPC counter (TSI model 3010) to ob-tain the ratio CN101-288nm/CN.

In the monsoon layer, CCN/CN ratios were mostly con-fined to the range<0.4 both during SOP2a1 and SOP2a2 as we saw in Fig. 6. However, there was a rather distinct difference between the two periods in terms of the number fraction of larger particles (CN101-288/CN). This can be in-terpreted such that there may be less CCN active particles during SOP2a2 despite the increased number of particles in the CCN relevant sizes.

In the overlying SAL and free troposphere, there is signif-icant scatter in the plot and the difference between the two periods is less distinct as compared to the monsoon layer. Still, it is noteworthy that many data points (40%) are found beyond the ratio CCN/CN>0.4, especially during SOP2a2. This is an indication that the particles in the SAL and free troposphere were more frequently occupied by CCN active particles. The increased CCN/CN fraction may partly be at-tributed to the increased fraction of particles in CCN relevant sizes, however, the range of observed CN101-288/CN ratios was not particularly higher in SAL, again highlighting the difference between the monsoon layer and overlying layers especially during SOP2a2.

From the plots in Fig. 7, we can crudely deduce that the particles in the monsoon layer during SOP2a2 have been relatively hydrophobic (at least less hygroscopic), whereas those in the SAL and free troposphere have been more hy-groscopic. Interestingly, the volatility profiles (Fig. 5) also showed higher values especially in SAL during SOP2a2 (high monsoon period). Such coincidence between the

par-ticle volatility and CCN activity suggests that the volatilized material is at the origin of the enhanced hygroscopicity of the particles. The above observations indicate that the particles transported in the SAL layer during SOP2a2 were particu-larly CCN active (i.e. large and hygroscopic).

3.5 Particle identification

Particles collected by the two-stage impactor were later ana-lyzed on individual particle basis under electron microscopes (SEM and TEM) coupled to EDX system to study what ex-actly have been the chemistry and mixing states of the mea-sured particles.

Coarse (thus supermicron) particles collected on the first stage of the impactor were analyzed by SEM-EDX. In gen-eral, these coarse particles were dominated by dust particles. Significant number of sea salt particles appeared only during SOP2a2 within the prevailing monsoon flux where the air mass can be traced back to the gulf of Guinea (Fig. 3). An internal mixture of the two species was hardly found. Details on the coarse particle analysis and results can be found in a companion paper (Matsuki et al., 2010).

Here, we put more emphasis on the accumulation mode particles collected on the second stage of the impactor and analyzed under TEM-EDX, since they constitute an impor-tant fraction of the aerosol by number, and are hence relevant for studying radiative effects and CCN properties of aerosol populations as a whole.

(10)

Fig. 8. Electron micrograph and X-ray spectrum of representative submicron particles collected through the AMMA 2006 campaign over West Africa. Peaks of Nickel come from the Ni support, while Carbon and Oxygen are partly from collodion film used as the substrate.

and X-ray spectra can be found in Fig. 8. Other minor species included sea salt like particles, carbonaceous parti-cles either in typical chain-like aggregate of soot partiparti-cles or those giving only the X-ray peak of C. Dust particles can be distinguished as aluminosilicate clay minerals. Most of these particles showed characteristic morphology in the form of hexagonal flakes, and abundance in Al and Si elements, 35% of which can be identified as particles made of kaolinite since no other element such as Na, Mg, K, Ca was detected. For the remaining fractions, it was difficult to distinguish the mineral species from the morphology and elemental compo-sition, and thus, illite, chlorite or montmorillonite remain as the likely candidates.

Although biomass burning particles may sometimes re-semble ammonium sulfate particles in morphology, they of-ten contain K in addition to S. Although C and O should make an important fraction of such particles supposedly composed of organic compounds, due to the difficulties re-lated to the quantification of such lighter elements, we relied on the combination of K and S (or Cl) as evidence for the

biomass burning origin. Although K in fine particle fraction not attributable to mineral dust or sea salt can be regarded as an indicator of biomass burning (Andreae, 1983), there may be a slight chance that the number of biomass burning parti-cles is overestimated since some non-smoke sulfate may also contain K (e.g. fossil fuel burning and waste incineration).

(11)

Electron-transparent spherical particles enriched in S can be termed as sulfate particles. Absence of satellite structure (or droplet rings) typically found with sulfuric acid droplets or ammonium bisulfate particles (Bigg, 1980) is an indica-tion that they are neutralized most probably by ammonium. Sulfate particles with satellite structure were spotted only in the maritime air-mass over the gulf of Guinea, during which the aircraft made several southerly excursions to Cotonou, Benin (6◦22N, 225E). Otherwise, sulfate particles over the Sahel region in the vicinity of Niamey typically showed more neutralized features. Sulfate particles also tend to evap-orate under strong electron irradiation, suggesting closer link with the observed volatility.

The relative abundance of the major particle types is sum-marized in Fig. 9. All analyzed particles were grouped into those collected within monsoon layer and overlying layers (SAL + free troposphere), and the abundance of each parti-cle type was compared between the three periods. To show the range of uncertainties in the counting statistics resulting from the limited number of analyzed particles, 95% confi-dence intervals (Weinbruch et al., 2002) were calculated and given in Fig. 9.

During the dry season (SOP1), mineral dust was the pre-dominant particle group in the accumulation mode particles in all altitudes. Then, the fraction of dust particles dropped continuously during the following two SOPs (monsoon on-set and high monsoon periods). This decrease in the fraction of mineral dust particles was compensated by the prevailing biomass burning and sulfate particles.

The relative abundances of the three particle groups were rather similar between the monsoon layer and overlying lay-ers (SAL and free troposphere) during the first two SOPs (dry and monsoon onset). Then, there was a marked drop in the dust fraction especially in the monsoon layer during SOP2a2, which is compensated by the exceptionally large fraction of biomass burning particles.

The results of the single particle analysis (Fig. 9) are in very good agreement with the study of physical properties such as the particle volatility (Fig. 5). The low volatilized fractions (<0.4) observed during SOP1 (dry period) are con-sistent with the dominance of the non-volatile submicron dust particles both in the monsoon layer and SAL. Whereas large compositional difference between the monsoon layer and SAL as suggested by the particle volatility measurements during SOP2a2 (Fig. 5) also is confirmed by the remarkably large fraction of biomass burning particles in the monsoon flux (Fig. 9).

3.6 Particle mixing states and hygroscopicity

As mentioned previously in Sect. 3.4, the CCN/CN ratio (Fig. 6) was unexpectedly low in the monsoon layer during SOP2a2 despite the increased number of particles in CCN relevant sizes (Fig. 4). The monsoon layer was found to be associated with the smallest contributions of mineral dust

Fig. 9.Relative abundances of mineral dust, biomass burning, and sulfate fractions in submicron particles (Fig. 8) collected in SAL (+ free troposphere) and monsoon layer during the three SOPs. Er-ror bars indicate 95% confidence intervals. Numbers of analyzed particles by TEM-EDX are indicated in corresponding colors.

fraction (Fig. 9). Mineral particles are generally considered as “more insoluble” particles. Instead, largest fractions of biomass burning particles were found in these altitudes. The highest range of CCN/CN ratio was found rather in the over-lying SAL and free troposphere during SOP2a2, where the contribution of mineral dust was even larger as compared to monsoon layer (Fig. 9).

To interpret our findings, experimental evidence can be found, which proves that freshly produced biomass burning particles can be rather hydrophobic, whereas atmospheric ag-ing turns them into more hygroscopic particles. Kotchen-ruther and Hobbs (1998), for example performed direct mea-surements of the hygroscopicity of smoke particles in Brazil, and observed extremely low hygroscopic growth of fresh smoke particles. They also showed increased growth for more aged smoke plumes unaffected by other species. This can be attributed to the secondary production of more hygro-scopic species such as sulfate.

(12)

Fig. 10.Variations in atomic ratio (or molar ratio) of S relative to K found within individual biomass burning particles collected during SOP2a2 (monsoon period).

factor>1.2), indicating the accumulation of secondary sol-uble components (Maßling et al., 2003). Other processes leading to the enhanced hygroscopicity of initially hydropho-bic organic particles may include conversion of large organic compounds into simpler organic acids via aging (Gao et al., 2003).

Mass fraction of potassium can be used as a good indica-tor for the aging of smoke particles, since aged smoke par-ticles show enrichment of species associated with secondary aerosol production such as sulfur in the form of sulfate (Reid et al., 2005). Freshly emitted biomass burning particles are reported to contain more Cl and its replacement by S can be recognized as the sign of aging in the atmosphere (Li et al., 2003; Mouri et al., 1996). In order to compare the degree of aging, the range of atomic ratios (S element relative to K) found within individual biomass burning particles collected during SOP2a2 are summarized in Fig. 10.

Figure 10 shows that nearly half of the total biomass burn-ing particles collected in the SAL and free troposphere had very high S to K atomic ratios (S/(S+K)>0.8), indicating significant secondary production of sulfate. On the contrary, more than half of the biomass burning particles collected within the monsoon layer had S/(S+K)<0.5, strongly indi-cating that many of them were still relatively fresh. The pres-ence of relatively fresh biomass burning particles in the mon-soon layer may as well be inferred from the particle volatil-ity measurements (Fig. 5). Fresh biomass burning particles should in principal show smaller volatilized particle volumes as compared to the aged ones. This is because fresh parti-cles contain much less secondary organic acids (e.g. oxalate, formate, acetate) or secondary inorganic species (e.g. ammo-nium, sulfate, nitrate), as compared to aged ones (Reid et al., 2005). The volatilized volume is largely dependent on the abundance of such secondary species. Therefore, small volatilized volume fractions observed in the monsoon layer provide further indication that the dominant biomass burning particles were still relatively fresh.

Thus, it is suggested that the rather low CCN/CN ra-tio observed in the monsoon layer during SOP2a2 may be attributed to the predominance of relatively fresh biomass burning particles, which are assumed to be less hygroscopic. On the other hand, the highest values of CCN/CN ratios ob-served in the SAL and free troposphere during SOP2a2 are most likely due to the dominance of sulfate and aged biomass burning particles (Figs. 9 and 10), together comprising the increasingly prominent accumulation mode particles (Fig. 4) (i.e. more hygroscopic particles in the CCN relevant sizes).

Seen the significant fraction of mineral dust particles in the SAL and free troposphere during SOP2a2, it becomes evident that there is increased potential for submicron dust particles to act as CCN upon the activation of liquid clouds (Twohy et al., 2009).

It is worth pointing out that we have also collected cloud residual particles using the CVI inlet during the passage through the stratocumulus clouds often encountered on top of the monsoon layer with overlying SAL. We did find submi-cron aluminosilicate mineral dust in our cloud residual parti-cles, along with biomass burning and sulfate particles. Small inclusions of soluble components may potentially induce ac-tivation of the supposedly insoluble dust particles (Kelly et al., 2007; Levin et al., 1996). If we compare the detection frequencies of elements between the clear-sky dust particles with that of cloud residues, we observed a slight enrichment of elements such as Na, Mg, S, K, and Ca within clouds. These elements may have facilitated their initial activation.

4 Conclusions

In order to characterize the seasonal and spatial variations in the aerosol physico-chemical properties (particle size dis-tributions, shape, composition, mixing state, hygroscopcity) undergoing transition from dry to wet seasons over West Africa, a series of physical and chemical analyses were con-ducted onboard the ATR-42 research aircraft deployed over Niamey, Niger in summer 2006 during the three special ob-servation periods SOP1, SOP2a1, SOP2a2 of the AMMA project.

(13)

and SOP2a1 (monsoon onset), but was considerably different during SOP2a2 (high monsoon).

The fraction of particles being able to act as CCN rep-resented by CCN/CN ratios showed marked differences between the monsoon layer and SAL, especially during SOP2a2, which could not be explained solely by the in-creased number of particles in CCN relevant sizes. Elemental composition suggested that the predominant biomass burn-ing particles in the monsoon layer to be relatively fresh. The unexpectedly low CCN/CN ratios found in this layer could be attributable to the supposedly hydrophobic nature of fresh biomass burning particles.

In contrast, relatively high CCN/CN ratios found in the SAL and free troposphere especially during SOP2a2 can be explained by the combination of increased fraction of accu-mulation mode particles, as well as dominance of more hy-groscopic sulfate and aged biomass burning particles therein. Presence of submicron mineral dust particles were confirmed within the actual cloud residues co-existing with sulfate and biomass burning residual particles, suggesting their active role in the water-cloud activation.

A remaining question then is, how to explain that the particle chemistry was rather similar in the monsoon layer and overlying layers during the first two SOPs and consid-erably different during the final SOP. This is most likely linked with the boundary layer dynamics. The major change in the boundary layer dynamics identified through the dry and monsoon periods by our aircraft soundings was a de-crease in planetary boundary layer (PBL) depth due to the moistening of the ground by rainfall, and to the consumption of available energy by evaporation instead of PBL heating. When the PBL is sufficiently energetic to incorporate some air from the SAL by entrainment, it generates drier, descend-ing air parcels, described also as ‘dry tongues’ by Canut et al. (2009).

Detailed meteorological measurements simultaneously performed onboard the ATR-42 research aircraft yielded strong decreasing trends in the entrainment flux ratio (Sa¨ıd et al., 2009; Canut et al., 2009), which indicated that there was a strong interaction between the PBL and SAL with ac-tive entrainment during the first two SOPs. This explains the rather homogeneous aerosol compositions found between the two wind regimes during the first two SOPs. In the contrary, cloud layers tend to often disconnect PBL and SAL, result-ing in the notably different particle compositions between the two layers, in particular the aging stages of the biomass burn-ing particles.

Although, we couldn’t detect features that can be directly linked to urban pollution, we cannot entirely exclude the pos-sibility that at least some of the particles come from the major coastal cities in West Africa (e.g. Abidjan, Accra, Cotonou, Lagos, Lome) since the accelerated monsoon flux and decou-pling of SAL and PBL during SOP2a2 together might favor more direct transport of particles from the coastal regions. At the same time, there is a significant zonal variability in the

land cover along the monsoon flux (forests, savanna, crop-land and Sahel) and multiple processes may be responsible for the production of the observed biomass burning particles (e.g. savanna and forest fires, agricultural burning or house-hold emissions).

Finally, the S to K molar ratios among the individual biomass burning particles found as cloud residues were more or less close to that found in the monsoon layer rather than in SAL and free troposphere (Fig. 10). This could be an impli-cation that the particles in the monsoon layer may predomi-nantly be the source of CCN (despite the lower CCN/CN ra-tio) in the observed stratocumulus clouds encountered on top of the monsoon layer with overlying SAL. It is difficult to draw any firm conclusion from the limited number of cloud samples and analyzed particles therein, and the question as to how the particles from different layers (monsoon, SAL and free troposphere) contribute to the activation of such stra-tocumulus clouds, and eventually in the formation of MCS, remains to be studied in more detail.

Acknowledgements. Based on a French initiative, AMMA was built by an international scientific group and is currently funded by a large number of agencies, especially from France, UK, US and Africa. It has been the beneficiary of a major financial contribution from the European Community’s Sixth Framework Research Programme. Detailed information on scientific coordination and funding is available on the AMMA International web site http://www.amma-international.org. This work was funded by the French API-AMMA, CNES, INSU, and the Japan Society for the Promotion of Science. We thank all the staff and pilots of the SAFIRE (Service des Avions Franc¸ais Instruments pour la Recherche en Environnement, Toulouse) group for their help and support. We are grateful for the extraordinary instrumental preparation and operation by O. Laurent, G. Momboisse, and T. Bourrianne. We also thank J.-M. Henot. and B. Devouard of LMV (Laboratoire Magmas et Volcans, Clermont-Ferrand), C. Dr´egnaux and C. Szczepaniak of CICS (Centre Imagerie Cellulaire Sant´e, Clermont-Ferrand), S. Nitsche, D. Chaudanson, O. Grauby, D. Vielzeuf, A. Baronnet, D. Ferry, of CRMCN (Centre de Recherche en Mati`ere Condens´ee et Nanosciences, Marseille), for their generous assistance in realizing the single particle analysis.

Edited by: P. Formenti

References

Andreae, M. O.: Soot carbon and excess fine potassium: Long-range transport of combustion-derived aerosols, Science, 220, 1148–1151, 1983.

Bassett, M., Seinfeld, J. H.: Atmospheric equilibrium model of sul-fate and nitrate aerosols-II. Particle size analysis, Atmos. Envi-ron., 18, 1163–1170, 1984.

Bigg, E. K.: Comparison of aerosol at four baseline atmospheric monitoring stations (Alaska, Hawaii, Tasmania, Antarctica), J. Appl. Meteor., 19, 5, 521–533, 1980.

(14)

black and organic carbon emissions from combustion, J. Geo-phys. Res., 109, D14203, doi:10.1029/2003JD003697, 2004. Bohren, C. F. and Huffman, D. R.: Absorption and Scattering of

Light by Small Particles, John Wiley, New York, 530 pp., 1983. Cantrell, C. A., Zimmer, A., and Tyndall, G. S.: Absorption

cross-sections for water vapor from 183 nm to 193 nm, Geophys. Res. Lett., 24, 2195–2198, 1997.

Canut, G., Lothon, M., Sa¨ıd, F., and Lohou, F.: Observation of en-trainment at the interface between monsoon flow and the Saha-ran Air Layer, Q. J. Roy. Meteorol. Soc., Wiley InterScience, (www.interscience.wiley.com), doi:10.1002/qj.471, 2009. Capes, G., Johnson, B., McFiggans, G., Williams, P. I., Haywood,

J., and Coe, H.: Aging of biomass burning aerosols over West Africa: Aircraft measurements of chemical composition, micro-physical properties, and emission ratios, J. Geophys. Res., 113, D00C15, doi:10.1029/2008JD009845, 2008.

Chou, C., Formenti, P., Maille, M., Ausset, P.. Helas, G., Harri-son, M., and Osborne, S.: Size distribution, shape, and com-position of mineral dust aerosols collected during the African Monsoon Multidisciplinary Analysis Special Observation Pe-riod 0: Dust and Biomass-Burning Experiment field cam-paign in Niger, January 2006, J. Geophys. Res., 113, D00C10, doi:10.1029/2008JD009897, 2008.

Christopher, S. A., Gupta, P., Haywood, J., and Greed, G.: Aerosol optical thicknesses over North Africa: 1. Develop-ment of a product for model validation using Ozone Moni-toring Instrument, Multiangle Imaging Spectroradiometer, and Aerosol Robotic Network, J. Geophys. Res., 113, D00C04, doi:10.1029/2007JD009446, 2008.

Clarke, A. D., Ahlquist, N. C., and Covert, D. S.: The Pacific marine aerosol: Evidence for natural acid sulphates, J. Geophys. Res., 92(D4), 4179–4190, 1987.

Cook, K. H.: Generation of the African Easterly Jet and its role in determining West African precipitation, J. Clim., 12, 1165–1184, 1999.

Crumeyrolle, S., Gomes, L., Tulet, P., Matsuki, A., Schwarzen-boeck, A., and Crahan, K.: Increase of the aerosol hygroscop-icity by cloud processing in a mesoscale convective system: a case study from the AMMA campaign, Atmos. Chem. Phys., 8, 6907–6924, doi:10.5194/acp-8-6907-2008, 2008.

Formenti, P., Rajot, J. L., Desboeufs, K., Caquineau, S., Chevail-lier, S., Nava, S., Gaudichet, A., Journet, E., Triquet, S., Al-faro, S., Chiari, M., Haywood, J., Coe, H., and Highwood, E.: Regional variability of the composition of mineral dust from western Africa: Results from the AMMA SOP0/DABEX and DODO field campaigns, J. Geophys. Res., 113, D00C13, doi:10.1029/2008JD009903, 2008.

Gao, S., Hegg, D. A., Hobbs, P. V., Kirchstetter, T. W., Magi, B. I., and Sadilek, M.: Water-soluble organic components in aerosols associated with savanna fires in southern Africa: Identification, evolution, and distribution, J. Geophys. Res., 108 (D13), 13, 8491, doi:10.1029/2002JD002324, 2003.

Haywood, J. M., Pelon, J., Formenti, P., Bharmal, N., Brooks, M., Capes, G., Chazette, P., Chou, C., Christopher, S., Coe, H., Cuesta, J., Derimian, Y., Desboeufs, K., Greed, G., Harrison, M., Heese, B., Highwood, E. J., Johnson, B., Mallet, M., Mar-ticorena, B., Marsham, J., Milton, S., Myhre, G., Osborne, S. R., Parker, D. J., Rajot, J.-L., Schulz, M., Slingo, A., Tanr´e, D., and Tulet, P.: Overview of the Dust and Biomass-burning

Experiment and African Monsoon Multidisciplinary Analysis Special Observing Period-0, J. Geophys. Res., 113, D00C17, doi:10.1029/2008JD010077, 2008.

Heintzenberg, J.: The SAMUM-1 experiment over Southern Mo-rocco: overview and introduction, Tellus, 61B, 2–11, 2009. Horvath, H.: Influence of atmospheric aerosols upon the global

ra-diation balance, edited by Harrison, R. M. and Van Grieken, R., Atmospheric particles, New York, John Wiley, 543–596, 1998. Hudson J. G. and Da, X.: Volatility and size of cloud condensation

nuclei, J. Geophys. Res., 101, 4435–4442, 1996.

Intergovernmental Panel on Climate Change, Climate Change 2007: The Physical Science Basis, in: Contribution of Working Group I to the Fourth Assessment Report of the Intergovernmental Panel on Climate Change, edited by: Solomon, S., Qin, D., Manning, M., Chen, Z., Marquis, M., Averyt, K. B., Tignor, M., and Miller, H. L., Cambridge Univ. Press, Cambridge, UK, 2007.

Janicot, S., Thorncroft, C. D., Ali, A., Asencio, N., Berry, G., Bock, O., Bourles, B., Caniaux, G., Chauvin, F., Deme, A., Kergoat, L., Lafore, J.-P., Lavaysse, C., Lebel, T., Marticorena, B., Mounier, F., Nedelec, P., Redelsperger, J.-L., Ravegnani, F., Reeves, C. E., Roca, R., de Rosnay, P., Schlager, H., Sultan, B., Tomasini, M., Ulanovsky, A., and ACMAD forecasters team: Large-scale overview of the summer monsoon over West Africa during the AMMA field experiment in 2006, Ann. Geophys., 26, 2569– 2595, doi:10.5194/angeo-26-2569-2008, 2008.

Kalapureddy, M. C. R., Lothon, M., Campistron, B., Lohou, F., Sa¨ıd, F.: Wind profiler analysis of the African Easterly Jet in relation with the boundary layer and the Saharan heat-low, Q. J. Roy. Meteorol. Soc., Wiley InterScience, (www.interscience. wiley.com), doi: 10.1002/qj.494, 2009.

Kelly, J. T., Chuang, C. C., and Wexler, A. S.: Influence of dust composition on cloud droplet formation, Atmos. Environ., 41, 2904–2916, 2007.

Kotchenruther, R. and Hobbs, P. V.: Humidification factors of aerosols from biomass burning in Brazil, J. Geophys. Res., 103, 32081–32090, 1998.

Kreidenweis, S. M., McInnes, L. M., and Brechtel, F. J.: Observa-tions of Aerosol Volatility and Elemental Composition at Mac-quarie Island during the First Aerosol Characterization Experi-ment (ACE 1), J. Geophys. Res., 103, 16511–16524, 1998. Lebel, T., Parker, D. J., Flamant, C., Bourl`es, B., Marticorena,

B., Mougin, E., Peugeot, C., Diedhiou, A., Haywood, J. M., Ngamini, J. B., Polcher, J., Redelsperger, J.-L., and Thorncroft, C. D.: The AMMA field campaigns: multiscale and multidisci-plinary observations in the West African region, Q. J. Roy. Me-teorol. Soc., Wiley InterScience, (www.interscience.wiley.com), doi:10.1002/qj.486, 2009.

Levin, Z., Ganor, E., and Gladstein, V.: The effects of desert parti-cles coated with sulfate on rain formation in the Eastern Mediter-ranean, J. Appl. Meteorol., 35, 1511–1523, 1996.

Li, J., P´osfai, M., Hobbs, P. V., and Buseck, P. R.: Individual aerosol particles from biomass burning in southern Africa: 2. Compsotions and aging of inorganic particles, J. Geophys. Res., 108(D13), 8484, doi:10.1029/2002JD002319, 2003.

(15)

D., Kido, M., Inomata, Y., Kim, Y. S., Trochkine, D., Nishita, C., Yamada, M., Nagatani, T., Nagatani, M., and Nakata, H.: Hetero-geneous sulfate formation on dust surface and its dependence on mineralogy: Balloon-borne measurements in the surface atmo-sphere of Beijing, China, Water, Air, and Soil Pollution: Focus, 5, 101–132, 2005a.

Matsuki, A., Iwasaka, Y., Shi, G. Y., Zhang, D. Z., Trochkine, D., Yamada, M., Kim, Y. S., Chen, B., Nagatani, T., Miyazawa, T., Nagatani, M., and Nakata, H.: Morphological and chemical modification of mineral dust: Observational insight into the het-erogeneous uptake of acidic gases, Geophys. Res. Lett., 32(22), L22806, doi:10.1029/2005GL024176, 2005b.

Matsuki, A., Schwarzenboeck, A., Venzac, H., Laj, P., Crumey-rolle, S., and Gomes, L.: Cloud processing of mineral dust: di-rect comparison of cloud residual and clear sky particles dur-ing AMMA aircraft campaign in summer 2006, Atmos. Chem. Phys., 10, 1057–1069, doi:10.5194/acp-10-1057-2010, 2010. McConnell, C. L., Highwood, E. J., Coe, H., Formenti, P.,

Ander-son, B., Osborne, S., Nava, S., Desboeufs, K., Chen, G., and Har-rison, M. A. J.: Seasonal variations of the physical and optical characteristics of Saharan dust: Results from the Dust Outflow and Deposition to the Ocean (DODO) experiment, J. Geophys. Res., 113, D14S05, doi:10.1029/2007JD009606, 2008. Mouri, H., Nagao, I., Okada, K., Koga, S., and Tanaka, H.:

Elemen-tal composition of individual aerosol particles collected from the coastal marine boundary layer, J. Meteor. Soc. Jap., 74, 585–591, 1996.

O’Dowd, C. D. and Smith M. H.: Physico-chemical properties of aerosol over the North East Atlantic: Evidence for wind speed related sub-micron sea-salt aerosol production, J. Geophys. Res., 98, D1, 1137–1149, 1993.

Ogren, J. A., Heintzenberg J., and Charlson R. J.: In-situ sampling of clouds with a droplet to aerosol converter. Geophys. Res. Lett., 12, 121–124, 1985.

Pinnick, R. G., Jennings, S. G., and Fernandez, G.: Volatility of aerosol in the arid southwestern United States, J. Atmos. Sci., 44, 562–576, 1987.

P´osfai, M., Simonics, R., Li, J., Hobbs, P. V., and Buseck, P. R.: Individual aerosol particles from biomass burning in southern Africa: 1. Compositions and size distributions of carbonaceous particles, J. Geophys. Res., 108(D13), 8483, doi:10.1029/2002JD002291, 2003.

Raut, J.-C. and Chazette, P.: Radiative budget in the presence of multi-layered aerosol structures in the framework of AMMA SOP-0, Atmos. Chem. Phys., 8, 6839–6864, doi:10.5194/acp-8-6839-2008, 2008.

Redelsperger, J. L., Thorncroft, C. D., Diedhiou, A., Lebel, T., Parker, D. J., and Polcher, J.: African Monsoon Multidisciplinary Analysis: An international research project and field campaign, B. Am. Meteorol. Soc., 87, 1739–1746, doi:10.1175/BAMS-87-12-1739, 2006.

Reid, J. S., Koppmann, R., Eck, T. F., and Eleuterio, D. P.: A review of biomass burning emissions part II: intensive physical proper-ties of biomass burning particles, Atmos. Chem. Phys., 5, 799– 825, doi:10.5194/acp-5-799-2005, 2005.

Rissler, J., Vestin, A., Swietlicki, E., Fisch, G., Zhou, J., Artaxo, P., and Andreae, M. O.: Size distribution and hygroscopic prop-erties of aerosol particles from dry-season biomass burning in Amazonia, Atmos. Chem. Phys., 6, 471–491,

doi:10.5194/acp-6-471-2006, 2006.

Rood, M. J., Larson, T. V., Covert, D. S., and Ahlquist, N. C.: Measurement of laboratory and ambient aerosols with temper-ature and humidity controlled nephlometry, Atmos. Environ., 19, 1181–1190, 1985.

Rood, M. J., Larson, T. V., and Covert, D. S.: Temperature and hu-midity controlled nephelometry: improvements and calibration, Aerosol Sci., Technol., 7, 57–65, 1987.

Sa¨ıd, F., Canut, G., Durand, P., Lohou, F., and Lothon, M.: Seasonal evolution of boundary-layer turbulence measured by aircraft dur-ing the AMMA 2006 Special Observation Period, Q. J. Roy. Me-teorol. Soc., Wiley InterScience, (www.interscience.wiley.com), doi:10.1002/qj.475, 2009.

Schwarzenboeck, A. and Heintzenberg, J.: Cut size minimization and cloud element break-up in a ground-based CVI, J. Aerosol Sci., 31, 477–489, 2000.

Schwarzenboeck, A. and Heintzenberg, J., and Mertes, M.: Incor-poration of aerosol particles between 25 and 850 nm into cloud elements: measurements with a new complementary sampling system, Atmos. Res., 52, 241–260, 2000.

Smith, M. H. and O’Dowd, C. D.: Observation of accumulation mode aerosol composition and soot carbon concentrations by means of a high-temperature volatility technique, J. Geophys. Res., 101(D14), 19583–19591, doi:10.1029/95JD01750, 1996. Swap, R. J., Annegarn, H. J., Suttles, J. T., King, M. D.,

Plat-nick, S., Privette, J. L., and Scholes, R. J.: Africa burning: A thematic analysis of the Southern African Regional Science Initiative (SAFARI 2000), J. Geophys. Res., 108(D13), 8465, doi:10.1029/2003JD003747, 2003.

Tanr´e, D., Haywood, J. M., Pelon, J., L´eon, J. F., Chatenet, B., For-menti, P., Francis, P., Goloub, P., Highwood, E. J., and Myhre, G.: Measurement and modeling of the Saharan dust radiative impact: Overview of the SaHAran Dust Experiment (SHADE), J. Geophys. Res., 108(D13), 8574, doi:10.1029/2002JD003273, 2003.

Twohy, C. H., Kreidenweis, S. M., Eidhammer, T., Browell, E. V., Heymsfield, A. J., Bansemer, A. R., Anderson, B. E., Chen, G., Ismail, S., DeMott, P. J., and Van Den Heever, S. C.: Saharan dust particles nucleate droplets in eastern Atlantic clouds, Geo-phys. Res. Lett., 36, L01807, doi:10.1029/2008GL035846, 2009. Villani, P., Picard, D., Marchand, N., and Laj, P., Design and Val-idation of a 6-Volatility Tandem Differential Mobility Analyzer (VTDMA), Aerosol Sci. Tech., 41, 10, 898–906, 2007.

Winker, D. M., Hunt, W. H., and McGill, M. J.: Initial perfor-mance assessment of CALIOP, Geophys. Res. Lett., 34, L19803, doi:10.1029/2007GL030135, 2007.

Weinbruch, S., Van Aken, P., Ebert, M., Thomassen, Y., Skogstad, A., Chashchin, V. P., Nikonov, A., The heterogeneous composi-tion of working place aerosols in a nickel refinery: a transimis-sion and scanning electron microscope study, J. Environ. Monit., 4, 344–350, 2002.

Woodward, S.: Modeling the atmospheric life-cycle and ra-diative impact of mineral dust in the Hadley Centre cli-mate model, J. Geophys. Res., 106(D16), 18155–18166, doi:10.1029/2000JD900795, 2001.

Imagem

Fig. 1. Time scale of the AMMA Special Observation Periods (SOP) and flight hours of the intensive aircraft measurements
Fig. 3. Five-day backward trajectory calculations of air-masses arriving along the tracks of the ATR-42 aircraft during the three AMMA SOPs.
Fig. 4. Mean particle number size distributions observed in the monsoon layer, Saharan air layer (SAL), and free troposphere from vertical exploration of the atmosphere in the vicinity of Niamey  dur-ing the three AMMA SOPs corresponddur-ing to “dry”, “mon
Table 1. Parameters (number concentration (n i ), geometric standard deviation (σ i ), and number median particle diameter (m i )) for the mean particle size distributions shown in Fig
+6

Referências

Documentos relacionados

The chemical composition of secondary organic aerosol (SOA) particles, formed by the dark ozonolysis of α -pinene, was characterized by a high-resolution time-of-flight aerosol

Starting from the scanning electronic microscopy characterizations, the chemical analysis for energy dispersive spectroscopy, and phase analysis by X-ray diffraction, the

Results of analyses by scanning electron microscopy (SEM), energy dispersive spectroscopy (EDS) and energy dispersive X-ray fluorescence (EDX) showed that the sample is

The spatial distribution of aerosol chemical com- position and the evolution of the Organic Aerosol (OA) fraction is investigated based upon airborne measurements of aerosol

Water glass modification with the colloidal solution of ZnO nanoparticles in propanol confirmed the effect of modifier on the water glass wettability of sand

at dust source, scanning electron microscopy/X-ray energy- dispersive microanalysis (SEM XEDS) of individual min- eral particles, X-ray diffraction (XRD) analysis of bulk dust

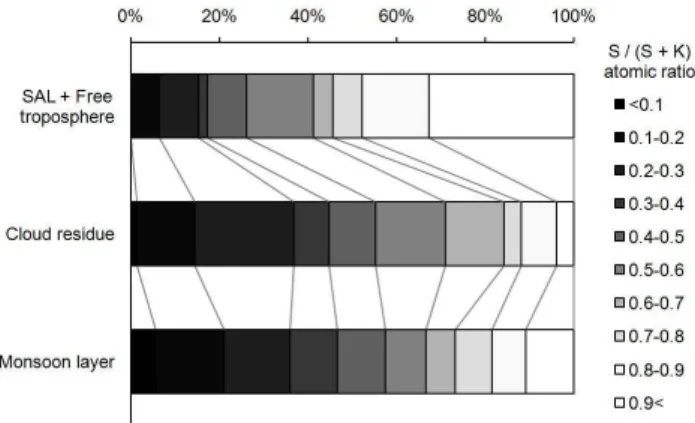
Individual particle analyses using scanning electron microscopy (SEM) coupled with energy dispersive X-ray analyses (EDX) showed that the proportion of S-rich particles increased

Basing on the results of MANOVA test it has been observed that the strongest significant effect on an increase of the tensile strength R m exerted the addition of Mg, followed by