ACPD
5, 2469–2501, 2005Aerosol episodes in Finland caused by
wildfires
J. V. Niemi et al.
Title Page
Abstract Introduction
Conclusions References
Tables Figures
◭ ◮
◭ ◮
Back Close
Full Screen / Esc
Print Version
Interactive Discussion
EGU Atmos. Chem. Phys. Discuss., 5, 2469–2501, 2005
www.atmos-chem-phys.org/acpd/5/2469/ SRef-ID: 1680-7375/acpd/2005-5-2469 European Geosciences Union
Atmospheric Chemistry and Physics Discussions
Characterization of aerosol particle
episodes in Finland caused by wildfires in
Eastern Europe
J. V. Niemi1, H. Tervahattu2,3, H. Vehkam ¨aki4, J. Martikainen4, L. Laakso4, M. Kulmala4, P. Aarnio5, T. Koskentalo5, M. Sillanp ¨a ¨a6, and U. Makkonen6
1
Department of Biological and Environmental Sciences, University of Helsinki, P.O. Box 27, FIN-00014 Helsinki, Finland
2
Nordic Envicon Ltd., Koetilantie 3, FIN-00790 Helsinki, Finland
3
Cooperative Institute for Research in Environmental Sciences, University of Colorado, Campus Box 216, Boulder, CO 80309, USA
4
Department of Physical Sciences, University of Helsinki, P.O. Box 64, FIN-00014 Helsinki, Finland
5
Helsinki Metropolitan Area Council (YTV), Opastinsilta 6 A, FIN-00520 Helsinki, Finland
6
Finnish Meteorological Institute, Sahaajankatu 20 E, FIN-00880 Helsinki, Finland Received: 31 January 2005 – Accepted: 4 April 2005 – Published: 22 April 2005 Correspondence to: J. V. Niemi ([email protected])
ACPD
5, 2469–2501, 2005Aerosol episodes in Finland caused by
wildfires
J. V. Niemi et al.
Title Page
Abstract Introduction
Conclusions References
Tables Figures
◭ ◮
◭ ◮
Back Close
Full Screen / Esc
Print Version
Interactive Discussion
EGU
Abstract
We studied the sources, compositions and size distributions of aerosol particles during
long-range transport (LRT) PM2.5episodes occurred on 12–15 August, 26–28 August
and 5–6 September 2002 in Finland. Backward air mass trajectories, satellite de-tections of fire areas, and dispersion modelling results indicate that emissions from
5
wildfires in Russia and other Eastern European countries arrived to Finland during the episodes. Individual particle analyses using scanning electron microscopy (SEM) coupled with energy dispersive X-ray analyses (EDX) showed that the proportion of S-rich particles increased during the episodes and they contained elevated fractions of K, which indicates emissions from biomass burning. These aerosols were mixed with
10
S-rich emissions from fossil fuel burning during the transport, since air masses came through polluted areas of Europe. Minor amounts of coarse Ca-rich particles were also brought by LRT during the episodes, and they probably originated from wildfires and/or from Estonian and Russian oil-shale burning industrial areas. The ion chromatography
analysis showed that concentrations of sulphate (SO2−
4 ), total nitrate (NO
−
3+HNO3(g))
15
and total ammonium (NH+4+NH3(g)) increased during the episodes, but the ratio of total
amount of these ions to PM10 concentration decreased indicating unusually high
frac-tions of other chemical components. The particle number size distribution
measure-ments with differential mobility particle sizer (DMPS) showed that the concentrations of
90–500 nm particles increased during the episodes, but the concentrations of particles
20
smaller than 90 nm decreased. The reduction of the smallest particles was caused by suppressed new particle formation due to the vapour and molecular cluster uptake of LRT particles. Our results show that the emissions from wildfires in Russian and other Eastern European deteriorated air quality on very large areas, even at the distance of over 1000 km from the fire areas.
ACPD
5, 2469–2501, 2005Aerosol episodes in Finland caused by
wildfires
J. V. Niemi et al.
Title Page
Abstract Introduction
Conclusions References
Tables Figures
◭ ◮
◭ ◮
Back Close
Full Screen / Esc
Print Version
Interactive Discussion
EGU
1. Introduction
Large amounts of fine particles (PM2.5) are emitted from various sources and
trans-ported long distances due to their slow removal from the atmosphere. Thus, in the
areas with low local emissions, major fraction of the PM2.5mass is usually long-range
transported. Fine particles are associated with adverse health effects (Dockery and
5
Pope, 1994; Laden et al., 2000; Pope et al., 2002; WHO, 2002, 2003), and no
thresh-old concentration has been found below which they have no effect on health (WHO,
2003).
The properties and sources of long-range transport (LRT) particles in Finland have been studied in association with several short-term campaigns and long-term
monitor-10
ing measurements. The emissions and mass concentrations of PM2.5 are generally
quite low compared with more polluted regions of Europe (EMEP, 2001; Ruuskanen et
al., 2001; EMEP, 2002). Even in the urban areas of Helsinki, 50–70% of PM2.5mass is
caused by LRT (Vallius et al., 2003; Karppinen et al., 2004). In general, high
concen-trations of LRT PM2.5mass and typical chemical components of LRT particles, such as
15
sulphate and nitrate, are observed in Finland when air masses arrive from Eastern and Central Europe (Pakkanen et al., 2001; Ruoho-Airola et al., 2004). In northern Finland, the emissions from Arctic Ocean and from Kola Peninsula industrial areas in Northern Russia also rise LRT particle mass concentrations (Virkkula et al., 1999; Yli-Tuomi et al., 2003). However, the sources and properties of aerosols during the strongest LRT
20
periods are still poorly known in Finland, and only few LRT episodes have been stud-ied in detail so far. The main sources of previously studstud-ied LRT episodes were marine aerosols from Atlantic Ocean (Tervahattu et al., 2002a, b), emissions from oil-shale burning industrial areas in Estonia and Russia (Tervahattu et al., 2004), and emissions from spring-time agricultural field-burning and fossil fuel burning in Russia and other
25
Eastern European countries (Niemi et al., 2004).
In the present article we describe three LRT PM2.5episodes that occurred in Finland
ACPD
5, 2469–2501, 2005Aerosol episodes in Finland caused by
wildfires
J. V. Niemi et al.
Title Page
Abstract Introduction
Conclusions References
Tables Figures
◭ ◮
◭ ◮
Back Close
Full Screen / Esc
Print Version
Interactive Discussion
EGU as well as its chemical composition using bulk and individual particle methods.
Back-ward air mass trajectories, fire satellite observations, dispersion modelling results and emissions source data were also used to identify the origins and to characterize the dispersion of the LRT emissions. The main sources of the episodes were emissions from forest and peat fires mixed with emissions from fossil fuel burning. A comparison
5
between an earlier LRT PM2.5episode which occurred during spring-time agricultural
field burning period (Niemi et al., 2004) is also carried out.
2. Material and methods
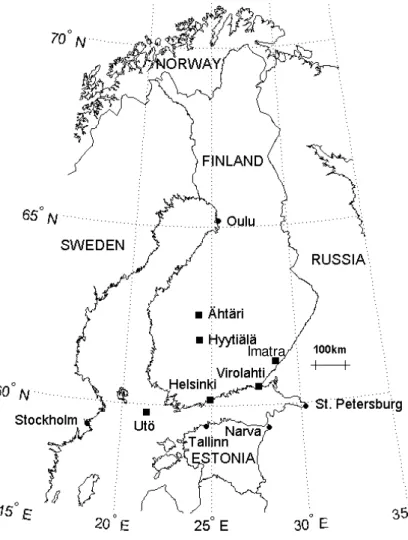
We used several measurement and sampling sites in this study and their locations are shown in Fig. 1. The summary of measurements and samplings performed in these
10
sites are given in Table 1, and they are described in detail in following sections.
2.1. Meteorological and emission data
The meteorological conditions were observed using data collected by the Finnish Me-teorological Institute at Kaisaniemi in Helsinki and by the Helsinki Metropolitan Area Council at Pasila in Helsinki. Backward air mass trajectories were produced using the
15
vertical motion model in the HYbrid Single-Particle Lagrangian Integrated Trajectory (HYSPLIT4) model (Draxler and Rolph, 2003) with the Final Analyses (FNL) mete-orological database at NOAA Air Resources Laboratory’s web server (Rolph, 2003).
For detection of fire areas, we used Web Fire Mapper (http://maps.geog.umd.edu),
which is part of the MODerate-resolution Imaging Spectroradiometer (MODIS) Rapid
20
Response System (Justice et al., 2002). The Navy Aerosol Analysis and Prediction System (NAAPS) model results were used to determine the distribution of smoke, dust and sulphate aerosols. Details of the model and model results are available at
the internet pages (http://www.nrlmry.navy.mil/aerosol/) of the Naval Research
Labo-ratory, Monterey, California. Using data of the European Monitoring and Evaluation
ACPD
5, 2469–2501, 2005Aerosol episodes in Finland caused by
wildfires
J. V. Niemi et al.
Title Page
Abstract Introduction
Conclusions References
Tables Figures
◭ ◮
◭ ◮
Back Close
Full Screen / Esc
Print Version
Interactive Discussion
EGU Programme (EMEP), we searched for information on trace gas and particle emissions
of areas along the air mass routes (EMEP, 2001, 2002).
2.2. Particle mass and number size distributions
Particle mass and number size distributions are measured at a rural background station (SMEAR II) in Hyyti ¨al ¨a (Kulmala et al., 2001) by the University of Helsinki (Department
5
of Physical Sciences). The particle mass fractions were measured with a Dekati PM10
3-stage impactor with a backup filter. The duration of sample collection was 2–3 days.
The cut-offdiameters (D50) of the impactor stages were 10, 2.5 and 1µm. The
collec-tion substrates on impaccollec-tion stages were polycarbonate membranes (Nuclepore 800 203, diameter 25 mm) with no holes, and the backup filter material was made of teflon
10
(Gelman Teflo R2P J047, diameter 47 mm) with 2µm diameter pore size. The
smear-ing of substrates to prevent particles from bouncsmear-ing back from the substrates, and the
gravimetric analysis are described in detail by Laakso et al. (2003). The PM10 mass
monitoring measurements performed in Virolahti, Helsinki (also PM2.5) and Imatra are
shortly described in Sects. 2.3 and 2.4.
15
Particle number size distributions were measured in the diameter between 3 and
500 nm using a differential mobility particle sizer (DMPS) (Aalto et al., 2001) in Hyyti ¨al ¨a.
The time resolution was 10 min. Small particles with diameter less than about 10 nm were measured with a TSI3025 condensation particle counter (CPC) and Hauke-type
differential mobility analyser (DMA) and whereas larger particles with a TSI3010 CPC
20
and Hauke-type DMA.
2.3. Ion analyses
Rural background air quality is monitored at several measurement stations in Finland by the Finnish Meteorological Institute (FMI). We present ion measurement results
from the EMEP stations in ¨Aht ¨ari, Virolahti and Ut ¨o. Daily total suspended particle
25
ACPD
5, 2469–2501, 2005Aerosol episodes in Finland caused by
wildfires
J. V. Niemi et al.
Title Page
Abstract Introduction
Conclusions References
Tables Figures
◭ ◮
◭ ◮
Back Close
Full Screen / Esc
Print Version
Interactive Discussion
EGU
AS) containing cellulose filters (Whatman 40, diameter 47 mm). Sulphate (SO2−
4 ), total
nitrate (NO−
3+HNO3(g)), and total ammonium (NH+4+NH3(g)) were analysed with ion
chromatography (IC, Dioine DX-500 and Waters). The details of the sampling and IC methods are described in Paatero et al. (2001). We also compared the ion masses
and PM10masses measured in Virolahti. The PM10mass was monitored with Eberline
5
FH 62 I-R (Eberline Instruments), which is based onβ-attenuation.
2.4. Individual particle analyses by SEM/EDX
Air quality is monitored at several measurement stations by the Helsinki Metropolitan
Area Council in the Helsinki metropolitan area, and by the Environment Office of Imatra
in the region of Imatra. We selected particle samples for individual particle analyses
10
collected at Kallio and Luukki in the Helsinki area during all 3 episodes studied, and at Mansikkala in Imatra during the last episode. Particle samples were collected with Eberline FH 62 I-R samplers (Eberline Instruments) on fibreglass filter tape. In all,
17 particle samples (9 PM2.5 and 8 PM10 samples), collected during the episode (13
August, 27 August, 28 August, 5 September and 6 September 2002) and reference (8
15
March, 10 March, 16 March, 18 August, 22 August, 17 September and 22 September 2002) days, were selected for the analyses.
The elemental compositions of individual particles and agglomerates were studied using scanning electron microscopy (SEM – ZEISS DSM 962) coupled with energy dispersive X-ray analyses (EDX – LINK ISIS with the ZAF-4 measurement program).
20
The SEM/EDX samples were prepared by pressing a tape (Scotch Ruban Adhesive) attached to an aluminium plate onto the filter surface covered with particles. Then samples were coated with carbon (Agar SEM Carbon Coater) to make the sample surfaces conductive. The SEM/EDX was operated at 20 kV accelerating voltage, and counting time of the X-ray spectrum was 15 s. The elemental compositions of 100
25
randomly selected particles or agglomerates (minimum diameter 1µm) were analysed
agglom-ACPD
5, 2469–2501, 2005Aerosol episodes in Finland caused by
wildfires
J. V. Niemi et al.
Title Page
Abstract Introduction
Conclusions References
Tables Figures
◭ ◮
◭ ◮
Back Close
Full Screen / Esc
Print Version
Interactive Discussion
EGU erates during sampling and sample preparation for SEM/EDX analysis, and thus we
could also obtain elemental information from submicron size-range by analysing these agglomerates. The relative elemental weight percentages (normalised to 100%) were calculated using ZAF-4 corrections for the following elements: Na, Mg, Al, Si, S, Cl, K, Ca, Ti and Fe. The ZAF-corrected elemental results are semiquantitative, but the
5
accuracy is well sufficient to identify different particle types and to compare the diff
er-ences in elemental ratios of the same particle type in different samples (Kupiainen et
al., 2003; Niemi et al., 2004).
3. Results and discussion
3.1. General description of the LRT episodes
10
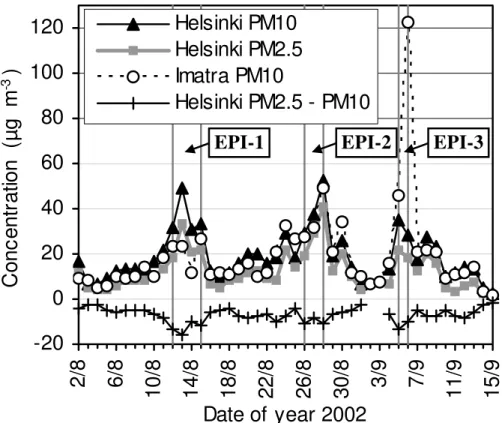
PM10 and PM2.5 concentrations rose on extraordinarily high levels in Finland during
three periods in August and September, 2002. We focus on the strongest periods of these episodes; the first episode (EPI-1) was on 12–15 August, the second (EPI-2) on 26–28 August and the third (EPI-3) on 5–6 September (Fig. 2). These episodes were also observed in Estonia and Sweden (Niemi et al., 2003; R ¨ais ¨anen et al., 2004). In
15
Finland, the episodes were strongest in south, but they were observed weaker over a wide area, including as far north as Oulu, 600 km from southern coast of Finland.
The maximum hourly PM10 concentrations were 70–90µg m−3 in Southern Finland
during the episodes, whereas the typical values in these areas are ∼15–20µg m−3
(Anttila et al., 2003). The EPI-3 was especially strong in Southeastern Finland, where
20
the maximum hourly PM10 concentrations were 200–220µg m−3. Most of the particle
mass was in the PM2.5 size range, and PM2.5 values observed during the episodes
were multifold compared with long-term mean values. E.g. at Kallio in Helsinki, the
maximum hourly PM2.5 values (maximum 24-h mean values in parenthesis) were 45
(33), 54 (42) and 81 (29) µg m−3 during the EPI-1, EPI-2 and EPI-3, respectively,
25
ACPD
5, 2469–2501, 2005Aerosol episodes in Finland caused by
wildfires
J. V. Niemi et al.
Title Page
Abstract Introduction
Conclusions References
Tables Figures
◭ ◮
◭ ◮
Back Close
Full Screen / Esc
Print Version
Interactive Discussion
EGU
et al., 2003). The concentrations of coarse particles (low PM2.5-PM10 values in Fig. 2)
increased also slightly during the episodes, especially during the EPI-1.
August and the beginning of September 2002 were exceptional warm and dry in Finland and in the neighbouring areas. For example, the monthly mean temperature
at Kaisaniemi in Helsinki was 19.4◦C in August, whereas the long term (1971–2002)
5
mean value is 15.8◦C. The total monthly precipitation values were 6 and 5 mm in August
and September, while the long term (1971–2000) mean values are 78 and 66 mm, respectively. August 2002 was the warmest August and September 2002 the driest September of 100 year period. During the episodes at Pasila in Helsinki, the wind
speed (hourly mean) was 2–6 m s−1, relative humidity 40–90% and temperature 15–
10
28◦C.
The backward trajectories showed that air masses arrived to Helsinki during the EPI-1 from Eastern Estonia, Russia and Ukraine (Fig. 3). During the EPI-2, trajectories curved along a more western route, and air masses arrived to Helsinki from Russia via the Baltic Sea and the Baltic countries (Estonia, Latvia and Lithuania). The EPI-3 was
15
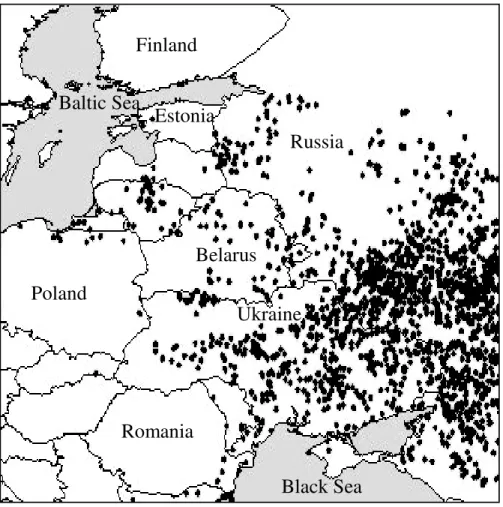
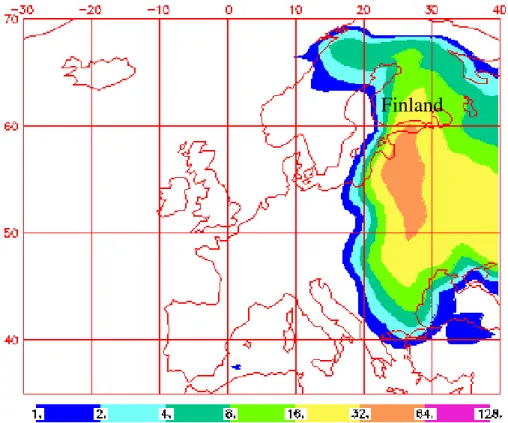
strongest in South-eastern Finland, and air masses arrived over Virolahti and Imatra from the direction of Russia and Eastern Estonia. The satellite observations of potential fire areas indicated that there were many wildfires in Russia, Ukraine and Belarus and in the Baltic countries during the episodes. The amount of fires near Finland was high already before and during the EPI-1 (Fig. 4). High emissions from large forest and peat
20
fires led to accumulation of large smoke plumes over Eastern Europe (Goldammer, 2003). The NAAPS model results indicated that the strongest smoke plumes reached Finland during the EPI-2 and especially during EPI-3 (Fig. 5).
3.2. Particle mass and number size distributions
We compared the particle mass and number size fractions at Hyyti ¨al ¨a measurement
25
ACPD
5, 2469–2501, 2005Aerosol episodes in Finland caused by
wildfires
J. V. Niemi et al.
Title Page
Abstract Introduction
Conclusions References
Tables Figures
◭ ◮
◭ ◮
Back Close
Full Screen / Esc
Print Version
Interactive Discussion
EGU
3 days, and therefore we had to select slightly different periods for EPI-2 and EPI-3 in
this Sect. 3.2 compared with other sections of this paper. Most of the particle mass was in the submicrometre size range during all episodes as well as on the reference days. During the episodes the particle mass increased on average by a factor of 3
for the size classes PM1 and PM1−2.5 and by a factor of 2 for the size class PM2.5−10,
5
but above 10µm size class the concentration remained about at the reference level.
During the three episodes, all these PM concentrations were close to those observed during the LRT episode in March 2002, which originated from agricultural field-burning emissions mixed with fossil fuel burning emissions (Niemi et al., 2004).
The particle number concentration increased on average by a factor of 1.8 in the
ac-10
cumulation mode and decreased (by a factor of 0.5) in the Aitken and nucleation modes (Table 2 and Fig. 6a). The decrease of the smallest particles was expected, since small
molecular clusters and particles are scavenged efficiently by high amount of larger
par-ticles (see e.g. M ¨onkk ¨onen et al., 2004). Abundant surface area of larger parpar-ticles also consumes condensable vapours preventing particle formation and growth. The total
15
concentration of particles with diameter less than 500 nm was fairly unaffected, since
the decrease in nucleation and Aitken mode concentrations was balanced by the in-crease in accumulation mode concentrations.
Figure 6b shows how big a fraction of particles smaller than 500 nm in diameter be-long to accumulation and nucleation modes. The ratio of accumulation mode
concen-20
tration to Aitken mode concentration (Accum/Aitken) is also shown. The Aitken mode particles cannot be transported in the atmosphere from as far away as accumulation
mode particles. The deposition efficiency of Aitken mode particles is high, they
disap-pear by colliding and sticking to the accumulation mode particles, and they grow fast due to condensation of vapours. Furthermore, the sources of Aitken mode particles
25
are scarce in the areas around Hyyti ¨al ¨a. Thus, Aitken mode concentrations in Hyyti ¨al ¨a normally exceed those of the accumulation mode, and Accum/Aitken ratio greater than one is typical for polluted air masses transported over long distances. The high values
ACPD
5, 2469–2501, 2005Aerosol episodes in Finland caused by
wildfires
J. V. Niemi et al.
Title Page
Abstract Introduction
Conclusions References
Tables Figures
◭ ◮
◭ ◮
Back Close
Full Screen / Esc
Print Version
Interactive Discussion
EGU concept is also supported by the observations made during the LRT episode in March
2002.
3.3. Ion analyses
The 24-h mean TSP concentrations of sulphate, total nitrate, and total ammonium increased strongly at the rural EMEP station of Virolahti during the episodes (Fig. 7).
5
The ion sum (total amount) of these chemical components was 8.2, 7.2 and 12.1µg
m−3 during EPI-1, EPI-2 and EPI-3, respectively. The ion sum in Ut ¨o was about the
same level as in Virolahti, whereas that in ¨Aht ¨ari, more northern station (see Fig. 1),
was clearly lower (factor of 2/3). The values during the episodes were 3–4 times higher than those usually observed at these three stations in this time of year (Leinonen,
10
2001).
We compared ion sum and PM10 concentration measured in Virolahti during the
episodes and reference period (Fig. 8). The ion sum to PM10 ratios were lower than
usually during the episodes; means were 0.28, 0.18, 0.17 and 0.33 during 1, EPI-2, EPI-3 and reference period, respectively. This indicates that the particle matter
15
contained unusually high fractions of other chemical components than sulphate, nitrate
and ammonium during the episodes. The ion sum to PM10 ratio was especially low
(0.14) during the peak stage of EPI-3 (6 September 2002), when strongest smoke plume from wildfires reached South-eastern Finland. Large emissions of organic and black carbon and other chemical components from wildfires was probably the main
20
reason for the reduction of the relative fraction of ion sum during the episodes as will be discussed below.
3.4. Individual particle analysis with SEM/EDX
We analyzed the elemental composition of single particles and agglomerates with SEM/EDX from samples collected during the episodes and reference days. The
parti-25
abun-ACPD
5, 2469–2501, 2005Aerosol episodes in Finland caused by
wildfires
J. V. Niemi et al.
Title Page
Abstract Introduction
Conclusions References
Tables Figures
◭ ◮
◭ ◮
Back Close
Full Screen / Esc
Print Version
Interactive Discussion
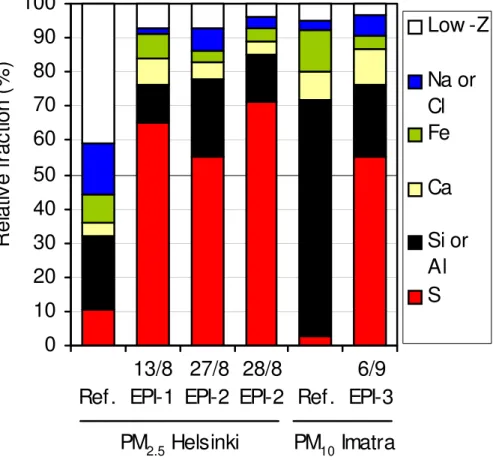
EGU dant in each particle: (1) S, (2) Si or Al, (3) Ca, (4) Fe, (5) Na or Cl, (6) low-Z. Particles
in the low-Z class contained only elements with an atomic number lower than 11 (Na), such as C, N and O, which could not be analysed quantitatively with the SEM/EDX we used. We also classified particles with hierarchical cluster analysis (SPSS 10.0 statisti-cal program) using Ward’s method with squared Euclidean measures, which suits well
5
to grouping of different particle types (Bernard and Van Grieken, 1992). However, the
elemental composition of the main particle type (S-rich) during the episodes proved to be so homogenous that we show only some details of the clustering classification.
The amount of S-rich particles and agglomerates was extraordinarily high during the
episodes (Fig. 9). The PM2.5 samples of the urban background station at Kallio
con-10
tained 65% and 71% S-rich particles during the peak day of EPI-1 and EPI-2, respec-tively, but only on average 10% (range 7–13%) during the reference days. The EPI-3
was clearly strongest in South-eastern Finland, but unfortunately no PM2.5 samples
were collected during that time there. Therefore we studied PM10samples collected at
urban station in Imatra. The fraction of S-rich particles was also very high (55%) during
15
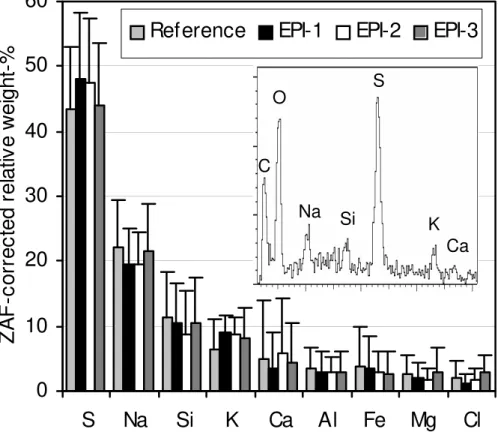
the peak day of EPI-3 in Imatra compared with the value (3%) of the reference day. In addition to S, S-rich particles and agglomerates contained large amounts of C and O as well as some Na, Si and K (EDX spectra shown in Fig. 10). The presence of C was confirmed by analysing some S-rich particles and agglomerates directly on the gold coated surface of (C-free) fibreglass filters. The fractions of other elements
20
were usually quite low, but some of the particles contained also elevated
concentra-tions of Ca. The elemental ratios of S-rich particles in different samples were
com-pared (Fig. 10). K was the only element the relative weight percentage of which had
statistically significant (p<0.01, Mann-Whitney U-test, SPSS 10.0 statistical program)
differences between episode and reference samples. The relative weight percentages
25
burn-ACPD
5, 2469–2501, 2005Aerosol episodes in Finland caused by
wildfires
J. V. Niemi et al.
Title Page
Abstract Introduction
Conclusions References
Tables Figures
◭ ◮
◭ ◮
Back Close
Full Screen / Esc
Print Version
Interactive Discussion
EGU ing but also from many other sources, e.g. marine aerosols, fossil fuel burning and
refuse incineration (Watson et al., 2001; Ooki et al., 2002).
The relative weigh percentages of K in S-rich particles did not rise (range 8.2–8.9%)
as high as during the LRT PM2.5 episode in March 2002 (range 11.4–19.3%), which
originated from agricultural field burning emissions mixed with fossil fuel burning
emis-5
sions (Niemi et al., 2004). The smouldering burning conditions are more dominating in boreal forest fires and peat fires compared with grass, shrub or cereal waste fires, which are mainly burned in flaming conditions (Echalar et al., 1995; Lavoue et al., 2000; Ortiz de Z ´arate et al., 2000; Soja et al., 2004). Thus it seems likely that aerosols from forest and peat fires were less enriched with K than aerosols from agricultural
10
field burning since the fraction of K is lower in the emissions from smouldering fires compared with flaming fires (Echalar et al., 1995; Gaudichet et al., 1995; Robinson et al., 2004). Another reason to relatively low proportion of K was probably the mixing of emissions from fossil fuel burning since air masses arrived from the regions of Eastern Europe with high S emissions (EMEP, 2001). However, the fraction of fossil fuel
burn-15
ing emissions in LRT particle mass was probably smaller during the wildfire episodes compared with the March 2002 episode, because the relative weight ratio of S in S-rich particles did not rise as high as during the peak stage of the March episode (61%) (Niemi et al., 2004).
The PM measurements performed in Helsinki showed that mass concentrations of
20
coarse (PM2.5−10) particles also increased slightly during the episodes (see Fig. 2).
Since Si-Al-rich particles are usually clearly the dominating group of PM10 particles in
Helsinki and other Finnish cities (Haapala, 1999; R ¨ais ¨anen et al., 2004), we compared the relative fractions of the Si-Al-rich group with the other groups. The ratio of Ca-rich to Si-Al-rich particle groups proved to be exceptional high during all the three episodes
25
in Helsinki, and also in Imatra during EPI-3 (Table 3). The ratios were 0.24–0.53, which are 3–7 times higher than the values of the reference days and the long-term averages in Helsinki and Lappeenranta (Haapala, 1999; R ¨ais ¨anen et al., 2004).
ACPD
5, 2469–2501, 2005Aerosol episodes in Finland caused by
wildfires
J. V. Niemi et al.
Title Page
Abstract Introduction
Conclusions References
Tables Figures
◭ ◮
◭ ◮
Back Close
Full Screen / Esc
Print Version
Interactive Discussion
EGU Ca-rich particles were also brought by LRT during the episodes. Their mode and
me-dian sizes (geometric diameter) were 2 and 3µm. The elemental combinations of
Ca-rich particles were investigated with cluster analysis, and typical combinations were Ca, Ca-S-(Si-Na), Ca-(S-Si-Al) and Ca-Mg-(Si) (minor elements in parentheses). The elemental combinations suggest that major components of Ca-rich particles might have
5
been CaCO3, CaSO4and CaMg(CO3)2.
Forest and peat fires were probably one of the major sources of Ca-rich particles during the episodes since Ca-rich particles are emitted from incomplete burning of
biomass and most of their mass is in coarse (Dp>1µm) size fraction (Allen and Miguel,
1995; Osan et al., 2002; Li et al., 2003; Pagels et al., 2003). Intensive fires also
10
mobilise particles from the surfaces of plants and ground (Allen and Miguel, 1995; Gaudichet et al., 1995; Pereira et al., 1996). The injection heights of particles from
forest fires are in moderate surface fires usually∼2.3 km or less and in intensive crown
fires∼5–12 km (Lavoue et al., 2000). Therefore the smallest particles of coarse size
fraction may well be transported from the wildfire areas to Finland.
15
Ca-rich particles are also emitted from many other sources including fossil fuel burn-ing and cement and metal industries (Hoornaert et al., 1996; Lee and Pacyna, 1999). The trajectories indicated that air masses arrived to Helsinki during EPI-1 and to Ima-tra during EPI-3 via Estonian and Russian oil-shale burning industrial areas located in
Narva (see Figs. 1 and 3) and Slantsy (∼25 km south from Narva). This area is one of
20
the strongest particle sources of Northern Europe (EMEP, 2002), and the Ca content of emissions is high (H ¨as ¨anen et al., 1997; Jalkanen et al., 2000; Tervahattu et al., 2004). These large emissions occasionally increase particle concentrations even in southern Finland under suitable meteorological conditions (Jalkanen et al., 2000; Tervahattu et al., 2004). Thus it is likely that Ca-rich particles may also have been transported from
25
ACPD
5, 2469–2501, 2005Aerosol episodes in Finland caused by
wildfires
J. V. Niemi et al.
Title Page
Abstract Introduction
Conclusions References
Tables Figures
◭ ◮
◭ ◮
Back Close
Full Screen / Esc
Print Version
Interactive Discussion
EGU
4. Summary and conclusions
Strong LRT PM2.5 episodes occurred on 12–15 August, 26–28 August and 5–6
September 2002 on the large areas of Finland. Backward air mass trajectories, satel-lite detections of fire areas, and dispersion modelling results indicate that emissions from wildfires in Russia and other Eastern European countries arrived to Finland
dur-5
ing the episodes. The composition of individual particles and agglomerates was stud-ied using scanning electron microscopy (SEM) coupled with energy dispersive X-ray
analyses (EDX), and the bulk chemical concentrations of sulphate (SO2−
4 ), total
ni-trate (NO−
3+HNO3(g)) and total ammonium (NH+4+NH3(g)) was studied using ion
chro-matography (IC). SEM/EDX analysis showed that the proportion of S-rich particles
10
increased strongly during the episodes and that the relative weight percentage of K was unusually high in these particles. The high proportion of K indicates emissions from biomass burning. These aerosols were mixed with S-rich emissions from fossil fuel burning during the transport, since air masses came through polluted areas of Europe. Minor amounts of coarse Ca-rich particles were also long-range transported
15
during the episodes, and they probably originated from wildfires and/or from the Esto-nian and Russian oil-shale burning industrial areas. The concentrations of sulphate, total nitrate, and total ammonium increased during the episode, but the ratio of total
concentrations of these ions and PM10 concentration decreased. This also confirms
the presence of high amounts of particles originated from unusual (above mentioned)
20
emissions sources. The composition of particles during the episodes were compared
with earlier LRT PM2.5 episode originated from spring-time agricultural field burning,
and the fraction of K was lower during the wildfire episodes, probably due to the domi-nance of smouldering burning conditions during boreal forest and peat fires.
The particle mass fractions were measured using a 3-stage impactor with a backup
25
filter. Most of the LRT particle mass was in the submicrometre size fraction, and the mass of the submicrometre particles increased on an average by a factor of 3 during
ACPD
5, 2469–2501, 2005Aerosol episodes in Finland caused by
wildfires
J. V. Niemi et al.
Title Page
Abstract Introduction
Conclusions References
Tables Figures
◭ ◮
◭ ◮
Back Close
Full Screen / Esc
Print Version
Interactive Discussion
EGU mobility particle sizer (DMPS), and the number concentration of 90–500 nm particles
increased by a factor of 1.8 during the episodes, but the concentrations of particles smaller than 90 nm were reduced. The reduction of the smallest particles was caused by suppressed new particle formation due to the vapour and molecular cluster uptake of
LRT particles. These results show how strongly the LRT of particles affect not only the
5
fine particle mass but also the number size distributions of submicron particles. The
high values (>1) of accumulation mode to Aitken mode number concentration ratios
seem to be a good indicator of LRT episodes, because Aitken mode particles cannot be transported in the atmosphere from as far away as accumulation mode particles.
Our results show that the emissions from wildfires in Russian and other Eastern
10
European substantially affected PM2.5concentrations on very large areas, even at
dis-tance over 1000 km from the fire areas. The wildfire season 2002 was exceptional se-vere in Eastern Europe. However, the measurements made by fire-monitoring satellites (http://firemaps.geog.umd.edu) and NAAPS model results (http://www.nrlmry.navy.mil/
aerosol/) indicate that smoke from uncontrolled fires (and from agricultural field
burn-15
ing) is generally an important factor deteriorating air quality locally and even regionally in eastern and southern parts of Europe.
Acknowledgements. We acknowledge the Helsinki University Environmental Research Centre, the Finnish Cultural Foundation, the Helsinki Metropolitan Area Council and the Academy of Finland for funding this study. The Cooperative Institute for Research in Environmental
Sci-20
ences, University of Colorado at Boulder, is gratefully acknowledged for a Visiting Fellowship (HT). We would like to thank our colleagues at the following institutes for their collaboration dur-ing the work: P. Aalto and V. Hiltunen (Division of Atmospheric Sciences, University of Helsinki), R. Hillamo, J. Kukkonen and T. Salmi (Finnish Meteorological Institute), M. R ¨ais ¨anen (The Ge-ological Survey of Finland), K. Kupiainen (Nordic Envicon Ltd.), K. Lounatmaa (Helsinki
Uni-25
versity of Technology) and O. H ¨anninen (Department of Environmental Health, National Public Health Institute). The authors gratefully acknowledge the NOAA Air Resources Laboratory (ARL) for the provision of the HYSPLIT transport and dispersion model and READY website (http://www.arl.noaa.gov/ready.html) used in this publication. The Naval Research Laboratory is acknowledged for the NAAPS model results (website athttp://www.nrlmry.navy.mil/aerosol/)
ACPD
5, 2469–2501, 2005Aerosol episodes in Finland caused by
wildfires
J. V. Niemi et al.
Title Page
Abstract Introduction
Conclusions References
Tables Figures
◭ ◮
◭ ◮
Back Close
Full Screen / Esc
Print Version
Interactive Discussion
EGU
used in this article.
References
Aalto, P., H ¨ameri, K., Becker, E., Weber, R., Salm, J., M ¨akel ¨a, J. M., Hoell, C., O’Dowd, C. D., Karlsson, H., Hansson, H. C., V ¨akev ¨a, M., Koponen, I. K., Buzorius, G., and Kulmala, M.: Physical characterization of aerosol particles during nucleation events, Tellus, 53B, 344–358,
5
2001.
Allen, A. G. and Miguel, A. H.: Biomass burning in the Amazon – Characterization of the ionic component of aerosols generated from flaming and smoldering rain-forest and savannah, Environ. Sci. Technol., 29, 486–493, 1995.
Andreae, M. O.: Soot carbon and excess fine potassium: Long-range transport of combustion
10
derived aerosols, Science, 220, 1148–1151, 1983.
Andreae, M. O., Andreae, T. W., Annegarn, H., Beer, J., Cachier, H., le Canut, P., Elbert, W., Maenhaut, W., Salma, I., Wienhold, F. G., and Zenker, T.: Airborne studies of aerosol emis-sions from savanna fires in southern Africa: 2. Aerosol chemical composition, J. Geophys. Res., 103, 32 119–32 128, 1998.
15
Anttila, P., Alaviippola, B., and Salmi, T.: Air quality in Finland – monitoring results in relation to the guideline and limit values and comparision with European concentration levels (in Finnish with an English abstract) Finnish Meteorological Institute, Helsinki, 2003.
Bernard, P. C. and Van Grieken, R. E.: Comparison and evaluation of hierarchical cluster tech-niques applied to automated electron probe x-ray microanalysis data, Anal. Chim. Acta, 267,
20
81–93, 1992.
Dockery, D. W. and Pope, C. A.: Acute respiratory effects of particulate air-pollution, Annu. Rev. Public Health, 15, 107–132, 1994.
Draxler, R. R. and Rolph, G. D.: HYSPLIT (HYbrid Single-Particle Lagrangian Integrated Trajec-tory), Model access via NOAA ARL READY Website (http://www.arl.noaa.gov/ready/hysplit4.
25
html), NOAA Air Resources Laboratory, Silver Spring, MD., 2003.
ACPD
5, 2469–2501, 2005Aerosol episodes in Finland caused by
wildfires
J. V. Niemi et al.
Title Page
Abstract Introduction
Conclusions References
Tables Figures
◭ ◮
◭ ◮
Back Close
Full Screen / Esc
Print Version
Interactive Discussion
EGU
EMEP: Transboundary acidification and eutrophication and ground level ozone in Europe, Joint CIAM & CCC & MSC-W report, 2001.
EMEP: Transboundary particulate matter in Europe: Status Report 2002, pp. 89, EMEP Report 5/2002, 2002.
Gaudichet, A., Echalar, F., Chatenet, B., Quisefit, J. P., Malingre, G., Cachier, H., Buatmenard,
5
P., Artaxo, P., and Maenhaut, W.: Trace-elements in tropical African savanna biomass burn-ing aerosols, J. Atmos. Chem., 22, 19–39, 1995.
Goldammer, J. G.: The wildland fire season 2002 in the Russian Federation: An assessment by the Global Fire Monitoring Center (GFMC), International Forest Fire News (IFFN), 28, 2–14, 2003.
10
Haapala, H.: Studies of inhalable particles of aerosol samplers, (Finnish report includes an abstract in English), pp. 37, Helsinki Metropolitan Area Council, Helsinki, 1999.
H ¨as ¨anen, E., AunelaTapola, L., Kinnunen, V., Larjava, K., Mehtonen, A., Salmikangas, T., Leskel ¨a, J., and Loosaar, J.: Emission factors and annual emissions of bulk and trace ele-ments from oil shale fueled power plants, Sci. Total Environ., 198, 1–12, 1997.
15
Hoornaert, S., Van Malderen, H., and Van Grieken, R.: Gypsum and other calcium-rich aerosol particles above the North Sea, Environ. Sci. Technol., 30, 1515–1520, 1996.
Jalkanen, L., M ¨akinen, A., H ¨as ¨anen, E., and Juhanoja, J.: The effect of large anthropogenic particulate emissions on atmospheric aerosols, deposition and bioindicators in the eastern Gulf of Finland region, Sci. Total Environ., 262, 123–136, 2000.
20
Justice, C. O., Giglio, L., Korontzi, S., Owens, J., Morisette, J. T., Roy, D., Descloitres, J., Alleaume, S., Petitcolin, F., and Kaufman, Y.: The MODIS fire products, Remote Sensing of Environment, 83, 244–262, 2002.
Karppinen, A., H ¨ark ¨onen, J., Kukkonen, J., Aarnio, P., and Koskentalo, T.: Statistical model for assessing the portion of fine particulate matter transported regionally and long range to
25
urban air, Scandinavian Journal of Work, Environment & Health, 30, 47–53, 2004.
Kulmala, M., H ¨ameri, K., Aalto, P. P., M ¨akel ¨a, J. M., Pirjola, L., Nilsson, E. D., Buzorius, G., Rannik, ¨U., Dal Maso, M., Seidl, W., Hoffman, T., Janson, R., Hansson, H. C., Viisanen, Y., Laaksonen, A., and O’Dowd, C. D.: Overview of the international project on biogenic aerosol formation in the boreal forest (BIOFOR), Tellus, 53, 324–343, 2001.
30
ACPD
5, 2469–2501, 2005Aerosol episodes in Finland caused by
wildfires
J. V. Niemi et al.
Title Page
Abstract Introduction
Conclusions References
Tables Figures
◭ ◮
◭ ◮
Back Close
Full Screen / Esc
Print Version
Interactive Discussion
EGU
Diurnal and annual characteristics of particle mass and number concentrations in urban, rural and Arctic environments in Finland, Atmos. Environ., 37, 2629–2641, 2003.
Laden, F., Neas, L. M., Dockery, D. W., and Schwartz, J.: Association of fine particulate matter from different sources with daily mortality in six US cities, Environ. Health Perspect., 108, 941–947, 2000.
5
Lavoue, D., Liousse, C., Cachier, H., Stocks, B. J., and Goldammer, J. G.: Modeling of carbona-ceous particles emitted by boreal and temperate wildfires at northern latitudes, J. Geophys. Res., 105, 26 871–26 890, 2000.
Lee, D. S. and Pacyna, J. M.: An industrial emissions inventory of calcium for Europe, Atmos. Environ., 33, 1687–1697, 1999.
10
Leinonen, L.: Air quality measurements 2000, Finnish Meteorological Institute, Helsinki, 2001. Li, J., P ´osfai, M., Hobbs, P. V., and Buseck, P. R.: Individual aerosol particles from biomass
burning in southern Africa: 2, Compositions and aging of inorganic particles, J. Geophys. Res., 108, 8484, doi:10.1029/2002JD002310, 2003.
M ¨onkk ¨onen, P., Koponen, I. K., Lehtinen, K. E. J., Uma, R., Srinivasan, D., H ¨ameri, K., and
15
Kulmala, M.: Death of nucleation and Aitken mode particles: observations at extreme atmo-spheric conditions and their theoretical explanation, J. Aerosol. Sci., 35, 781–787, 2004. Niemi, J., Tervahattu, H., Koskentalo, T., Sillanp ¨a ¨a, M., Hillamo, R., Kulmala, M., and
Vehkam ¨aki, H.: Studies on the long-range transport episodes of particles in Finland in March and August 2002 (Finnish report includes an abstract in English), pp. 58, Helsinki
Metropoli-20
tan Area Council, Helsinki, 2003, available also from internet URL: http://www.ytv.fi/ilmanl/ aineisto/kaukokulkeumaepisodi 2003.pdf.
Niemi, J. V., Tervahattu, H., Vehkam ¨aki, H., Kulmala, M., Koskentalo, T., Sillanp ¨a ¨a, M., and Rantam ¨aki, M.: Characterization and source identification of a fine particle episode in Fin-land, Atmos. Environ., 38, 5003–5012, 2004.
25
Ooki, A., Uematsu, M., Miura, K., and Nakae, S.: Sources of sodium in atmospheric fine particles, Atmos. Environ., 36, 4367–4374, 2002.
Ortiz de Z ´arate, I., Ezcurra, A., Lacaux, J. P., and Van Dinh, P.: Emission factor estimates of cereal waste burning in Spain, Atmos. Environ., 34, 3183–3193, 2000.
Osan, J., Alfoldy, B., Torok, S., and Van Grieken, R.: Characterisation of wood combustion
30
particles using electron probe microanalysis, Atmos. Environ., 36, 2207–2214, 2002. Paatero, J., Valkama, I., Makkonen, U., Laur ´en, M., Salminen, K., Raittila, J., and Viisanen,
ACPD
5, 2469–2501, 2005Aerosol episodes in Finland caused by
wildfires
J. V. Niemi et al.
Title Page
Abstract Introduction
Conclusions References
Tables Figures
◭ ◮
◭ ◮
Back Close
Full Screen / Esc
Print Version
Interactive Discussion
EGU
Finland during the BIOFOR project 1998–1999, Finnish Meteorological Institute, Helsinki, 2001.
Pagels, J., Strand, M., Rissler, J., Szpila, A., Gudmundsson, A., Bohgard, M., Lillieblad, L., Sanati, M., and Swietlicki, E.: Characteristics of aerosol particles formed during grate com-bustion of moist forest residue, J. Aerosol. Sci., 34, 1043–1059, 2003.
5
Pakkanen, T. A., Loukkola, K., Korhonen, C. H., Aurela, M., Makela, T., Hillamo, R. E., Aarnio, P., Koskentalo, T., Kousa, A., and Maenhaut, W.: Sources and chemical composition of atmospheric fine and coarse particles in the Helsinki area, Atmos. Environ., 35, 5381–5391, 2001.
Pereira, E. B., Setzer, A. W., Gerab, F., Artaxo, P. E., Pereira, M. C., and Monroe, G.:
Air-10
borne measurements of aerosols from burning biomass in Brazil related to the TRACE a experiment, J. Geophys. Res., 101, 23 983–23 992, 1996.
Pope, C. A., Burnett, R. T., Thun, M. J., Calle, E. E., Krewski, D., Ito, K., and Thurston, G. D.: Lung cancer, cardiopulmonary mortality, and long-term exposure to fine particulate air pollution, Jama-Journal of the American Medical Association, 287, 1132–1141, 2002.
15
R ¨ais ¨anen, M., Niemi, J. V., Tervahattu, H., and Kupiainen, K.: Composition of aerosol particles in the region of Lappeenranta in 2002–2003 (in Finnish), pp. 57, City of Lappeenranta, 2004. Robinson, M. S., Chavez, J., Velazquez, S., and Jayanty, R. K. M.: Chemical speciation of PM2.5
collected during prescribed fires of the Coconino national forest near Flagstaff, Arizona, J. Air Waste Manage. Assoc., 54, 1112–1123, 2004.
20
Rolph, G. D.: Real-time Environmental Applications and Display sYstem (READY) Web-site (http://www.arl.noaa.gov/ready/hysplit4.html), NOAA Air Resources Laboratory, Silver Spring, MD., 2003.
Ruoho-Airola, T., Anttila, P., and Salmi, T.: Airborne sulfur and nitrogen in Finland – trends and exposure in relation to air transport sector, J. Environ. Monit., 6, 1–11, 2004.
25
Ruuskanen, J., Tuch, T., Ten Brink, H., Peters, A., Khlystov, A., Mirme, A., Kos, G. P. A., Brunekreef, B., Wichmann, H. E., and Buzorius, G.: Concentrations of ultrafine, fine and PM2.5particles in three European cities, Atmos. Environ., 35, 3729–3738, 2001.
Soja, A. J., Cofer, W. R., Shugart, H. H., Sukhinin, A. I., Stackhouse, P. W., McRae, D. J., and Conard, S. G.: Estimating fire emissions and disparities in boreal Siberia (1998–2002), J.
30
Geophys. Res., 109, D14S06, doi:10.1029/2004JD004570, 2004.
ACPD
5, 2469–2501, 2005Aerosol episodes in Finland caused by
wildfires
J. V. Niemi et al.
Title Page
Abstract Introduction
Conclusions References
Tables Figures
◭ ◮
◭ ◮
Back Close
Full Screen / Esc
Print Version
Interactive Discussion
EGU
107, 4053, doi:10.1029/2000JD000282, 2002a.
Tervahattu, H., Juhanoja, J., and Kupiainen, K.: Identification of an organic coating on marine aerosol particles by TOF-SIMS, J. Geophys. Res., 107, 4319, doi:10.1029/2001JD001403, 2002b.
Tervahattu, H., Hongisto, M., Aarnio, P., Kupiainen, K., and Sillanp ¨a ¨a, M.: Composition and
5
origins of aerosol during a high PM10 episode in Finland, Boreal Env. Res., 9, 335–345, 2004.
Vallius, M., Lanki, T., Tiittanen, P., Koistinen, K., Ruuskanen, J., and Pekkanen, J.: Source ap-portionment of urban ambient PM2.5in two successive measurement campaigns in Helsinki, Finland, Atmos. Environ., 37, 615–623, 2003.
10
Virkkula, A., Aurela, M., Hillamo, R., M ¨akel ¨a, T., Pakkanen, T., Kerminen, V. M., Maenhaut, W., Francois, F., and Cafmeyer, J.: Chemical composition of atmospheric aerosol in the European subarctic: Contribution of the Kola Peninsula smelter areas, central Europe, and the Arctic Ocean, J. Geophys. Res., 104, 23 681–23 696, 1999.
Watson, J. G., Chow, J. C., and Houck, J. E.: PM2.5chemical source profiles for vehicle exhaust,
15
vegetative burning, geological material, and coal burning in Northwestern Colorado during 1995, Chemosphere, 43, 1141–1151, 2001.
WHO: World health report, Reducing risks, promoting healthy life, World Health Organization, Geneva, 2002.
WHO: Health aspects of air pollution with particulate matter, ozone and nitrogen dioxide, World
20
Health Organization, Bonn, 2003.
Yli-Tuomi, T., Hopke, P. K., Paatero, P., Basunia, M. S., Landsberger, S., Viisanen, Y., and Paatero, J.: Atmospheric aerosol over Finnish Arctic: source analysis by the multilinear engine and the potential source contribution function, Atmos. Environ., 37, 4381–4392, 2003.
ACPD
5, 2469–2501, 2005Aerosol episodes in Finland caused by
wildfires
J. V. Niemi et al.
Title Page
Abstract Introduction
Conclusions References
Tables Figures
◭ ◮
◭ ◮
Back Close
Full Screen / Esc
Print Version
Interactive Discussion
EGU
Table 1.Description of measurement and sampling sites for different analysis.
Location Environment Particle mass Particle number Samples for ion Samples for fraction size distribution chromatography SEM/EDX measurement measurements measurements measurements
Hyyti ¨al ¨a Rural background Size fractionsa x
Virolahti Rural background PM10 x
Ut ¨o Rural background x
¨
Aht ¨ari Rural background x
Helsinki at Kallio Urban background PM10, PM2.5 x
Helsinki at Luukki Rural background PM10 x
Imatra at Mansikkala Urban PM10 x
aD
ACPD
5, 2469–2501, 2005Aerosol episodes in Finland caused by
wildfires
J. V. Niemi et al.
Title Page
Abstract Introduction
Conclusions References
Tables Figures
◭ ◮
◭ ◮
Back Close
Full Screen / Esc
Print Version
Interactive Discussion
EGU
Table 2.Mass and number size fractions in Hyyti ¨al ¨a during the episode (12–15 August, 26–27
August and 6–8 September 2002) and reference days (2 August–15 September 2002 exclud-ing episode days). Sample change time was 5 a.m. UTC. We also show 3-year (1999–2001) mean summer-autumn values (Laakso et al., 2003), and values measured during March (17–19 March 2002) episode (Niemi et al., 2004).
PM1 PM1−2.5 PM2.5−10 PM>10 Nucl. Aitken Accum. Total
(3–25 nm) (25–90 nm) (90–500 nm) (3–500 nm)
µg m−3 µg m−3 µg m−3 µg m−3 # cm−3 # cm−3 # cm−3 # cm−3
Reference days 5.3 1.2 1.2 0.6 489 1138 591 2219
*343 *2072
Episode days 15.9 3.7 2.3 0.7 226 588 1067 1880
*174 *1828
Summer-autumn mean 4.6 1.2 1.3 – *365 1065 710 *2130 (Laakso et al., 2003)
March episode 15.4 6.9 2.3 0.3 273 955 2703 3924
(Niemi et al., 2004) *211 *3867
ACPD
5, 2469–2501, 2005Aerosol episodes in Finland caused by
wildfires
J. V. Niemi et al.
Title Page
Abstract Introduction
Conclusions References
Tables Figures
◭ ◮
◭ ◮
Back Close
Full Screen / Esc
Print Version
Interactive Discussion
EGU
Table 3. The number ratio of particles in Ca-rich particle group and Si-Al-rich particle group
during the episodes (13 August EPI-1, 28 August EPI-2 and 5–6 September 2002 EPI-3) and reference days (Helsinki 22 August 2002 and Imatra 17 September 2002). We also show mean long-term values of the same ratio calculated from Haapala (1999) and from R ¨ais ¨anen et al. (2004).
EPI-1 EPI-2 EPI-3 EPI-3 Reference Haapala (1999)a R ¨ais ¨anen et al. (2004)b Sampling place Helsinki Helsinki Helsinki Imatra Helsinki and Imatra Helsinki Lappeenranta Number of analyzed Ca-rich 77 81 91 35 107 700 1270 and Si-Al-rich particles
Ratio of Ca-rich and 0.24 0.53 0.45 0.49 0.08 0.07 (0.07) 0.11 (0.07) Si-Al-rich groups (SD)
a18 samples collected between March and April 1998
b13 samples collected between March and June 2003, Lappeenranta is a small town located
ACPD
5, 2469–2501, 2005Aerosol episodes in Finland caused by
wildfires
J. V. Niemi et al.
Title Page
Abstract Introduction
Conclusions References
Tables Figures
◭ ◮
◭ ◮
Back Close
Full Screen / Esc
Print Version
Interactive Discussion
EGU
Imatra
ACPD
5, 2469–2501, 2005Aerosol episodes in Finland caused by
wildfires
J. V. Niemi et al.
Title Page
Abstract Introduction
Conclusions References
Tables Figures
◭ ◮
◭ ◮
Back Close
Full Screen / Esc
Print Version
Interactive Discussion
EGU
-20
0
20
40
60
80
100
120
2/8
6/8
10
/8
14
/8
18
/8
22
/8
26
/8
30
/8
3/9
7/9
11
/9
15
/9
Date of year 2002
C
o
n
c
en
tr
a
tio
n
(
µ
g
m
-3
)
Helsinki PM10
Helsinki PM2.5
Imatra PM10
Helsinki PM2.5 - PM10
EPI-1
EPI-2
EPI-3
ACPD
5, 2469–2501, 2005Aerosol episodes in Finland caused by
wildfires
J. V. Niemi et al.
Title Page
Abstract Introduction
Conclusions References
Tables Figures
◭ ◮
◭ ◮
Back Close
Full Screen / Esc
Print Version
Interactive Discussion
EGU
Finland
Poland
Estonia
Russia
Belarus
Ukraine
Sweden
Black Sea
Romania
Fig. 3.Backward air mass trajectories (72 h) to Helsinki during the strongest stage of the EPI-1
ACPD
5, 2469–2501, 2005Aerosol episodes in Finland caused by
wildfires
J. V. Niemi et al.
Title Page
Abstract Introduction
Conclusions References
Tables Figures
◭ ◮
◭ ◮
Back Close
Full Screen / Esc
Print Version
Interactive Discussion
EGU
Finland
Poland
Estonia
Black Sea
Russia
Belarus
Baltic Sea
Ukraine
Romania
ACPD
5, 2469–2501, 2005Aerosol episodes in Finland caused by
wildfires
J. V. Niemi et al.
Title Page
Abstract Introduction
Conclusions References
Tables Figures
◭ ◮
◭ ◮
Back Close
Full Screen / Esc
Print Version
Interactive Discussion
EGU
Finland
Fig. 5.NAAPS model results showing surface smoke concentrations for the strongest stage of
ACPD
5, 2469–2501, 2005Aerosol episodes in Finland caused by
wildfires
J. V. Niemi et al.
Title Page Abstract Introduction Conclusions References Tables Figures ◭ ◮ ◭ ◮ Back Close
Full Screen / Esc
Print Version Interactive Discussion EGU 0 500 1000 1500 2000 2500 3000 3500 2/8 6/8 10 /8 14 /8 18 /8 22 /8 26 /8 30
/8 3/9 7/9
11
/9
15
/9
Date of year 2002
N u m b er c o n c en tr at ion ( c m -3) Accum Aitken Nucl EPI-1 EPI-2 EPI-3 (a) 0.0 0.5 1.0 1.5 2.0 2.5 3.0 3.5 2/8 6/8 10 /8 14 /8 18 /8 22 /8 26 /8 30
/8 3/9 7/9
11
/9
15
/9
Date of year 2002
Accum/Aitken Accum/Total Nucl/Total
EPI-1 EPI-2 EPI-3
(b)
Fig. 6. (a)24-h mean number concentrations of nucleation mode (Nucl, diameter 3–25 nm),
Aitken mode (Aitken, 25–90 nm) and accumulation mode (Accum, 90–500 nm) particles, and
ACPD
5, 2469–2501, 2005Aerosol episodes in Finland caused by
wildfires
J. V. Niemi et al.
Title Page
Abstract Introduction
Conclusions References
Tables Figures
◭ ◮
◭ ◮
Back Close
Full Screen / Esc
Print Version
Interactive Discussion
EGU
0
2
4
6
8
10
12
2/
8
6/
8
10
/8
14
/8
18
/8
22
/8
26
/8
30
/8
3/
9
7/
9
11
/9
15
/9
Date of year 2002
C
onc
entr
a
tio
n
(µ
g m
-3
)
SO4
HNO3 + NO3
NH3 + NH4
EPI-1
EPI-2
EPI-3
Fig. 7. 24-h mean total suspended particle (TSP) concentrations of SO2−
4 , total nitrate
(NO−
3+HNO3(g)), total ammonium (NH+4+NH3(g)) in Virolahti on 2 August–15 September 2002.
ACPD
5, 2469–2501, 2005Aerosol episodes in Finland caused by
wildfires
J. V. Niemi et al.
Title Page
Abstract Introduction
Conclusions References
Tables Figures
◭ ◮
◭ ◮
Back Close
Full Screen / Esc
Print Version
Interactive Discussion
EGU
0
20
40
60
80
100
120
0
5
10
15
20
25
Ion sum (µg m
-3)
PM
10
(µ
g
m
-3
)
Reference
EPI-3
EPI-2
EPI-1
Fig. 8. Scatter plot and linear trend lines between 24-h mean ion sum and PM10
ACPD
5, 2469–2501, 2005Aerosol episodes in Finland caused by
wildfires
J. V. Niemi et al.
Title Page
Abstract Introduction
Conclusions References
Tables Figures
◭ ◮
◭ ◮
Back Close
Full Screen / Esc
Print Version
Interactive Discussion
EGU
0
10
20
30
40
50
60
70
80
90
100
Ref.
13/8
EPI-1
27/8
EPI-2
28/8
EPI-2
Ref.
6/9
EPI-3
R
e
la
tiv
e
fr
ac
tio
n
(
%
)
Low -Z
Na or
Cl
Fe
Ca
Si or
Al
S
PM
10Imatra
PM
2.5Helsinki
Fig. 9.Abundance of particle groups (%) in reference samples and episode samples collected
ACPD
5, 2469–2501, 2005Aerosol episodes in Finland caused by
wildfires
J. V. Niemi et al.
Title Page
Abstract Introduction
Conclusions References
Tables Figures
◭ ◮
◭ ◮
Back Close
Full Screen / Esc
Print Version
Interactive Discussion
EGU
0
10
20
30
40
50
60
S
Na
Si
K
Ca
Al
Fe
Mg
Cl
ZA
F-c
o
rr
e
c
te
d
re
la
tiv
e
w
e
ig
h
t-%
Reference
EPI-1
EPI-2
EPI-3
O
Na Si S
K Ca C
Fig. 10.Average weight percentages of selected elements in S-rich particles (typical SEM/EDX